
In addition to CockroachDB's built-in safeguards against failure, it is critical to actively monitor the overall health and performance of a cluster running in production and to create alerting rules that promptly send notifications when there are events that require investigation or intervention.
This page describes the monitoring and observability tools that are built into CockroachDB self-hosted and shows how to collect your cluster's metrics using external tools like Prometheus's AlertManager for event-based alerting. To export metrics from a CockroachDB Cloud cluster, refer to Export Metrics From a CockroachDB Advanced Cluster instead of this page. For more details, refer to:
If the cluster becomes unavailable, the DB Console and Cluster API will also become unavailable. You can continue to monitor the cluster via the Prometheus endpoint and logs.
Built-in monitoring tools
CockroachDB includes several tools to help you monitor your cluster's workloads and performance.
If a cluster becomes unavailable, most of the monitoring tools in the following sections become unavailable. In that case, Cockroach Labs recommends that you consult the cluster logs. To maintain access to a cluster's historical metrics when the cluster is unavailable, configure a third-party monitoring tool like Prometheus or Datadog to collect metrics periodically from the Prometheus endpoint. The metrics are stored outside the cluster, and can be used to help troubleshoot what led up to an outage.
DB Console
The DB Console collects time-series cluster metrics and displays basic information about a cluster's health, such as node status, number of unavailable ranges, and queries per second and service latency across the cluster. This tool is designed to help you optimize cluster performance and troubleshoot issues. The DB Console is accessible from every node at http://<host>:<http-port>, or http://<host>:8080 by default.
The DB Console automatically runs in the cluster. The following sections describe some of the pages that can help you to monitor and observe your cluster. For more information on accessing the DB Console, see Access DB Console.
Metrics dashboards
The Metrics dashboards, which are located within Metrics in DB Console, provide information about a cluster's performance, load, and resource utilization. The Metrics dashboards are built using time-series metrics collected from the cluster. By default, metrics are collected every 10 minutes and stored within the cluster, and data is retained at 10-second granularity for 10 days , and at 30-minute granularity for 90 days.
To learn more, refer to Overview Dashboard.
Each cluster automatically exposes its metrics at an endpoint in Prometheus format, enabling you to collect them in an external tool like Datadog or your own Prometheus, Grafana, and AlertManager instances. These tools:
- Collect metrics from the cluster's Prometheus endpoint at an interval you define.
- Store historical metrics according to your data retention requirements.
- Allow you to create and share dashboards, reports, and alerts based on metrics.
- Do not run within the cluster, and can help you to investigate a situation that led up to cluster outage even if the cluster is unavailable.
Metrics collected by the DB Console are stored within the cluster, and the SQL queries that create the reports on the Metrics dashboards also impose load on the cluster.
SQL Activity pages
The SQL Activity pages, which are located within SQL Activity in DB Console, provide information about SQL statements, transactions, and sessions.
The information on the SQL Activity pages comes from the cluster's crdb_internal system catalog. It is not exported via the cluster's Prometheus endpoint.
Cluster API
The Cluster API is a REST API that runs in the cluster and provides much of the same information about your cluster and nodes as is available from the DB Console or the Prometheus endpoint, and is accessible from each node at the same address and port as the DB Console.
If the cluster is unavailable, the Cluster API is also unavailable.
For more information, see the Cluster API overview and reference.
crdb_internal system catalog
The crdb_internal system catalog is a schema in each database that contains information about internal objects, processes, and metrics about that database. DBMarlin provides a third-party tool that collects metrics from a cluster's crdb_internal system catalogs rather than the cluster's Prometheus endpoint. Refer to Monitor CockroachDB with DBmarlin.
If the cluster is unavailable, a database's crdb_internal system catalog cannot be queried.
For details, see crdb_internal.
Health endpoints
CockroachDB provides two HTTP endpoints for checking the health of individual nodes.
These endpoints are also available through the Cluster API under /v2/health/.
If the cluster is unavailable, these endpoints are also unavailable.
/health
If a node is down, the http://<host>:<http-port>/health endpoint returns a Connection refused error:
$ curl http://localhost:8080/health
curl: (7) Failed to connect to localhost port 8080: Connection refused
Otherwise, it returns an HTTP 200 OK status response code with an empty body:
{

}
The /health endpoint does not returns details about the node such as its private IP address. These details could be considered privileged information in some deployments. If you need to retrieve node details, you can use the /_status/details endpoint along with a valid authentication cookie.
/health?ready=1
The http://<node-host>:<http-port>/health?ready=1 endpoint returns an HTTP 503 Service Unavailable status response code with an error in the following scenarios:
The node is in the wait phase of the node shutdown sequence. This causes load balancers and connection managers to reroute traffic to other nodes before the node is drained of SQL client connections and leases, and is a necessary check during rolling upgrades.
Tip:If you find that your load balancer's health check is not always recognizing a node as unready before the node shuts down, you can increase the
server.shutdown.initial_waitcluster setting (previously namedserver.shutdown.drain_wait) to cause a node to return503 Service Unavailableeven before it has started shutting down.The node is unable to communicate with a majority of the other nodes in the cluster, likely because the cluster is unavailable due to too many nodes being down.
$ curl http://localhost:8080/health?ready=1
{
  "error": "node is not healthy",
  "code": 14,
  "message": "node is not healthy",
  "details": [
  ]
}
Otherwise, it returns an HTTP 200 OK status response code with an empty body:
{

}
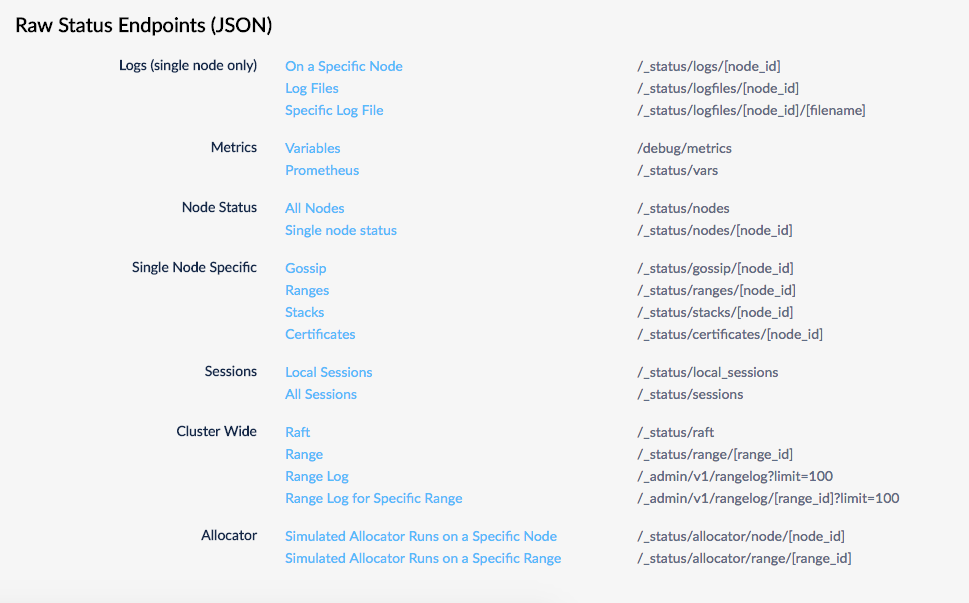
Raw status endpoints
The JSON endpoints are deprecated in favor of the Cluster API.
The /_status/vars metrics endpoint is in Prometheus format and is not deprecated. For more information, refer to Prometheus endpoint.
Several endpoints return raw status meta information in JSON at http://<host>:<http-port>/#/debug. You can investigate and use these endpoints, but note that they are subject to change.
Node status command
The cockroach node status command gives you metrics about the health and status of each node.
- With the
--rangesflag, you get granular range and replica details, including unavailability and under-replication. - With the
--statsflag, you get granular disk usage details. - With the
--decommissionflag, you get details about the node decommissioning process. - With the
--allflag, you get all of the above.
Prometheus endpoint
Each node in a CockroachDB cluster exports granular time-series metrics at two available endpoints:
For more information, refer to the Prometheus Endpoint page.
Critical nodes endpoint
The critical nodes status endpoint is used to:
- Check if any of your nodes are in a critical state. A node is critical if that node becoming unreachable would cause replicas to become unavailable.
- Check if any ranges are under-replicated or unavailable. This is useful when determining whether a node is ready for decommissioning.
- Check if any of your cluster's data placement constraints (set via multi-region SQL or direct configuration of replication zones) are being violated. This is useful when implementing data domiciling or troubleshooting zone configurations generally.
If you find under-replicated ranges or constraint violations, you will need to Troubleshoot your replication zones.
Fields
The JSON object returned by the critical nodes status endpoint contains the following top-level fields.
| Field | Description |
|---|---|
criticalNodes |
A list of nodes that are critical. Critical nodes are not safe to terminate because data loss could occur. |
report.overReplicated |
A list of ranges that are over-replicated vs. your zone config settings. |
report.violatingConstraints |
A list of ranges that are in violation of your zone config settings. |
report.unavailable |
A list of ranges that are unavailable. |
report.unavailableNodeIds |
A list of node IDs with unavailable ranges. |
report.underReplicated |
A list of ranges that are under-replicated vs. your zone config settings. |
The criticalNodes portion of the response contains a (possibly empty) list of objects, each of which has the following fields.
| Field | Example | Description |
|---|---|---|
nodeId |
2 |
The node ID of the critical node. |
address |
{...} |
An object representing the network address of the node. |
locality |
{...} |
An object representing the locality of the node. |
ServerVersion |
{...} |
An object representing the CockroachDB version of the node. |
buildTag |
"v23.1.0-rc.2" |
The git build tag of the CockroachDB release of the node. |
startedAt |
"1683655799845426000" |
The UNIX epoch timestamp at which the node was started. |
clusterName |
"" |
The name of the cluster (if any) with which the node is associated. |
sqlAddress |
{...} |
The network address for SQL connections to the node. |
httpAddress |
{...} |
The address for DB Console HTTP connections to the node. |
Each report subtype (e.g., report.unavailable, report.violatingConstraints, etc.) returns a (possibly empty) list of objects describing the ranges that report applies to. Each object contains a rangeDescriptor and a config that describes the range.
| Field | Example | Description |
|---|---|---|
rangeDescriptor.rangeId |
"89" |
The range ID this section of the report is referring to. |
rangeDescriptor.startKey |
"8okSYW1zdGVyZGFtAAE=" |
The start key for the range. |
rangeDescriptor.endKey |
"8okSYW1zdGVyZGFtAAESszMzMzMzQAD/gAD/AP8A/wD/AP8A/yMAAQ==" |
The end key for the range. |
config.rangeMinBytes |
134217728 |
The target minimum size for the range. |
config.rangeMaxBytes |
536870912 |
The target maximum size for the range. |
config.gcPolicy |
{...} |
An object representing the garbage collection settings for the range (e.g. gc.ttlseconds). |
config.globalReads |
false |
Whether the range enables fast global reads. |
config.numReplicas |
9 |
The replication factor for the range. |
config.numVoters |
0 |
The number of voting replicas for the range. |
config.constraints |
[...] |
The constraints for the range. |
config.voterConstraints |
[...] |
The voting replica constraints for the range. |
config.leasePreferences |
[...] |
The lease preferences for the range. |
config.rangefeedEnabled |
false |
Whether rangefeeds are enabled for this range. |
config.excludeDataFromBackup |
false |
Whether this range's data should be excluded from backups. |
Examples
- Replication status - normal
- Replication status - constraint violation
- Replication status - under-replicated ranges
- Replication status - ranges in critical localities
Replication status - normal
The following example assumes you are running a newly started, local multi-region cockroach demo cluster started using the following command:
cockroach demo --global --nodes 9 --insecure
Execute the following statements to set the database regions for the movr database:
 ALTER DATABASE movr SET PRIMARY REGION "us-east1";
 ALTER DATABASE movr ADD REGION "us-west1";
 ALTER DATABASE movr ADD REGION "europe-west1";
curl -X POST http://localhost:8080/_status/critical_nodes
{
  "criticalNodes": [
  ],
  "report": {
    "underReplicated": [
    ],
    "overReplicated": [
    ],
    "violatingConstraints": [
    ],
    "unavailable": [
    ],
    "unavailableNodeIds": [
    ]
  }
}
You may have to wait a few minutes after setting the database regions before getting the 'all clear' output above. This can happen because it takes time for replica movement to occur in order to meet the constraints given by the multi-region SQL abstractions.
Replication status - constraint violation
The following example assumes you are running a newly started, local multi-region cockroach demo cluster started using the following command:
cockroach demo --global --nodes 9 --insecure
Execute the following statements to set the database regions for the movr database:
 ALTER DATABASE movr SET PRIMARY REGION "us-east1";
 ALTER DATABASE movr ADD REGION "us-west1";
 ALTER DATABASE movr ADD REGION "europe-west1";
By default, this multi-region demo cluster will not have any constraint violations.
To introduce a violation that you can then query for, you'll set the table locality to REGIONAL BY TABLE for the movr.users table.
You can use SHOW CREATE TABLE to see what existing table locality is attached to the users table, so you know what to modify.
SHOW CREATE TABLE users;
  table_name |                     create_statement
-------------+-----------------------------------------------------------
  users      | CREATE TABLE public.users (
             |     id UUID NOT NULL,
             |     city VARCHAR NOT NULL,
             |     name VARCHAR NULL,
             |     address VARCHAR NULL,
             |     credit_card VARCHAR NULL,
             |     CONSTRAINT users_pkey PRIMARY KEY (city ASC, id ASC)
             | ) LOCALITY REGIONAL BY TABLE IN PRIMARY REGION
(1 row)
To create a constraint violation, use the ALTER TABLE ... SET LOCALITY statement to tell the ranges in the PRIMARY REGION (us-east1) that they are supposed to be in the europe-west1 locality:
ALTER TABLE users SET LOCALITY REGIONAL BY TABLE IN "europe-west1";
Once the statement above executes, the ranges currently stored in the us-east1 locality will now be in a state where they are explicitly now supposed to be in the europe-west1 locality, and are thus in violation of a constraint.
In other words, this tells the ranges that "where you are now is not where you are supposed to be". This will cause the cluster to rebalance the ranges, which will take some time. During the time it takes for the rebalancing to occur, the ranges will be in violation of a constraint.
The critical nodes endpoint should now report a constraint violation in the violatingConstraints field of the response, similar to the one shown below.
Use the SHOW RANGES statement to find out more information about the ranges that are in violation of constraints.
In a real life constraint violation scenario, you will need to Troubleshoot your replication zones.
curl -X POST http://localhost:8080/_status/critical_nodes
{
  "criticalNodes": [
  ],
  "report": {
    "underReplicated": [
    ],
    "overReplicated": [
    ],
    "violatingConstraints": [
      {
        "rangeDescriptor": {
          "rangeId": "71",
          "startKey": "8okSYW1zdGVyZGFtAAESszMzMzMzQAD/gAD/AP8A/wD/AP8A/yMAAQ==",
          "endKey": "8okSYm9zdG9uAAESMzMzMzMzRAD/gAD/AP8A/wD/AP8A/woAAQ==",
          "internalReplicas": [
            {
              "nodeId": 8,
              "storeId": 8,
              "replicaId": 9,
              "type": 0
            },
            {
              "nodeId": 7,
              "storeId": 7,
              "replicaId": 8,
              "type": 0
            },
            {
              "nodeId": 1,
              "storeId": 1,
              "replicaId": 7,
              "type": 5
            },
            {
              "nodeId": 2,
              "storeId": 2,
              "replicaId": 5,
              "type": 0
            },
            {
              "nodeId": 6,
              "storeId": 6,
              "replicaId": 6,
              "type": 5
            }
          ],
          "nextReplicaId": 10,
          "generation": "32",
          "stickyBit": {
            "wallTime": "9223372036854775807",
            "logical": 2147483647,
            "synthetic": false
          }
        },
        "config": {
          "rangeMinBytes": "134217728",
          "rangeMaxBytes": "536870912",
          "gcPolicy": {
            "ttlSeconds": 14400,
            "protectionPolicies": [
            ],
            "ignoreStrictEnforcement": false
          },
          "globalReads": false,
          "numReplicas": 5,
          "numVoters": 3,
          "constraints": [
            {
              "numReplicas": 1,
              "constraints": [
                {
                  "type": 0,
                  "key": "region",
                  "value": "europe-west1"
                }
              ]
            },
            {
              "numReplicas": 1,
              "constraints": [
                {
                  "type": 0,
                  "key": "region",
                  "value": "us-east1"
                }
              ]
            },
            {
              "numReplicas": 1,
              "constraints": [
                {
                  "type": 0,
                  "key": "region",
                  "value": "us-west1"
                }
              ]
            }
          ],
          "voterConstraints": [
            {
              "numReplicas": 0,
              "constraints": [
                {
                  "type": 0,
                  "key": "region",
                  "value": "europe-west1"
                }
              ]
            }
          ],
          "leasePreferences": [
            {
              "constraints": [
                {
                  "type": 0,
                  "key": "region",
                  "value": "europe-west1"
                }
              ]
            }
          ],
          "rangefeedEnabled": false,
          "excludeDataFromBackup": false
        }
      },
      ...
    ],
    "unavailable": [
    ],
    "unavailableNodeIds": [
    ]
  }
}
Replication status - under-replicated ranges
The following example assumes you are running a newly started, local multi-region cockroach demo cluster started using the following command:
cockroach demo --global --nodes 9 --insecure
Execute the following statements to set the database regions for the movr database:
 ALTER DATABASE movr SET PRIMARY REGION "us-east1";
 ALTER DATABASE movr ADD REGION "us-west1";
 ALTER DATABASE movr ADD REGION "europe-west1";
By default, this multi-region demo cluster will not have any under-replicated ranges.
To put the cluster into a state where some ranges are under-replicated, issue the following ALTER DATABASE ... ALTER LOCALITY ... CONFIGURE ZONE statement, which tells it to store 9 copies of each range underlying the movr database.
ALTER DATABASE movr ALTER LOCALITY REGIONAL IN "us-east1" CONFIGURE ZONE USING num_replicas = 9;
Once the statement above executes, the cluster will rebalance so that it's storing 9 copies of each range underlying the movr database. During the time it takes for the rebalancing to occur, these ranges will be considered under-replicated, since there are not yet as many copies (9) of each range as you have just specified.
The critical nodes endpoint should now report ranges in the underReplicated field of the response, similar to the one shown below.
Use the SHOW RANGES statement to find out more information about the under-replicated ranges.
In a real life under-replication scenario, you may need to Troubleshoot your replication zones.
curl -X POST http://localhost:8080/_status/critical_nodes
{
  "criticalNodes": [
    {
      "nodeId": 3,
      "address": {
        "networkField": "tcp",
        "addressField": "127.0.0.1:26359"
      },
      "attrs": {
        "attrs": [
        ]
      },
      "locality": {
        "tiers": [
          {
            "key": "region",
            "value": "us-east1"
          },
          {
            "key": "az",
            "value": "d"
          }
        ]
      },
      "ServerVersion": {
        "majorVal": 23,
        "minorVal": 2,
        "patch": 0,
        "internal": 0
      },
      "buildTag": "v23.2.0-rc.2",
      "startedAt": "1705098699112441000",
      "localityAddress": [
      ],
      "clusterName": "",
      "sqlAddress": {
        "networkField": "tcp",
        "addressField": "127.0.0.1:26259"
      },
      "httpAddress": {
        "networkField": "tcp",
        "addressField": "127.0.0.1:8082"
      }
    },
    ...
  ],
  "report": {
    "underReplicated": [
      {
        "rangeDescriptor": {
          "rangeId": "74",
          "startKey": "84kSc2FuIGZyYW5jaXNjbwABEnd3d3d3d0gA/4AA/wD/AP8A/wD/AP8HAAE=",
          "endKey": "84kSc2FuIGZyYW5jaXNjbwABEoiIiIiIiEgA/4AA/wD/AP8A/wD/AP8IAAE=",
          "internalReplicas": [
            {
              "nodeId": 3,
              "storeId": 3,
              "replicaId": 1,
              "type": 0
            },
            {
              "nodeId": 1,
              "storeId": 1,
              "replicaId": 6,
              "type": 0
            },
            {
              "nodeId": 2,
              "storeId": 2,
              "replicaId": 7,
              "type": 0
            },
            {
              "nodeId": 4,
              "storeId": 4,
              "replicaId": 4,
              "type": 5
            },
            {
              "nodeId": 8,
              "storeId": 8,
              "replicaId": 5,
              "type": 5
            },
            {
              "nodeId": 5,
              "storeId": 5,
              "replicaId": 8,
              "type": 5
            },
            {
              "nodeId": 9,
              "storeId": 9,
              "replicaId": 9,
              "type": 5
            },
            {
              "nodeId": 6,
              "storeId": 6,
              "replicaId": 10,
              "type": 5
            }
          ],
          "nextReplicaId": 11,
          "generation": "43",
          "stickyBit": {
            "wallTime": "9223372036854775807",
            "logical": 2147483647,
            "synthetic": false
          }
        },
        "config": {
          "rangeMinBytes": "134217728",
          "rangeMaxBytes": "536870912",
          "gcPolicy": {
            "ttlSeconds": 14400,
            "protectionPolicies": [
            ],
            "ignoreStrictEnforcement": false
          },
          "globalReads": false,
          "numReplicas": 9,
          "numVoters": 3,
          "constraints": [
            {
              "numReplicas": 1,
              "constraints": [
                {
                  "type": 0,
                  "key": "region",
                  "value": "europe-west1"
                }
              ]
            },
            {
              "numReplicas": 1,
              "constraints": [
                {
                  "type": 0,
                  "key": "region",
                  "value": "us-east1"
                }
              ]
            },
            {
              "numReplicas": 1,
              "constraints": [
                {
                  "type": 0,
                  "key": "region",
                  "value": "us-west1"
                }
              ]
            }
          ],
          "voterConstraints": [
            {
              "numReplicas": 0,
              "constraints": [
                {
                  "type": 0,
                  "key": "region",
                  "value": "us-east1"
                }
              ]
            }
          ],
          "leasePreferences": [
            {
              "constraints": [
                {
                  "type": 0,
                  "key": "region",
                  "value": "us-east1"
                }
              ]
            }
          ],
          "rangefeedEnabled": false,
          "excludeDataFromBackup": false
        }
      },
      ...
    ],
    "overReplicated": [
    ],
    "violatingConstraints": [
    ],
    "unavailable": [
    ],
    "unavailableNodeIds": [
    ]
  }
}
Replication status - ranges in critical localities
The following example assumes you are running a newly started, local multi-region cockroach demo cluster started using the following command:
cockroach demo --global --nodes 9 --insecure
Execute the following statements to set the database regions for the movr database:
 ALTER DATABASE movr SET PRIMARY REGION "us-east1";
 ALTER DATABASE movr ADD REGION "us-west1";
 ALTER DATABASE movr ADD REGION "europe-west1";
By default, this multi-region demo cluster will not have any nodes in a critical state. A node is critical if that node becoming unreachable would cause replicas to become unavailable.
The status endpoint describes which of your nodes (if any) are critical via the criticalNodes field in the response.
To artificially put the nodes in this demo cluster in "critical" status, we can issue the following SQL statement, which uses ALTER DATABASE ... ALTER LOCALITY ... CONFIGURE ZONE to tell the cluster to store more copies of each range underlying the movr database than there are nodes in the cluster.
ALTER DATABASE movr ALTER LOCALITY REGIONAL IN "us-east1" CONFIGURE ZONE USING num_replicas = 128;
The critical nodes endpoint should now report that all of the cluster's nodes are critical by listing them in the criticalNodes field of the response.
Use the SHOW RANGES statement to find out more information about the ranges in critical localities.
In a real life critical localities scenario, you may need to Troubleshoot your replication zones.
curl -X POST http://localhost:8080/_status/critical_nodes
{
  "criticalNodes": [
    {
      "nodeId": 3,
      "address": {
        "networkField": "tcp",
        "addressField": "127.0.0.1:26359"
      },
      "attrs": {
        "attrs": [
        ]
      },
      "locality": {
        "tiers": [
          {
            "key": "region",
            "value": "us-east1"
          },
          {
            "key": "az",
            "value": "d"
          }
        ]
      },
      "ServerVersion": {
        "majorVal": 23,
        "minorVal": 2,
        "patch": 0,
        "internal": 0
      },
      "buildTag": "v23.2.0-rc.2",
      "startedAt": "1705098699112441000",
      "localityAddress": [
      ],
      "clusterName": "",
      "sqlAddress": {
        "networkField": "tcp",
        "addressField": "127.0.0.1:26259"
      },
      "httpAddress": {
        "networkField": "tcp",
        "addressField": "127.0.0.1:8082"
      }
    },
    ...
  ],
  "report": {
    "underReplicated": [
      {
        "rangeDescriptor": {
          "rangeId": "100",
          "startKey": "8w==",
          "endKey": "84kSYm9zdG9uAAESIiIiIiIiQgD/gAD/AP8A/wD/AP8A/wIAAQ==",
          "internalReplicas": [
            {
              "nodeId": 3,
              "storeId": 3,
              "replicaId": 1,
              "type": 0
            },
            {
              "nodeId": 5,
              "storeId": 5,
              "replicaId": 2,
              "type": 5
            },
            {
              "nodeId": 1,
              "storeId": 1,
              "replicaId": 3,
              "type": 0
            },
            {
              "nodeId": 2,
              "storeId": 2,
              "replicaId": 4,
              "type": 0
            },
            {
              "nodeId": 9,
              "storeId": 9,
              "replicaId": 5,
              "type": 5
            },
            {
              "nodeId": 4,
              "storeId": 4,
              "replicaId": 6,
              "type": 5
            },
            {
              "nodeId": 7,
              "storeId": 7,
              "replicaId": 7,
              "type": 5
            },
            {
              "nodeId": 6,
              "storeId": 6,
              "replicaId": 8,
              "type": 5
            },
            {
              "nodeId": 8,
              "storeId": 8,
              "replicaId": 9,
              "type": 5
            }
          ],
          "nextReplicaId": 10,
          "generation": "38",
          "stickyBit": {
            "wallTime": "0",
            "logical": 0,
            "synthetic": false
          }
        },
        "config": {
          "rangeMinBytes": "134217728",
          "rangeMaxBytes": "536870912",
          "gcPolicy": {
            "ttlSeconds": 14400,
            "protectionPolicies": [
            ],
            "ignoreStrictEnforcement": false
          },
          "globalReads": false,
          "numReplicas": 128,
          "numVoters": 3,
          "constraints": [
            {
              "numReplicas": 1,
              "constraints": [
                {
                  "type": 0,
                  "key": "region",
                  "value": "europe-west1"
                }
              ]
            },
            {
              "numReplicas": 1,
              "constraints": [
                {
                  "type": 0,
                  "key": "region",
                  "value": "us-east1"
                }
              ]
            },
            {
              "numReplicas": 1,
              "constraints": [
                {
                  "type": 0,
                  "key": "region",
                  "value": "us-west1"
                }
              ]
            }
          ],
          "voterConstraints": [
            {
              "numReplicas": 0,
              "constraints": [
                {
                  "type": 0,
                  "key": "region",
                  "value": "us-east1"
                }
              ]
            }
          ],
          "leasePreferences": [
            {
              "constraints": [
                {
                  "type": 0,
                  "key": "region",
                  "value": "us-east1"
                }
              ]
            }
          ],
          "rangefeedEnabled": false,
          "excludeDataFromBackup": false
        }
      },
      ...
    ],
    "overReplicated": [
    ],
    "violatingConstraints": [
    ],
    "unavailable": [
    ],
    "unavailableNodeIds": [
    ]
  }
}
Store status endpoint
The store status endpoint at /_status/stores provides information about the stores attached to each node of your cluster.
The response is a JSON object containing a stores array of objects. Each store object has the following fields:
| Field | Description |
|---|---|
storeId |
The store ID associated with this store. |
nodeId |
The node ID associated with this store. |
encryptionStatus |
The encryption status of this store. |
totalFiles |
If the store is encrypted, the total number of encrypted files on the store. |
totalBytes |
If the store is encrypted, the total number of encrypted bytes on the store. |
activeKeyFiles |
If the store is encrypted,, the number of files using the active data key. |
activeKeyBytes |
If the store is encrypted,, the number of bytes using the active data key. |
dir |
The directory on disk where the store is located. |
walFailoverPath |
If WAL failover is enabled, this field encodes the path to the secondary WAL directory used for failover in the event of high write latency to the primary WAL. |
For example, to get the status of the stores of nodeID 1, use the following:
curl http://localhost:8080/_status/stores/1
{
  "stores": [
    {
      "storeId": 1,
      "nodeId": 1,
      "encryptionStatus": null,
      "totalFiles": "0",
      "totalBytes": "0",
      "activeKeyFiles": "0",
      "activeKeyBytes": "0",
      "dir": "/tmp/node0",
      "walFailoverPath": ""
    }
  ]
}
Alerting tools
In addition to actively monitoring the overall health and performance of a cluster, it is also essential to configure alerting rules that promptly send notifications when CockroachDB experiences events that require investigation or intervention.
Many of the third-party monitoring integrations, such as Datadog and Kibana, also support event-based alerting using metrics collected from a cluster's Prometheus endpoint. Refer to the documentation for an integration for more details. This section identifies the most important events that you might want to create alerting rules for, and provides pre-defined rules definitions for these events appropriate for use with Prometheus's Alertmanager service.
Alertmanager
If you have configured Prometheus to monitor your CockroachDB instance, you can also configure alerting rule definitions to have Alertmanager detect important events and alert you when they occur.
Prometheus alerting rules endpoint
Every CockroachDB node exports an alerting rules template at http://<host>:<http-port>/api/v2/rules/. These rule definitions are formatted for easy integration with Alertmanager.
$ curl http://localhost:8080/api/v2/rules/
rules/alerts:
    rules:
        - alert: UnavailableRanges
          expr: (sum by(instance, cluster) (ranges_unavailable)) > 0
          for: 10m0s
          annotations:
            summary: Instance {{ $labels.instance }} has {{ $value }} unavailable ranges
        - alert: TrippedReplicaCircuitBreakers
          expr: (sum by(instance, cluster) (kv_replica_circuit_breaker_num_tripped_replicas)) > 0
          for: 10m0s
          annotations:
            summary: Instance {{ $labels.instance }} has {{ $value }} tripped per-Replica circuit breakers
...
Working with Alertmanager rules
To add a rule from the api/v2/rules/ rules endpoint, create or edit your alerts.rules.yml file and copy the rule definition for the event you want to alert on. For example, to add a rule to alert you when unavailable ranges are detected, copy the following from the rules endpoint into your alerts.rules.yml file:
- alert: UnavailableRanges
  expr: (sum by(instance, cluster) (ranges_unavailable)) > 0
  for: 10m0s
  annotations:
    summary: Instance {{ $labels.instance }} has {{ $value }} unavailable ranges
If you already followed the steps from Monitor CockroachDB with Prometheus, you should already have a alerts.rules.yml file. If you are creating a new alerts.rules.yml file, be sure that it begins with the following three lines:
groups:
- name: rules/alerts.rules
  rules:
Place your desired rule(s) underneath the rules: header. For example, the following shows an alerts.rules.yml file with the unavailable ranges rule defined:
groups:
- name: rules/alerts.rules
  rules:
  - alert: UnavailableRanges
    expr: (sum by(instance, cluster) (ranges_unavailable)) > 0
    for: 10m0s
    annotations:
      summary: Instance {{ $labels.instance }} has {{ $value }} unavailable ranges
Once you have created or edited your alerts.rules.yml file, reference it in your prometheus.yml configuration file with the following:
rule_files:
- "rules/alerts.rules.yml"
If you already followed the steps from Monitor CockroachDB with Prometheus, this reference is already present in your prometheus.yml file.
Start Prometheus and Alertmanager to begin watching for events to alert on. You can view imported rules on your Prometheus server's web interface at http://<host>:<http-port>/rules. Use the "State" column to verify that the rules were imported correctly.
Events to alert on
Currently, not all events listed have corresponding alert rule definitions available from the api/v2/rules/ endpoint. Many events not yet available in this manner are defined in the pre-defined alerting rules. For more details, see Monitor CockroachDB with Prometheus.
Node is down
Rule: Send an alert when a node has been down for 15 minutes or more.
How to detect: If a node is down, its Prometheus endpoint will return a
Connection refusederror. Otherwise, theliveness_livenodesmetric will be the total number of live nodes in the cluster.Rule definition: Use the
InstanceDeadalert from our pre-defined alerting rules.
Node is restarting too frequently
Rule: Send an alert if a node has restarted more than once in the last 10 minutes.
How to detect: Calculate this using the number of times the
sys_uptimemetric in the node's Prometheus endpoint output was reset back to zero. Thesys_uptimemetric gives you the length of time, in seconds, that thecockroachprocess has been running.Rule definition: Use the
InstanceFlappingalert from our pre-defined alerting rules.
Node is running low on disk space
Rule: Send an alert when a node has less than 15% of free space remaining.
How to detect: Divide the
capacitymetric by thecapacity_availablemetric in the node's Prometheus endpoint output.Rule definition: Use the
StoreDiskLowalert from our pre-defined alerting rules.
For instructions on how to free up disk space as quickly as possible after dropping a table, see How can I free up disk space that was used by a dropped table?
Node is not executing SQL
Rule: Send an alert when a node is not executing SQL despite having connections.
How to detect: The
sql_connsmetric in the node's Prometheus endpoint output will be greater than0while thesql_query_countmetric will be0. You can also break this down by statement type usingsql_select_count,sql_insert_count,sql_update_count, andsql_delete_count.
CA certificate expires soon
Rule: Send an alert when the CA certificate on a node will expire in less than a year.
How to detect: Calculate this using the
security_certificate_expiration_cametric in the node's Prometheus endpoint output.Rule definition: Use the
CACertificateExpiresSoonalert from our pre-defined alerting rules.
Node certificate expires soon
Rule: Send an alert when a node's certificate will expire in less than a year.
How to detect: Calculate this using the
security_certificate_expiration_nodemetric in the node's Prometheus endpoint output.Rule definition: Use the
NodeCertificateExpiresSoonalert from our pre-defined alerting rules.
Changefeed is experiencing high latency
Rule: Send an alert when the latency of any changefeed running on any node is higher than the set threshold, which depends on the
gc.ttlsecondsvariable set in the cluster.How to detect: Calculate this using a threshold, where the threshold is less than the value of the
gc.ttlsecondsvariable. For example,changefeed.max_behind_nanos > [some threshold].
Unavailable ranges
Rule: Send an alert when the number of ranges with fewer live replicas than needed for quorum is non-zero for too long.
How to detect: Calculate this using the
ranges_unavailablemetric in the node's Prometheus endpoint output.Rule definition: Use the
UnavailableRangesalerting rule from your cluster'sapi/v2/rules/metrics endpoint.
Tripped replica circuit breakers
Rule: Send an alert when a replica stops serving traffic due to other replicas being offline for too long.
How to detect: Calculate this using the
kv_replica_circuit_breaker_num_tripped_replicasmetric in the node's Prometheus endpoint output.Rule definition: Use the
TrippedReplicaCircuitBreakersalerting rule from your cluster'sapi/v2/rules/metrics endpoint.
Under-replicated ranges
Rule: Send an alert when the number of ranges with replication below the replication factor is non-zero for too long.
How to detect: Calculate this using the
ranges_underreplicatedmetric in the node's Prometheus endpoint output.Rule definition: Use the
UnderreplicatedRangesalerting rule from your cluster'sapi/v2/rules/metrics endpoint.
Requests stuck in Raft
Rule: Send an alert when requests are taking a very long time in replication. This can be a symptom of a leader-leaseholder split.
How to detect: Calculate this using the
requests_slow_raftmetric in the node's Prometheus endpoint output.Rule definition: Use the
RequestsStuckInRaftalerting rule from your cluster'sapi/v2/rules/metrics endpoint.
High open file descriptor count
Rule: Send an alert when a cluster is getting close to the open file descriptor limit.
How to detect: Calculate this using the
sys_fd_softlimitmetric in the node's Prometheus endpoint output.Rule definition: Use the
HighOpenFDCountalerting rule from your cluster'sapi/v2/rules/metrics endpoint.
