
In addition to CockroachDB's built-in safeguards against failure, it is critical to actively monitor the overall health and performance of a cluster running in production and to create alerting rules that promptly send notifications when there are events that require investigation or intervention.
This page explains available monitoring tools and critical events and metrics to alert on.
If the cluster becomes unavailable, the DB Console and Cluster API will also become unavailable. You can continue to monitor the cluster via the Prometheus endpoint and logs.
Monitoring tools
If a cluster becomes unavailable, most of the monitoring tools in the following sections become unavailable. In that case, Cockroach Labs recommends that you use the Prometheus endpoint or consult the cluster logs.
DB Console
The DB Console displays essential metrics about a cluster's health, such as node status, number of unavailable ranges, and queries per second and service latency across the cluster. This tool is designed to help you optimize cluster performance and troubleshoot issues. The DB Console is accessible from every node at http://<host>:<http-port>, or http://<host>:8080 by default.
For more information on accessing the DB Console, see Access DB Console.
Cluster API
The Cluster API is a REST API that provides much of the same information about your cluster and nodes as is available from the DB Console and is accessible from each node at the same address and port as the DB Console.
For more information, see the Cluster API overview and reference.
crdb_internal system catalog
The crdb_internal system catalog is a schema that contains information about internal objects, processes, and metrics related to a specific database.
For details, see crdb_internal.
Health endpoints
CockroachDB provides two HTTP endpoints for checking the health of individual nodes.
These endpoints are also available through the Cluster API under /v2/health/.
/health
If a node is down, the http://<host>:<http-port>/health endpoint returns a Connection refused error:
$ curl http://localhost:8080/health
curl: (7) Failed to connect to localhost port 8080: Connection refused
Otherwise, it returns an HTTP 200 OK status response code with an empty body:
{

}
The /health endpoint does not returns details about the node such as its private IP address. These details could be considered privileged information in some deployments. If you need to retrieve node details, you can use the /_status/details endpoint along with a valid authentication cookie.
/health?ready=1
The http://<node-host>:<http-port>/health?ready=1 endpoint returns an HTTP 503 Service Unavailable status response code with an error in the following scenarios:
The node is in the wait phase of the node shutdown sequence. This causes load balancers and connection managers to reroute traffic to other nodes before the node is drained of SQL client connections and leases, and is a necessary check during rolling upgrades.
Tip:If you find that your load balancer's health check is not always recognizing a node as unready before the node shuts down, you can increase the
server.shutdown.drain_waitcluster setting to cause a node to return503 Service Unavailableeven before it has started shutting down.The node is unable to communicate with a majority of the other nodes in the cluster, likely because the cluster is unavailable due to too many nodes being down.
$ curl http://localhost:8080/health?ready=1
{
  "error": "node is not healthy",
  "code": 14,
  "message": "node is not healthy",
  "details": [
  ]
}
Otherwise, it returns an HTTP 200 OK status response code with an empty body:
{

}
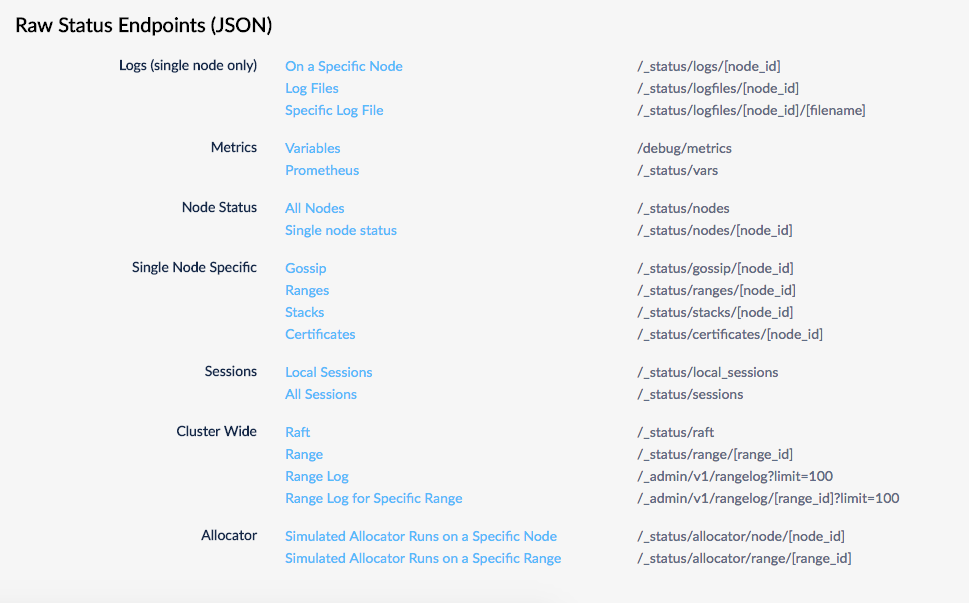
Raw status endpoints
These endpoints are deprecated in favor of the Cluster API.
Several endpoints return raw status metrics in JSON at http://<host>:<http-port>/#/debug. Feel free to investigate and use these endpoints, but note that they are subject to change.
Node status command
The cockroach node status command gives you metrics about the health and status of each node.
- With the
--rangesflag, you get granular range and replica details, including unavailability and under-replication. - With the
--statsflag, you get granular disk usage details. - With the
--decommissionflag, you get details about the node decommissioning process. - With the
--allflag, you get all of the above.
Prometheus endpoint
Every node of a CockroachDB cluster exports granular time series metrics at http://<host>:<http-port>/_status/vars. The metrics are formatted for easy integration with Prometheus, an open source tool for storing, aggregating, and querying time series data, but the format is easy-to-parse and can be processed to work with other third-party monitoring systems (e.g., Sysdig and Stackdriver).
$ curl http://localhost:8080/_status/vars
# HELP gossip_infos_received Number of received gossip Info objects
# TYPE gossip_infos_received counter
gossip_infos_received 0
# HELP sys_cgocalls Total number of cgo calls
# TYPE sys_cgocalls gauge
sys_cgocalls 3501
# HELP sys_cpu_sys_percent Current system cpu percentage
# TYPE sys_cpu_sys_percent gauge
sys_cpu_sys_percent 1.098855319644276e-10
# HELP replicas_quiescent Number of quiesced replicas
# TYPE replicas_quiescent gauge
replicas_quiescent{store="1"} 20
...
In addition to using the exported time-series data to monitor a cluster via an external system, you can write alerting rules against them to make sure you are promptly notified of critical events or issues that may require intervention or investigation. See Events to alert on for more details.
Alerting tools
In addition to actively monitoring the overall health and performance of a cluster, it is also essential to configure alerting rules that promptly send notifications when CockroachDB experiences events that require investigation or intervention.
This section identifies the most important events that you might want to create alerting rules for, and provides pre-defined rules definitions for these events appropriate for use with Prometheus's Alertmanager.
Alertmanager
If you have configured Prometheus to monitor your CockroachDB instance, you can also configure alerting rule definitions to have Prometheus's Alertmanager detect important events and alert you when they occur.
Prometheus alerting rules endpoint
Every CockroachDB node exports an alerting rules template at http://<host>:<http-port>/api/v2/rules/. These rule definitions are formatted for easy integration with Prometheus's Alertmanager.
$ curl http://localhost:8080/api/v2/rules/
rules/alerts:
    rules:
        - alert: UnavailableRanges
          expr: (sum by(instance, cluster) (ranges_unavailable)) > 0
          for: 10m0s
          annotations:
            summary: Instance {{ $labels.instance }} has {{ $value }} unavailable ranges
        - alert: TrippedReplicaCircuitBreakers
          expr: (sum by(instance, cluster) (kv_replica_circuit_breaker_num_tripped_replicas)) > 0
          for: 10m0s
          annotations:
            summary: Instance {{ $labels.instance }} has {{ $value }} tripped per-Replica circuit breakers
...
Working with Alertmanager rules
To add a rule from the api/v2/rules/ rules endpoint, create or edit your alerts.rules.yml file and copy the rule definition for the event you want to alert on. For example, to add a rule to alert you when unavailable ranges are detected, copy the following from the rules endpoint into your alerts.rules.yml file:
- alert: UnavailableRanges
  expr: (sum by(instance, cluster) (ranges_unavailable)) > 0
  for: 10m0s
  annotations:
    summary: Instance {{ $labels.instance }} has {{ $value }} unavailable ranges
If you already followed the steps from Monitor CockroachDB with Prometheus, you should already have a alerts.rules.yml file. If you are creating a new alerts.rules.yml file, be sure that it begins with the following three lines:
groups:
- name: rules/alerts.rules
  rules:
Place your desired rule(s) underneath the rules: header. For example, the following shows an alerts.rules.yml file with the unavailable ranges rule defined:
groups:
- name: rules/alerts.rules
  rules:
  - alert: UnavailableRanges
    expr: (sum by(instance, cluster) (ranges_unavailable)) > 0
    for: 10m0s
    annotations:
      summary: Instance {{ $labels.instance }} has {{ $value }} unavailable ranges
Once you have created or edited your alerts.rules.yml file, reference it in your prometheus.yml configuration file with the following:
rule_files:
- "rules/alerts.rules.yml"
If you already followed the steps from Monitor CockroachDB with Prometheus, this reference is already present in your prometheus.yml file.
Start Prometheus and Alertmanager to begin watching for events to alert on. You can view imported rules on your Prometheus server's web interface at http://<host>:<http-port>/rules. Use the "State" column to verify that the rules were imported correctly.
Events to alert on
Currently, not all events listed have corresponding alert rule definitions available from the api/v2/rules/ endpoint. Many events not yet available in this manner are defined in the pre-defined alerting rules. For more details, see Monitor CockroachDB with Prometheus.
Node is down
Rule: Send an alert when a node has been down for 15 minutes or more.
How to detect: If a node is down, its
_status/varsendpoint will return aConnection refusederror. Otherwise, theliveness_livenodesmetric will be the total number of live nodes in the cluster.Rule definition: Use the
InstanceDeadalert from our pre-defined alerting rules.
Node is restarting too frequently
Rule: Send an alert if a node has restarted more than once in the last 10 minutes.
How to detect: Calculate this using the number of times the
sys_uptimemetric in the node's_status/varsoutput was reset back to zero. Thesys_uptimemetric gives you the length of time, in seconds, that thecockroachprocess has been running.Rule definition: Use the
InstanceFlappingalert from our pre-defined alerting rules.
Node is running low on disk space
Rule: Send an alert when a node has less than 15% of free space remaining.
How to detect: Divide the
capacitymetric by thecapacity_availablemetric in the node's_status/varsoutput.Rule definition: Use the
StoreDiskLowalert from our pre-defined alerting rules.
Node is not executing SQL
Rule: Send an alert when a node is not executing SQL despite having connections.
How to detect: The
sql_connsmetric in the node's_status/varsoutput will be greater than0while thesql_query_countmetric will be0. You can also break this down by statement type usingsql_select_count,sql_insert_count,sql_update_count, andsql_delete_count.
CA certificate expires soon
Rule: Send an alert when the CA certificate on a node will expire in less than a year.
How to detect: Calculate this using the
security_certificate_expiration_cametric in the node's_status/varsoutput.Rule definition: Use the
CACertificateExpiresSoonalert from our pre-defined alerting rules.
Node certificate expires soon
Rule: Send an alert when a node's certificate will expire in less than a year.
How to detect: Calculate this using the
security_certificate_expiration_nodemetric in the node's_status/varsoutput.Rule definition: Use the
NodeCertificateExpiresSoonalert from our pre-defined alerting rules.
Changefeed is experiencing high latency
Rule: Send an alert when the latency of any changefeed running on any node is higher than the set threshold, which depends on the
gc.ttlsecondsvariable set in the cluster.How to detect: Calculate this using a threshold, where the threshold is less than the value of the
gc.ttlsecondsvariable. For example,changefeed.max_behind_nanos > [some threshold].
Unavailable ranges
Rule: Send an alert when the number of ranges with fewer live replicas than needed for quorum is non-zero for too long.
How to detect: Calculate this using the
ranges_unavailablemetric in the node's_status/varsoutput.Rule definition: Use the
UnavailableRangesalerting rule from your cluster'sapi/v2/rules/metrics endpoint.
Tripped replica circuit breakers
Rule: Send an alert when a replica stops serving traffic due to other replicas being offline for too long.
How to detect: Calculate this using the
kv_replica_circuit_breaker_num_tripped_replicasmetric in the node's_status/varsoutput.Rule definition: Use the
TrippedReplicaCircuitBreakersalerting rule from your cluster'sapi/v2/rules/metrics endpoint.
Under-replicated ranges
Rule: Send an alert when the number of ranges with replication below the replication factor is non-zero for too long.
How to detect: Calculate this using the
ranges_underreplicatedmetric in the node's_status/varsoutput.Rule definition: Use the
UnderreplicatedRangesalerting rule from your cluster'sapi/v2/rules/metrics endpoint.
Requests stuck in Raft
Rule: Send an alert when requests are taking a very long time in replication.
How to detect: Calculate this using the
requests_slow_raftmetric in the node's_status/varsoutput.Rule definition: Use the
RequestsStuckInRaftalerting rule from your cluster'sapi/v2/rules/metrics endpoint.
High open file descriptor count
Rule: Send an alert when a cluster is getting close to the open file descriptor limit.
How to detect: Calculate this using the
sys_fd_softlimitmetric in the node's_status/varsoutput.Rule definition: Use the
HighOpenFDCountalerting rule from your cluster'sapi/v2/rules/metrics endpoint.
