
Despite CockroachDB's various built-in safeguards against failure, it is critical to actively monitor the overall health and performance of a cluster running in production and to create alerting rules that promptly send notifications when there are events that require investigation or intervention.
This page explains available monitoring tools and critical events and metrics to alert on.
Monitoring tools
Admin UI
The Admin UI displays essential metrics about a cluster's health, such as node status, number of unavailable ranges, and queries per second and service latency across the cluster. This tool is designed to help you optimize cluster performance and troubleshoot issues.
The Admin UI is accessible from every node at http://<host>:<http-port>, or http://<host>:8080 by default. For more information on accessing the Admin UI, see Admin UI access.
Because the Admin UI is built into CockroachDB, if a cluster becomes unavailable, most of the Admin UI becomes unavailable as well. Therefore, it's essential to plan additional methods of monitoring cluster health as described below.
Prometheus endpoint
Every node of a CockroachDB cluster exports granular timeseries metrics at http://<host>:<http-port>/_status/vars. The metrics are formatted for easy integration with Prometheus, an open source tool for storing, aggregating, and querying timeseries data, but the format is easy-to-parse and can be massaged to work with other third-party monitoring systems (e.g., Sysdig and Stackdriver).
For a tutorial on using Prometheus, see Monitor CockroachDB with Prometheus.
$ curl http://localhost:8080/_status/vars
# HELP gossip_infos_received Number of received gossip Info objects
# TYPE gossip_infos_received counter
gossip_infos_received 0
# HELP sys_cgocalls Total number of cgo calls
# TYPE sys_cgocalls gauge
sys_cgocalls 3501
# HELP sys_cpu_sys_percent Current system cpu percentage
# TYPE sys_cpu_sys_percent gauge
sys_cpu_sys_percent 1.098855319644276e-10
# HELP replicas_quiescent Number of quiesced replicas
# TYPE replicas_quiescent gauge
replicas_quiescent{store="1"} 20
...
Health endpoints
CockroachDB provides two HTTP endpoints for checking the health of individual nodes.
/health
If a node is down, the http://<host>:<http-port>/health endpoint returns a Connection refused error:
$ curl http://localhost:8080/health
curl: (7) Failed to connect to localhost port 8080: Connection refused
Otherwise, it returns an HTTP 200 OK status response code with an empty body:
{

}
Changed in v20.1: The /health endpoint no longer returns details about the node such as its private IP address. These details could be considered privileged information in some deployments. If you need to retrieve node details, you can use the /_status/details endpoint along with a valid authentication cookie.
/health?ready=1
The http://<node-host>:<http-port>/health?ready=1 endpoint returns an HTTP 503 Service Unavailable status response code with an error in the following scenarios:
The node is draining open SQL connections and rejecting new SQL connections because it is in the process of shutting down (e.g., after being decommissioned). This is especially useful for making sure load balancers do not direct traffic to nodes that are live but not "ready", which is a necessary check during rolling upgrades.
Tip:If you find that your load balancer's health check is not always recognizing a node as unready before the node shuts down, you can increase the
server.shutdown.drain_waitcluster setting to cause a node to return503 Service Unavailableeven before it has started shutting down.Changed in v20.1: In previous releases, decommissioning nodes would erroneously be considered unready and return
503 Service Unavailable. This is no longer the case. Although decommissioned nodes no longer store replicas, they can still function as gateways to route SQL connections to relevant data until they are shut down.The node is unable to communicate with a majority of the other nodes in the cluster, likely because the cluster is unavailable due to too many nodes being down.
$ curl http://localhost:8080/health?ready=1
{
  "error": "node is not ready",
  "code": 14
}
Otherwise, it returns an HTTP 200 OK status response code with an empty body:
{

}
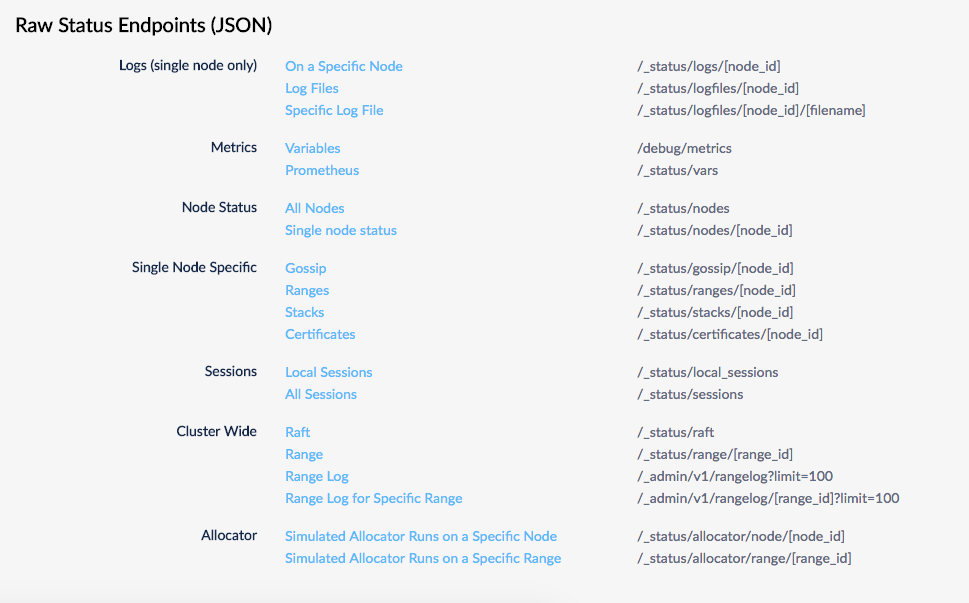
Raw status endpoints
Several endpoints return raw status metrics in JSON at http://<host>:<http-port>/#/debug. Feel free to investigate and use these endpoints, but note that they are subject to change.
Node status command
The cockroach node status command gives you metrics about the health and status of each node.
- With the
--rangesflag, you get granular range and replica details, including unavailability and under-replication. - With the
--statsflag, you get granular disk usage details. - With the
--decommissionflag, you get details about the node decommissioning process. - With the
--allflag, you get all of the above.
Events to alert on
Active monitoring helps you spot problems early, but it is also essential to create alerting rules that promptly send notifications when there are events that require investigation or intervention. This section identifies the most important events to create alerting rules for, with the Prometheus Endpoint metrics to use for detecting the events.
Node is down
Rule: Send an alert when a node has been down for 5 minutes or more.
How to detect: If a node is down, its
_status/varsendpoint will return aConnection refusederror. Otherwise, theliveness_livenodesmetric will be the total number of live nodes in the cluster.
Node is restarting too frequently
Rule: Send an alert if a node has restarted more than 5 times in 10 minutes.
How to detect: Calculate this using the number of times the
sys_uptimemetric in the node's_status/varsoutput was reset back to zero. Thesys_uptimemetric gives you the length of time, in seconds, that thecockroachprocess has been running.
Node is running low on disk space
Rule: Send an alert when a node has less than 15% of free space remaining.
How to detect: Divide the
capacitymetric by thecapacity_availablemetric in the node's_status/varsoutput.
Node is not executing SQL
Rule: Send an alert when a node is not executing SQL despite having connections.
How to detect: The
sql_connsmetric in the node's_status/varsoutput will be greater than0while thesql_query_countmetric will be0. You can also break this down by statement type usingsql_select_count,sql_insert_count,sql_update_count, andsql_delete_count.
CA certificate expires soon
Rule: Send an alert when the CA certificate on a node will expire in less than a year.
How to detect: Calculate this using the
security_certificate_expiration_cametric in the node's_status/varsoutput.
Node certificate expires soon
Rule: Send an alert when a node's certificate will expire in less than a year.
How to detect: Calculate this using the
security_certificate_expiration_nodemetric in the node's_status/varsoutput.
Changefeed is experiencing high latency
Rule: Send an alert when the latency of any changefeed running on any node is higher than the set threshold, which depends on the
gc.ttlsecondsvariable set in the cluster.How to detect: Calculate this using a threshold, where the threshold is less than the value of the
gc.ttlsecondsvariable. For example,changefeed.max_behind_nanos > [some threshold].
