
On a secure cluster you must be an admin user to access this area of the DB Console. See DB Console security.
The Statements page of the DB Console helps you:
- Identify frequently executed or high latency SQL statements.
- View SQL statement fingerprint details.
- Download SQL statement diagnostics for troubleshooting.
To view this page, click SQL Activity in the left-hand navigation of the DB Console. The Statements tab is selected.
If you haven't yet executed any queries in the cluster as a user, this page will be blank.
Search and filter
By default, the Statements page shows SQL statements from all applications and databases running on the cluster.
Search statements
To search using the search field:
- Type a string over
Search Statements. New in v22.1.4: To search for exact terms in order, wrap the search string in quotes. Press
Enter.The list of statements is filtered by the string.
Time interval
To view statement fingerprints within a specific time interval, click the time interval selector and pick an interval. The time interval field supports preset time intervals (1 Hour, 6 Hours, 1 Day, etc.) and custom time intervals. To select a custom time interval, click the time interval field and select Custom time interval. In the Start (UTC) and End (UTC) fields select or type a date and time.
Use the arrow keys to cycle through previous and next time intervals. When you select a time interval, the same interval is selected in the Metrics page.
It's possible to select an interval for which no statement statistics exist. CockroachDB persists statement statistics up to 1 million rows before the oldest row is deleted. The retention period of statistics is reduced the more active a workload is and the more distinct statement fingerprints there are.
Filter
To filter the statements:
Click the Filters field.
To filter by application, select App and select one or more applications.
- Queries from the SQL shell are displayed under the
$ cockroachapp. - If you haven't set
application_namein a client connection string, it appears asunset.
- Queries from the SQL shell are displayed under the
To filter by one or more databases (Database), SQL statement types (Statement Type), or nodes on which the statement ran (Node), click the field and select one or more checkboxes.
The Statement Type values map to the CockroachDB statement types data definition language (DDL), data manipulation language (DML), data control language (DCL), and transaction control language (TCL).
To display only statement fingerprints that take longer than a specified time to run, specify the time and units.
To display only statement fingerprints with queries that cause full table scans, click Only show statements that contain queries with full table scans.
Click Apply.
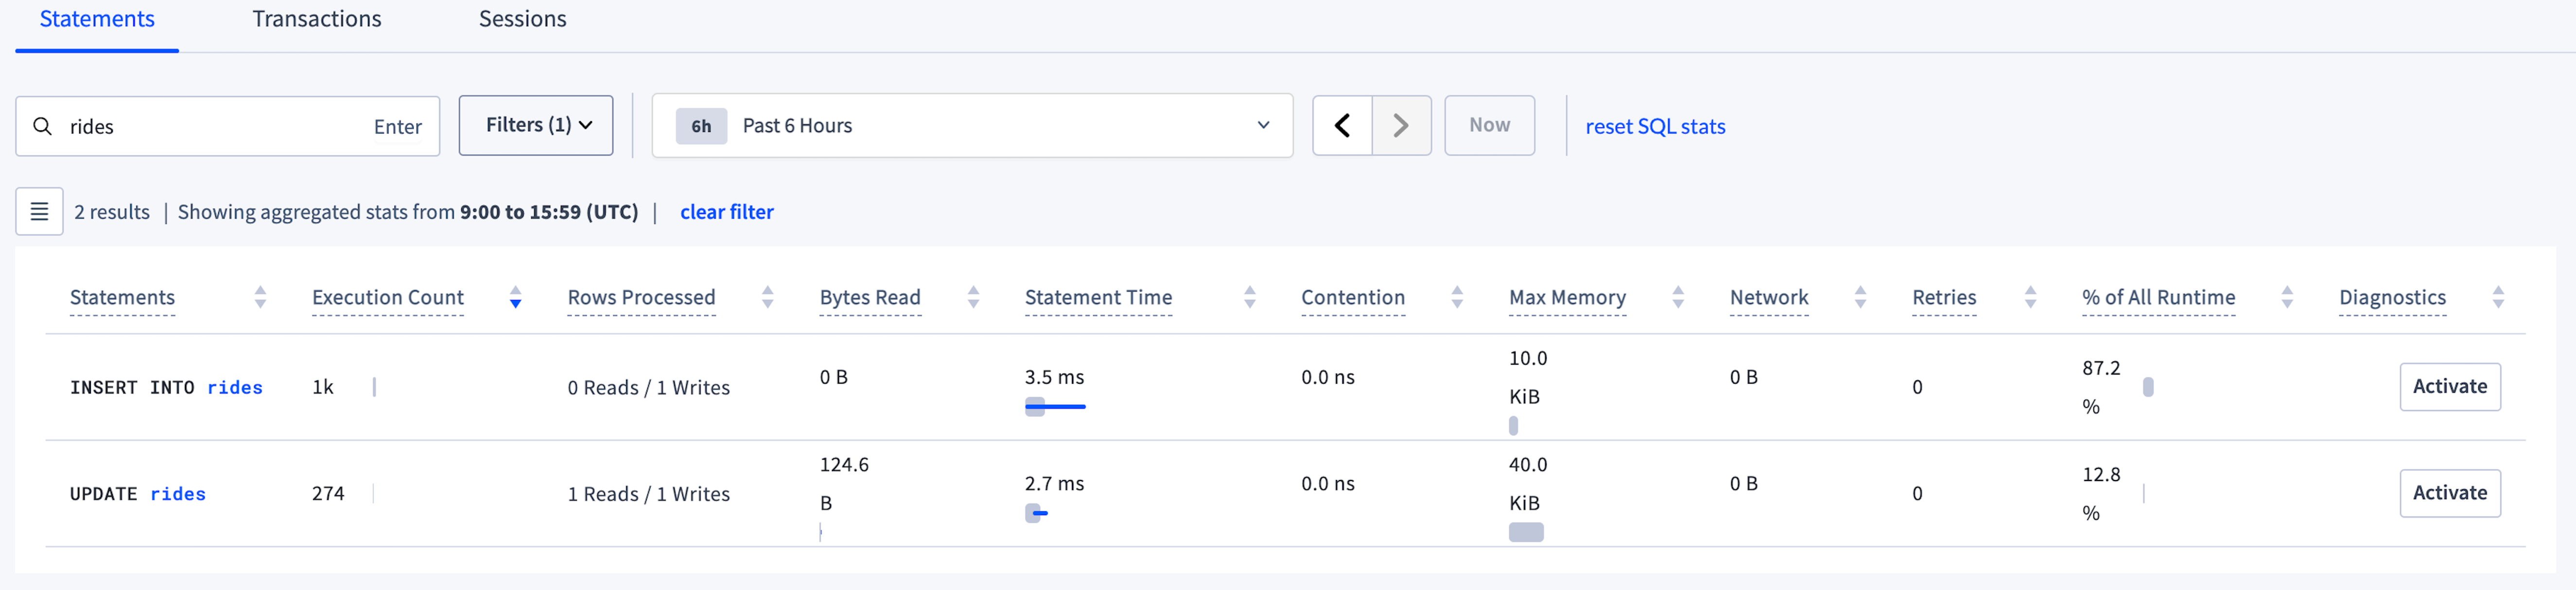
The following screenshot shows the statements that contain the string rides for the movr application:
Statement statistics
Statistics aggregation is controlled by the sql.stats.aggregation.interval cluster setting, set to 1 hour by default.
Aggregated statistics are flushed from memory to statistics tables in the crdb_internal system catalog every 10 minutes. The flushing interval is controlled by the sql.stats.flush.interval cluster setting.
The default retention period of the statistics tables is based on the number of rows up to 1 million records. When this threshold is reached, the oldest records are deleted. The diagnostics.forced_sql_stat_reset.interval cluster setting controls when persisted statistics are deleted only if the internal cleanup service experiences a failure.
If desired, admin users may reset SQL statistics in the DB Console UI and crdb_internal system catalog by clicking reset SQL stats. This link does not appear for non-admin users.
Example
See View historical statement statistics and the sampled logical plan per fingerprint.
SQL statement fingerprints
The Statements page displays SQL statement fingerprints.
A statement fingerprint represents one or more SQL statements by replacing literal values (e.g., numbers and strings) with underscores (_). This can help you quickly identify frequently executed SQL statements and their latencies.
For multiple SQL statements to be represented by a fingerprint, they must be identical aside from their literal values and placeholders.
These SQL statements:
INSERT INTO new_order(product_id, customer_id, transaction_id) VALUES (380, 11, 11098)INSERT INTO new_order(product_id, customer_id, transaction_id) VALUES (192, 891, 20)INSERT INTO new_order(product_id, customer_id, transaction_id) VALUES (784, 452, 78)
have the fingerprint INSERT INTO new_order(product_id, customer_id, transaction_id) VALUES (_, _, _)
These SQL statements:
INSERT INTO new_order(product_id, customer_id, transaction_id) VALUES ($1, $2, 11098)INSERT INTO new_order(product_id, customer_id, transaction_id) VALUES ($3, $4, 300)
have the fingerprint INSERT INTO new_order(product_id, customer_id, transaction_id) VALUES ($1, $1, _).
The following statements are not represented by either fingerprint:
INSERT INTO new_order(product_id, customer_id, transaction_id) VALUES ($1, 11, 11098)INSERT INTO new_order(product_id, customer_id, transaction_id) VALUES ($1, $2, $3)
It is possible to see the same fingerprint listed multiple times in the following scenarios:
- Statements with this fingerprint were executed by more than one
application_name. - Statements with this fingerprint were executed both successfully and unsuccessfully.
Statements table
Click  to select the columns to display in the table.
The Statements table gives details for each SQL statement fingerprint:
| Column | Description |
|---|---|
| Statements | SQL statement fingerprint. To view additional details, click the SQL statement fingerprint to open its Statement Fingerprint page. |
| Execution Count | Cumulative number of executions of statements with this fingerprint within the time interval. The bar indicates the ratio of runtime success (gray) to retries (red) for the SQL statement fingerprint. |
| Database | The database in which the statement was executed. |
| Rows Processed | New in v22.1.3: Average number of rows read and written while executing statements with this fingerprint within the time interval. |
| Bytes Read | Aggregation of all bytes read from disk across all operators for statements with this fingerprint within the time interval. The gray bar indicates the mean number of bytes read from disk. The blue bar indicates one standard deviation from the mean. Hover over the bar to display exact values. |
| Statement Time | Average planning and execution time of statements with this statement fingerprint within the time interval. The gray bar indicates the mean latency. The blue bar indicates one standard deviation from the mean. Hover over the bar to display exact values. |
| Contention | Average time statements with this fingerprint were in contention with other transactions within the time interval. The gray bar indicates mean contention time. The blue bar indicates one standard deviation from the mean. Hover over the bar to display exact values. |
| Max Memory | Maximum memory used by a statement with this fingerprint at any time during its execution within the time interval. The gray bar indicates the average max memory usage. The blue bar indicates one standard deviation from the mean. Hover over the bar to display exact values. |
| Network | Amount of data transferred over the network for statements with this fingerprint within the time interval. If this value is 0, the statement was executed on a single node. The gray bar indicates the mean number of bytes sent over the network. The blue bar indicates one standard deviation from the mean. Hover over the bar to display exact values. |
| Retries | Cumulative number of automatic (internal) retries by CockroachDB of statements with this fingerprint within the time interval. |
| % of All Runtime | How much time this statement fingerprint took to execute compared to all other statements that were executed within the time period. It is expressed as a percentage. The runtime is the mean execution latency multiplied by the execution count. |
| Regions/Nodes | The regions and nodes on which statements with this fingerprint executed. Regions/Nodes is not visible for CockroachDB Serverless clusters. |
| Diagnostics | Activate and download diagnostics for this fingerprint. To activate, click the Activate button. New in v22.1: The Activate statement diagnostics dialog displays. After you complete the dialog, the column displays the status of diagnostics collection (WAITING, READY, or ERROR). Click  and select a bundle to download or select Cancel request to cancel diagnostics bundle collection. and select a bundle to download or select Cancel request to cancel diagnostics bundle collection. Statements are periodically cleared from the Statements page based on the start time. To access the full history of diagnostics for the fingerprint, see the Diagnostics tab of the Statement Details page. Diagnostics is not visible for CockroachDB Serverless clusters. |
To obtain the execution statistics, CockroachDB samples a percentage of the executions. If you see no samples displayed in the Contention, Max Memory, or Network columns, there are two possibilities:
- Your statement executed successfully but wasn't sampled because there were too few executions of the statement.
- Your statement has failed (the most likely case). You can confirm by clicking the statement and viewing the value for Failed?.
To view statement details, click a SQL statement fingerprint in the Statements column to open the Statement Fingerprint page.
Statement Fingerprint page
The details displayed on the Statement Fingerprint page reflect the time interval selected on the Statements page.
Overview
The Overview section displays the SQL statement fingerprint and execution attributes:
- Nodes: the nodes on which the statements executed. Click a node ID to view node statistics. Nodes are not displayed for CockroachDB Serverless clusters.
- Regions: the regions on which the statements executed. Regions are not displayed for CockroachDB Serverless clusters.
- Database: the database on which the statements executed.
- App: the name specified by the
application_namesession setting. Click the name to view all statements run by that application. - Failed?: whether the statement failed to execute.
- Full scan?: whether the execution performed a full scan of the table.
- Vectorized execution?: whether the execution used the vectorized execution engine.
- Transaction type: the type of transaction (implicit or explicit).
- Last execution time: when the statement was last executed.
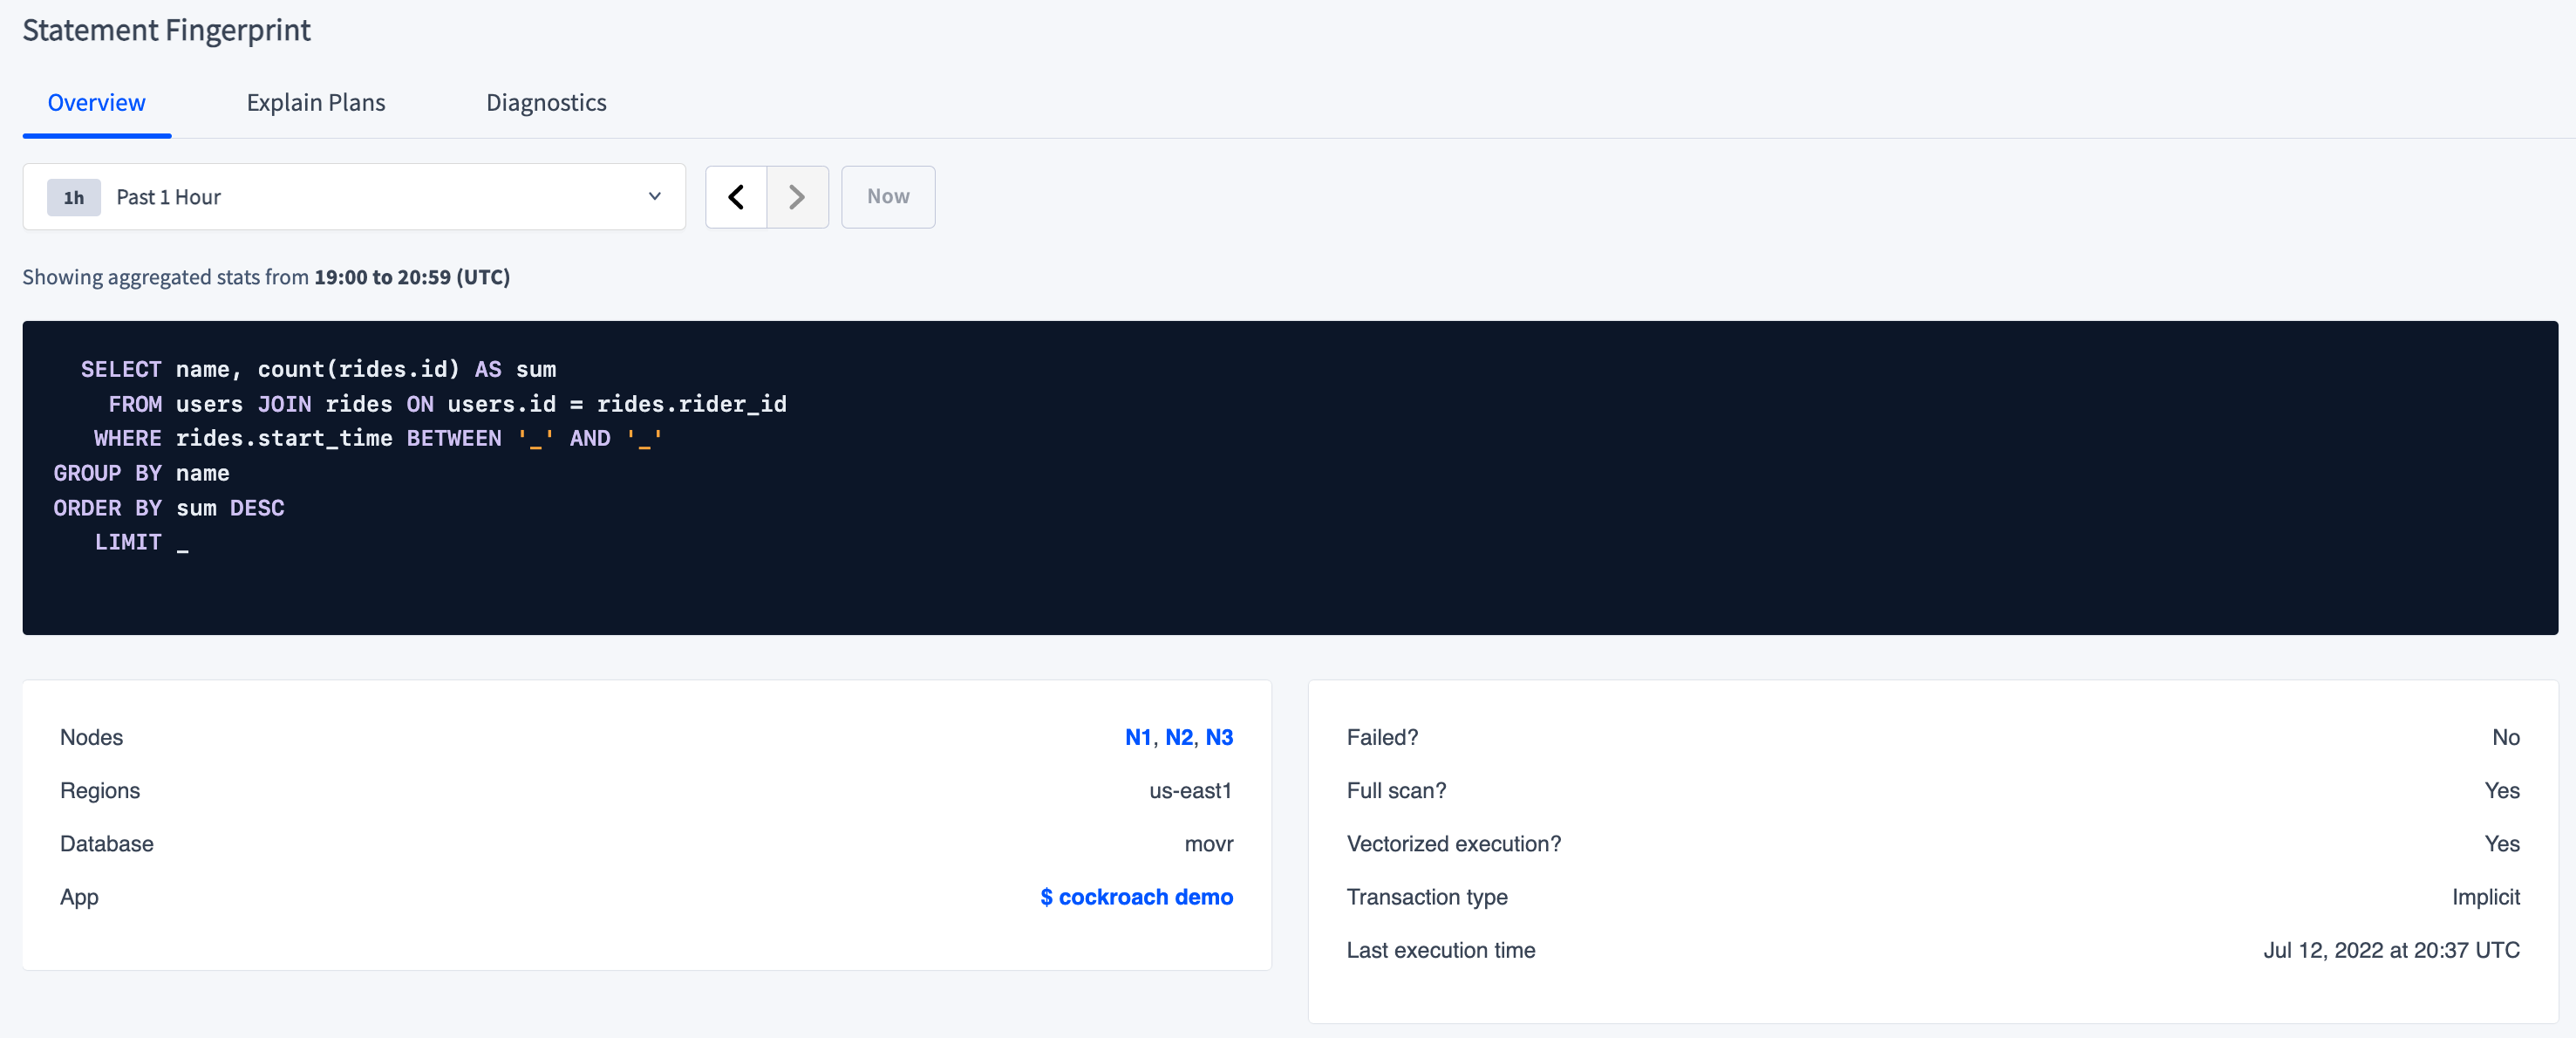
The following screenshot shows the statement fingerprint of the query described in Use the right index:
Charts
New in v22.1.3: Charts following the execution attributes display statement fingerprint statistics:
- Statement Execution and Planning Time: the time taken by the planner to create an execution plan and for CockroachDB to execute statements.
- Rows Processed: the total number of rows read and written.
- Execution Retries: the number of retries.
- Execution Count: the total number of executions. It is calculated as the sum of first attempts and retries.
- Contention: the amount of time spent waiting for resources. For more information about contention, see Understanding and avoiding transaction contention.
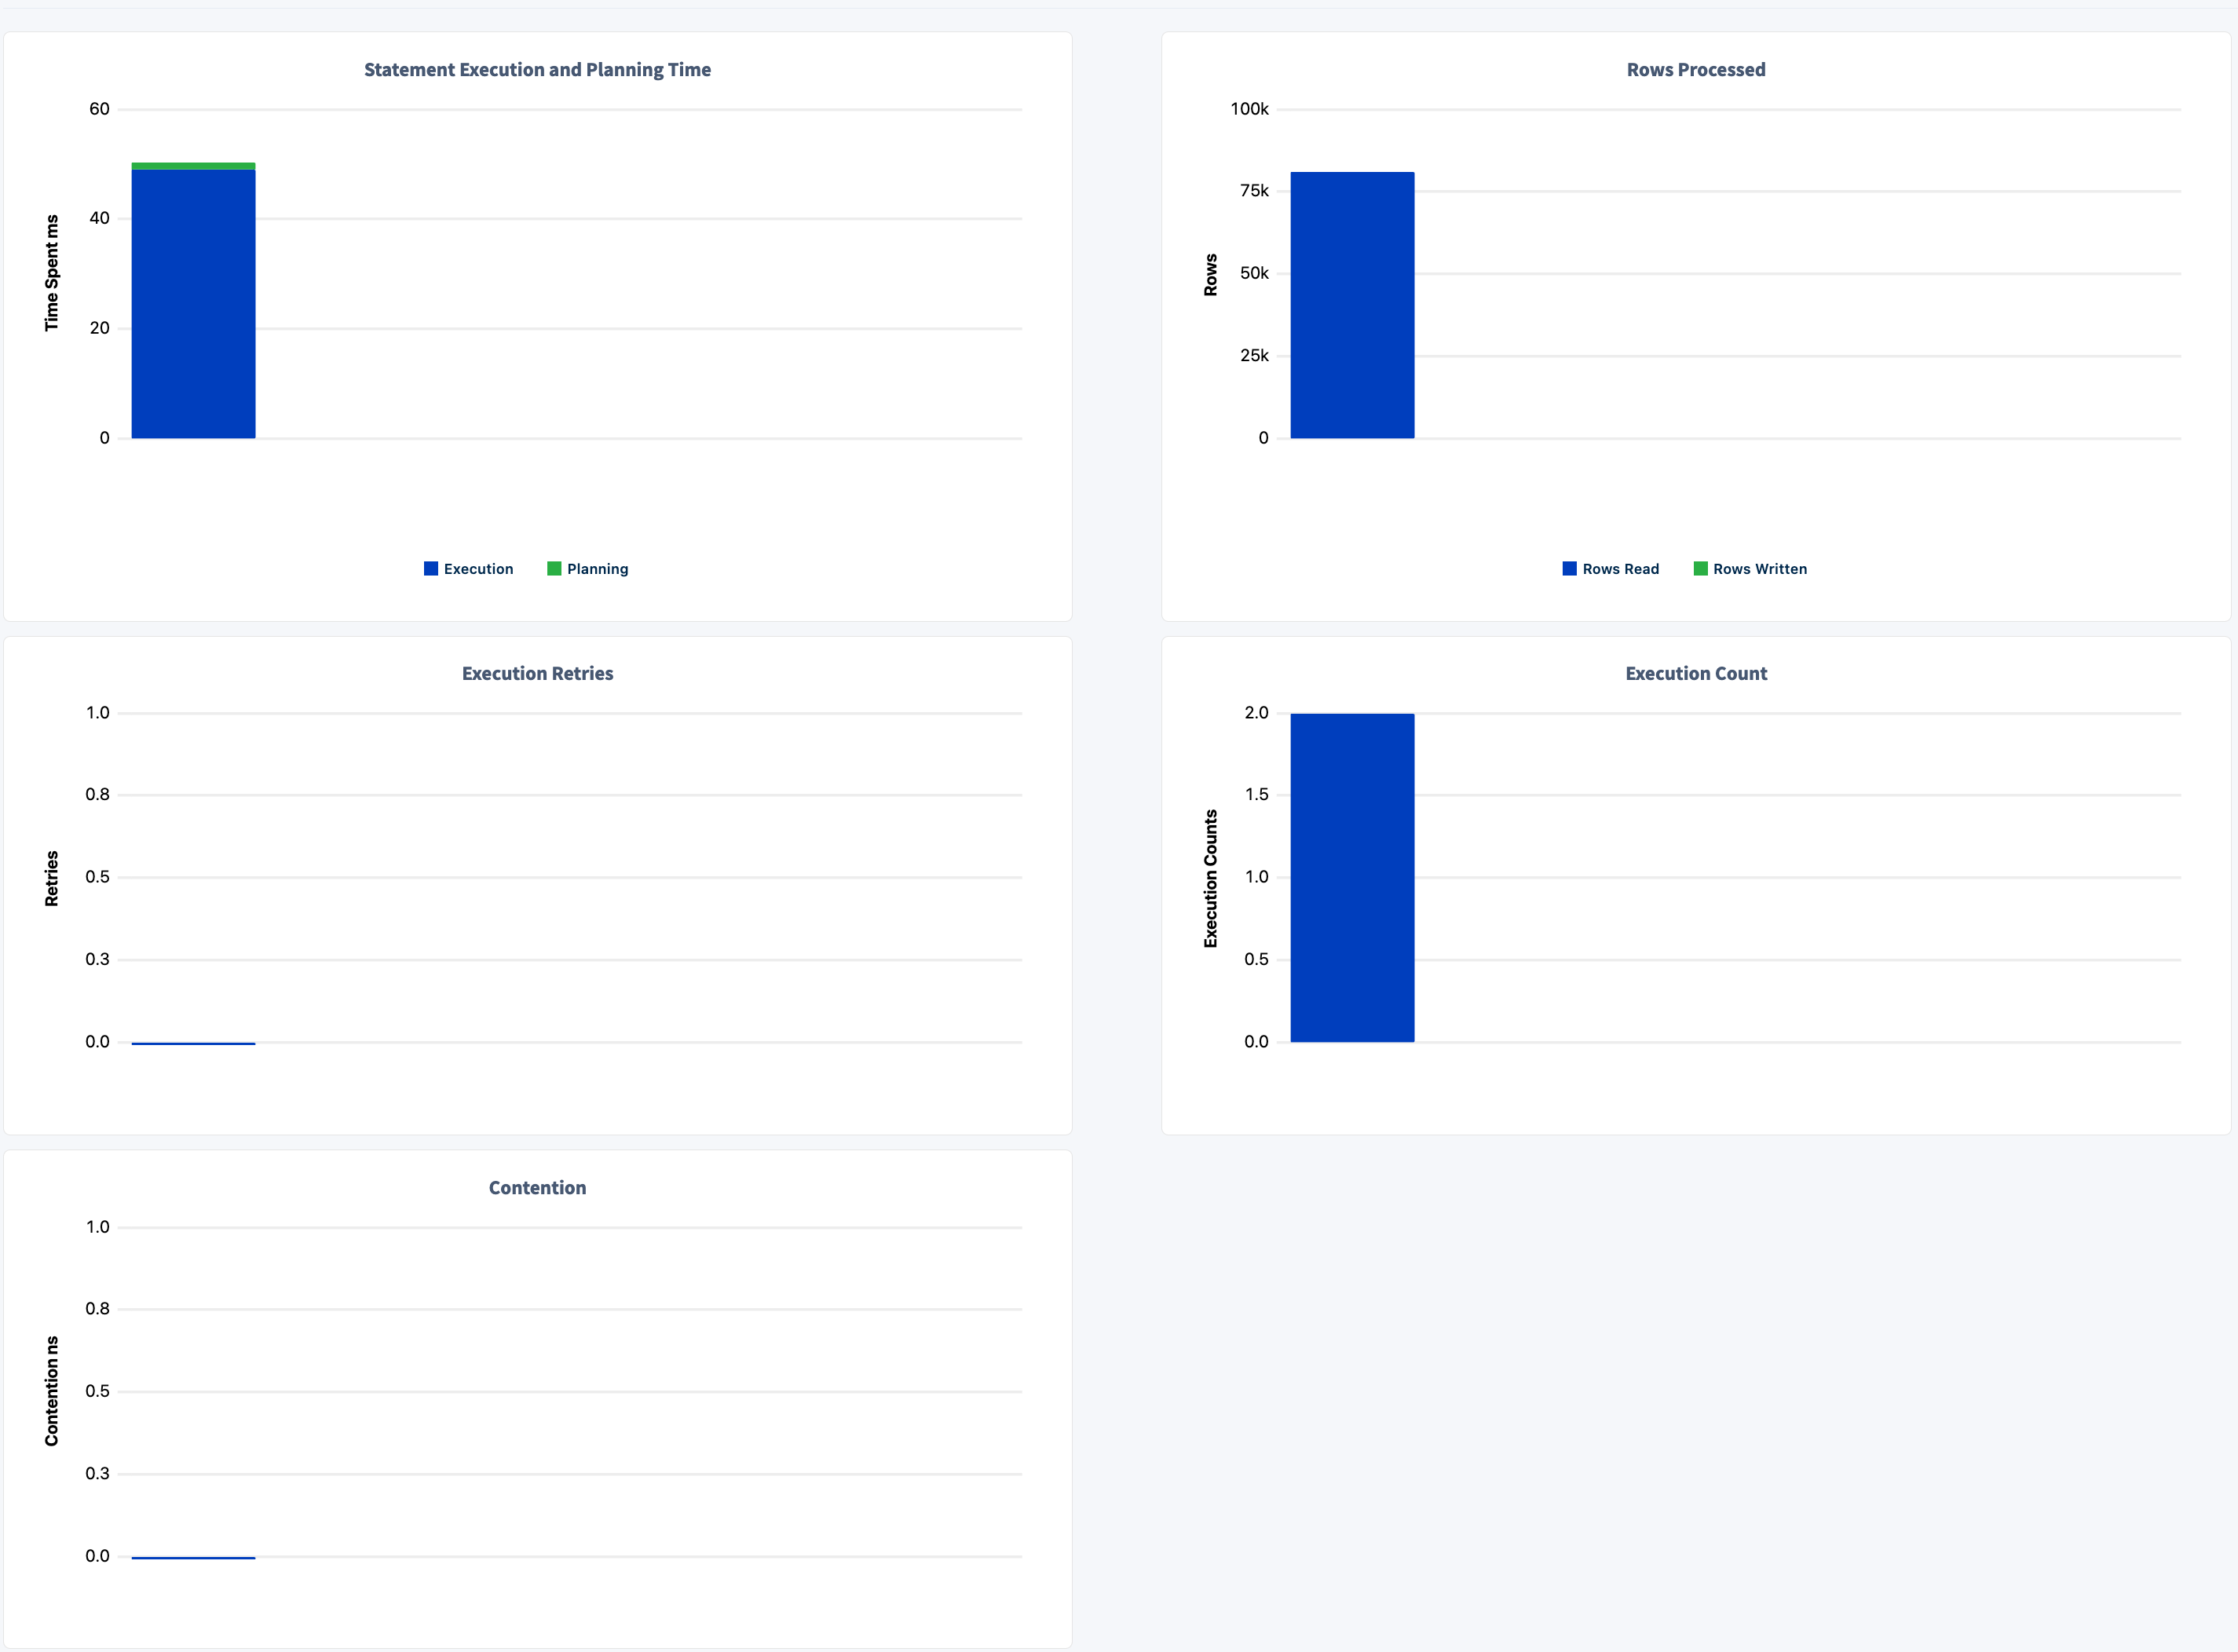
The following charts summarize the executions of the statement fingerprint illustrated in the preceding section:
Explain Plans
New in v22.1:
The Explain Plans tab displays statement plans for an explainable statement in the selected time interval. You can use this information to optimize the query. For more information about plans, see EXPLAIN.
The following screenshot shows two executions of the query discussed in the preceding sections:
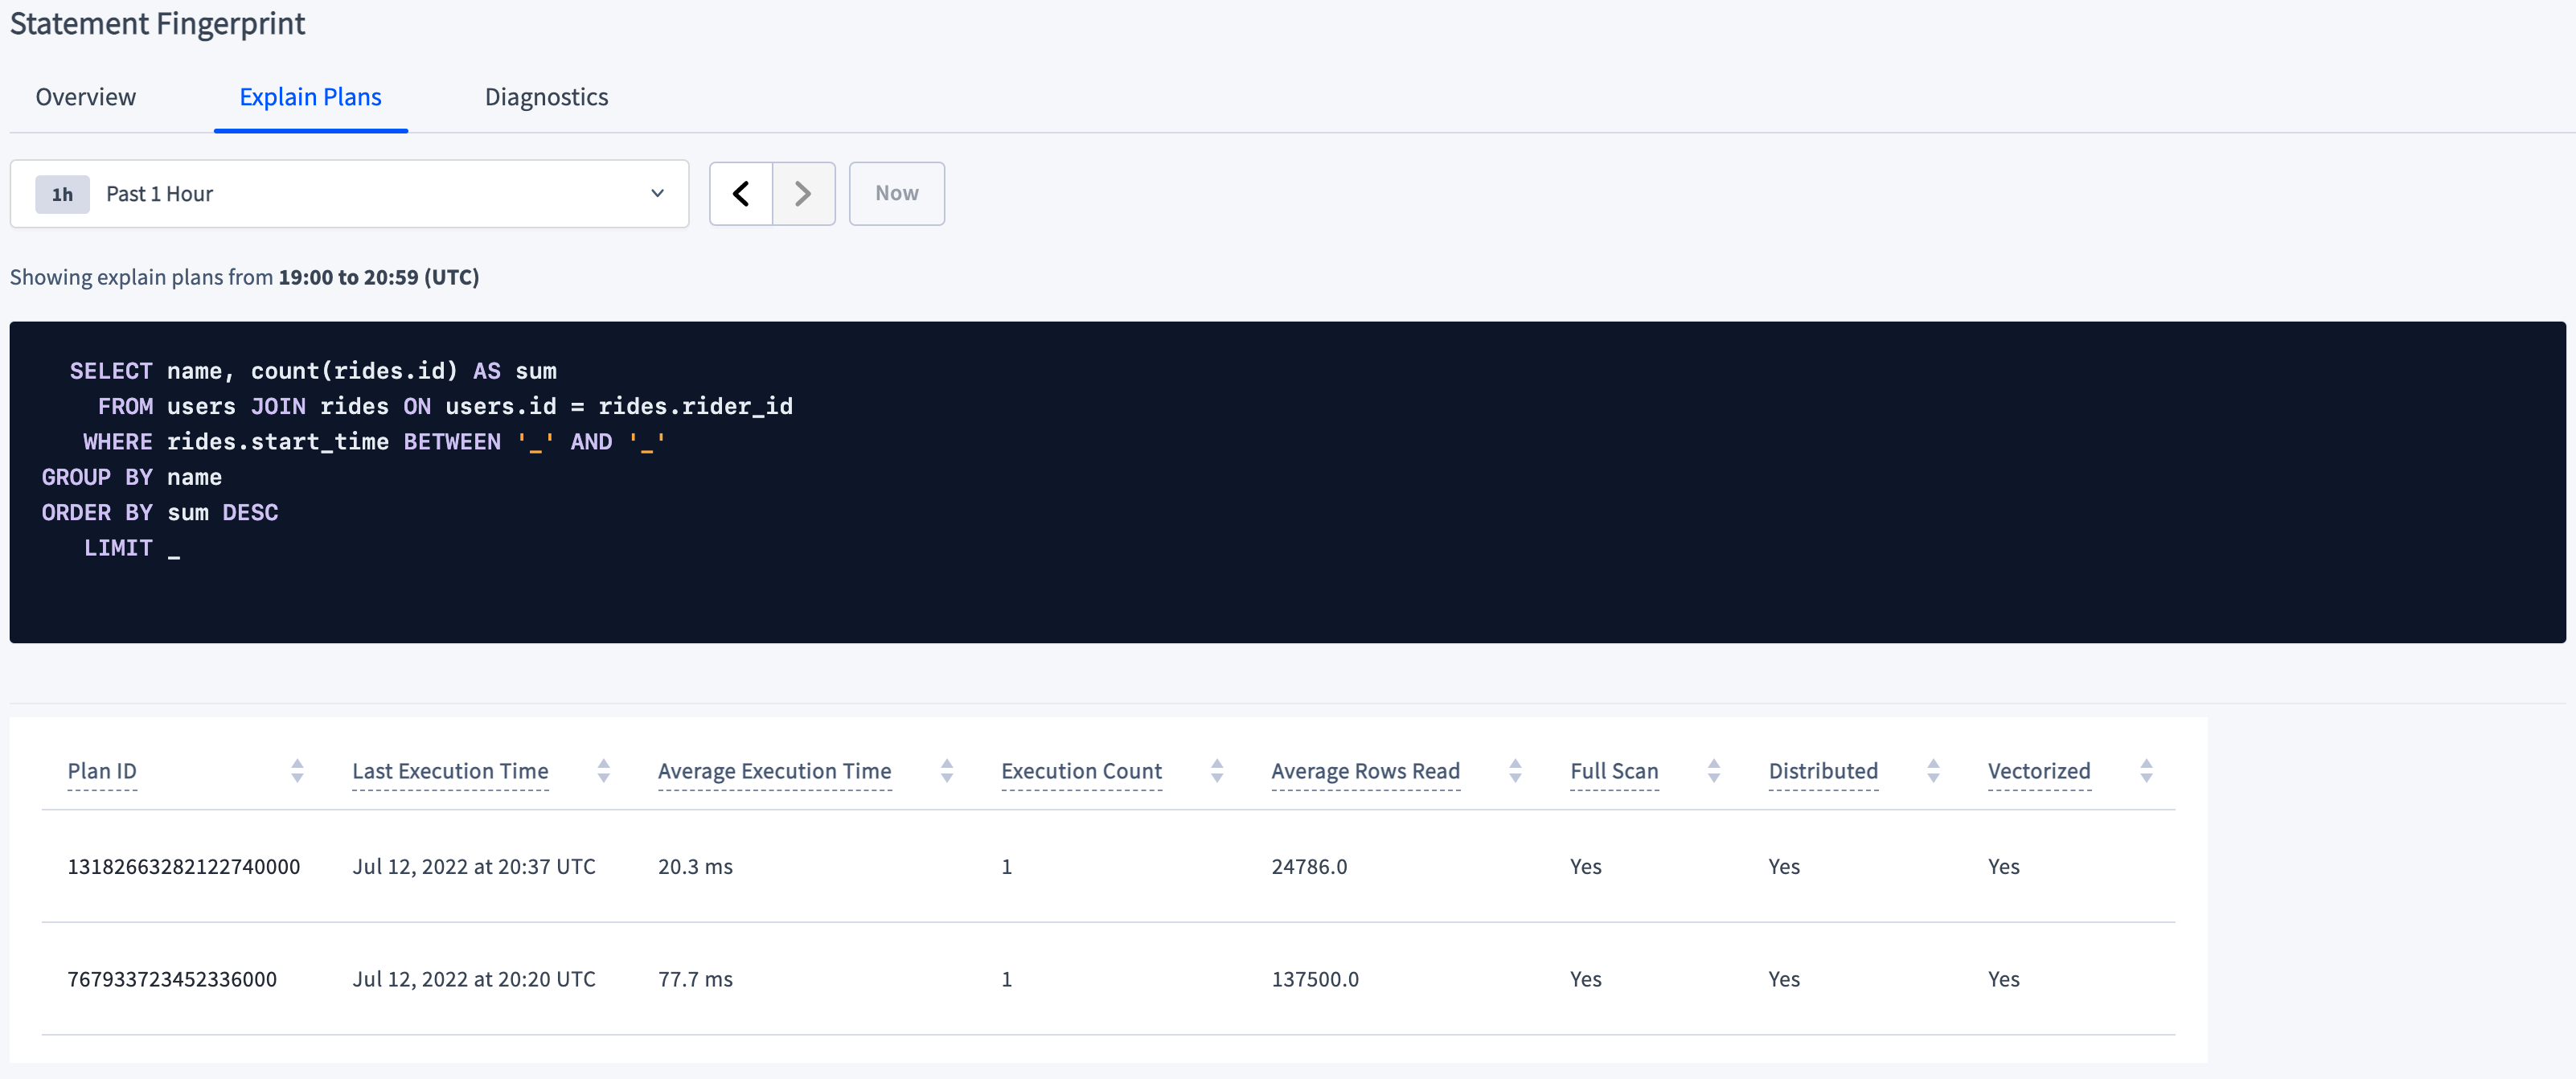
The plan table shows statistics for the execution and whether the execution was distributed or used the vectorized execution engine. In the screenshot, the Average Execution Time column show that the second execution at 20:37, which uses the index, takes less time than the first execution.
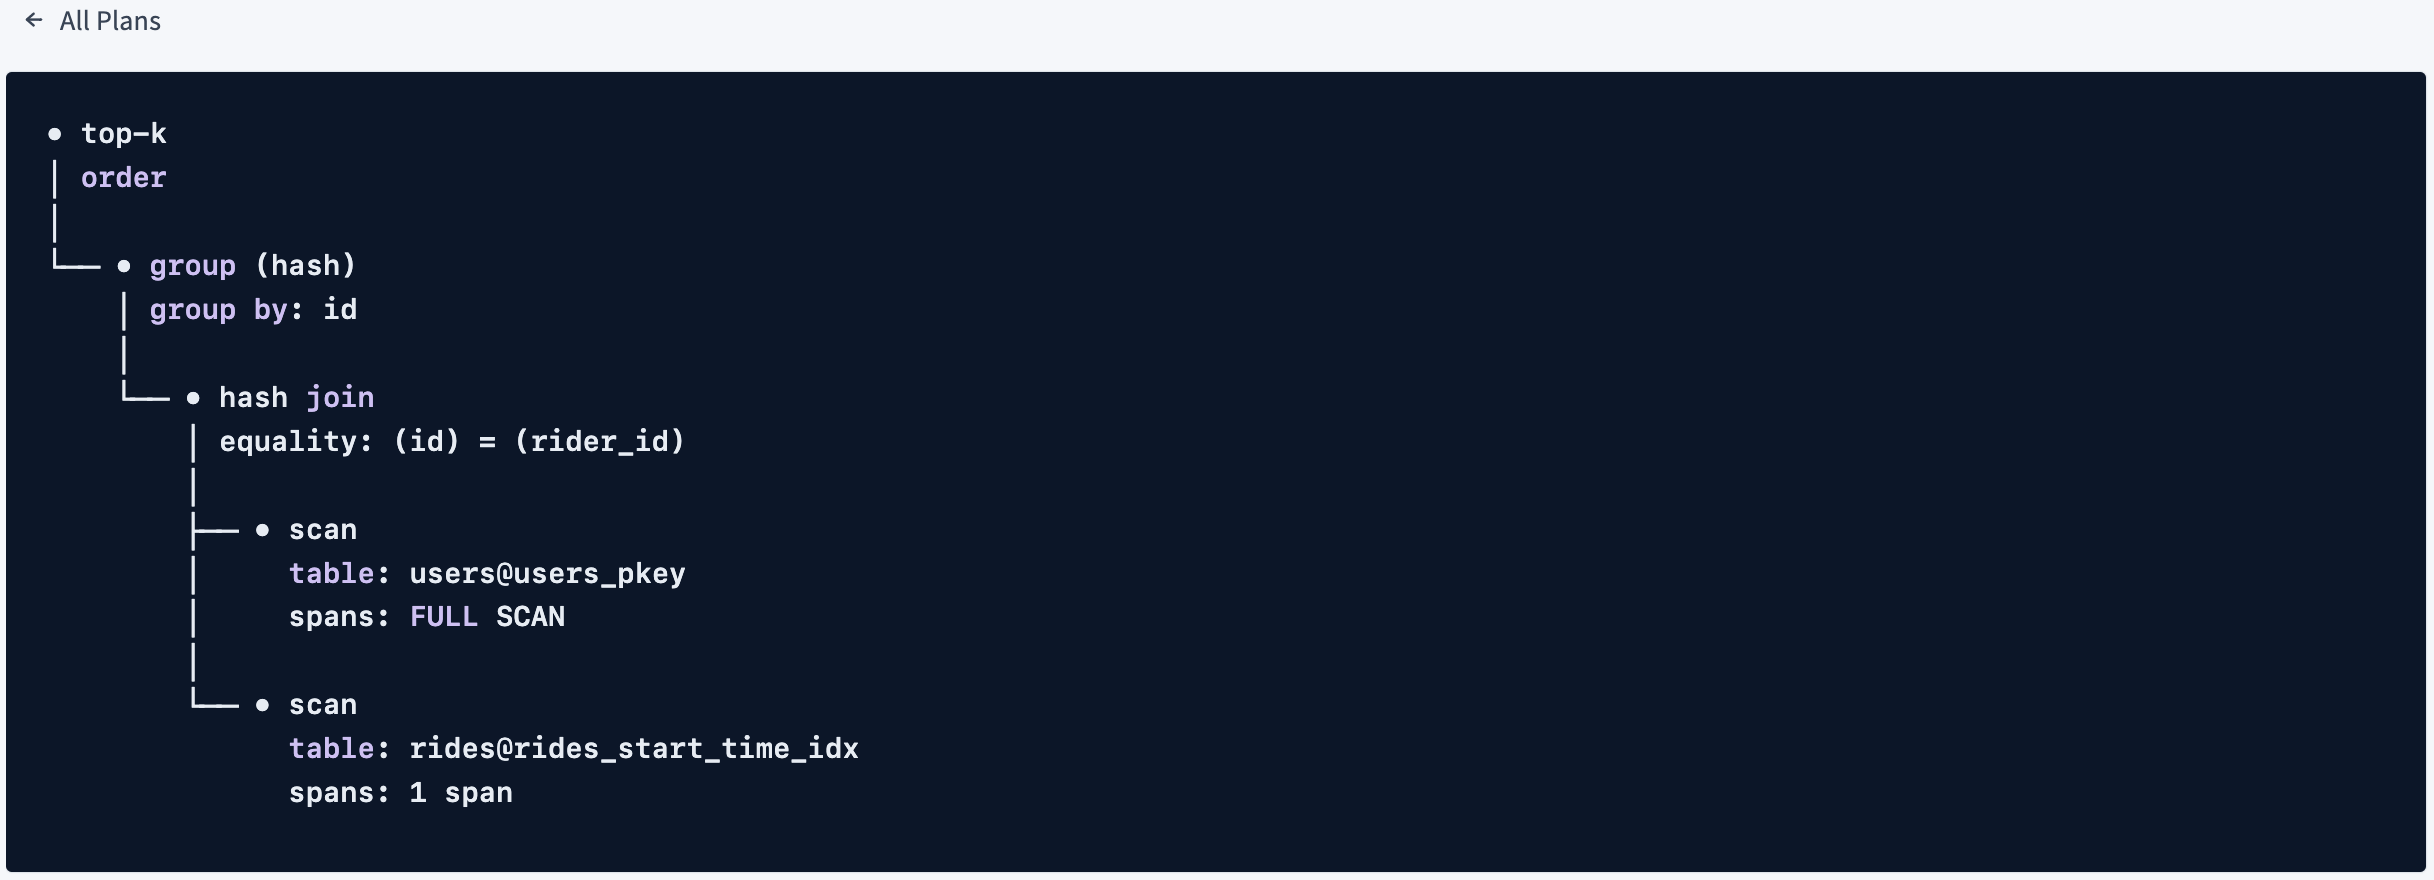
To display the plan that was executed, click a plan ID. When you click the plan ID 13182663282122740000, the following plan displays:
Diagnostics
The Diagnostics tab allows you to activate and download diagnostics for a SQL statement fingerprint.
The Diagnostics tab is not visible:
- On CockroachDB Serverless clusters.
- For roles with the
VIEWACTIVITYREDACTEDrole option.
When you activate diagnostics for a fingerprint, CockroachDB waits for the next SQL query that matches this fingerprint to be run on any node. On the next match, information about the SQL statement is written to a diagnostics bundle that you can download. This bundle consists of statement traces in various formats (including a JSON file that can be imported to Jaeger), a physical query plan, execution statistics, and other information about the query. The bundle contents are identical to those produced by EXPLAIN ANALYZE (DEBUG). You can use the information collected in the bundle to diagnose problematic SQL statements, such as slow queries. We recommend that you share the diagnostics bundle with our support team, which can help you interpret the results.
Diagnostics will be collected a maximum of N times for a given activated fingerprint where N is the number of nodes in your cluster.
In CockroachDB v24.3.1 and later,
admin users or SQL users with the VIEWACTIVITY system privilege can choose to redact user data from the Activate statement diagnostics dialog.
To allow or disallow a role from seeing statements diagnostics bundles, set the
VIEWACTIVITYREDACTED role option.
In CockroachDB v21.2.x, v22.1.0 to v22.1.16, v22.2.0 to v22.2.6, non-admin SQL users with an authenticated HTTP session could download statement diagnostic bundles given a bundle URL from the DB Console or the
EXPLAIN ANALYZE (DEBUG) statement with a valid HTTP session cookie. This has been resolved in v22.1.17 and v22.2.7. For more information, see the Technical Advisory A99049.
Activate diagnostics collection and download bundles
To activate diagnostics collection:
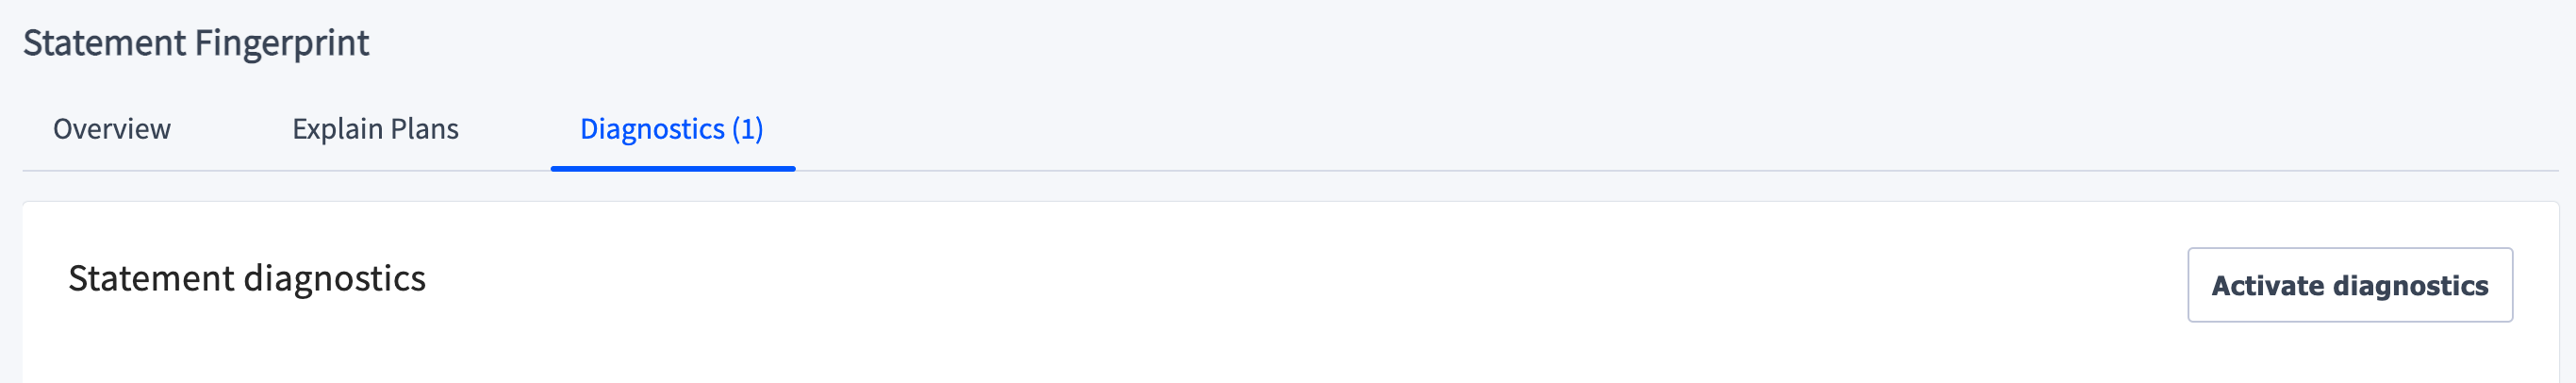
Click the Activate diagnostics button. New in v22.1: The Activate statement diagnostics dialog displays.
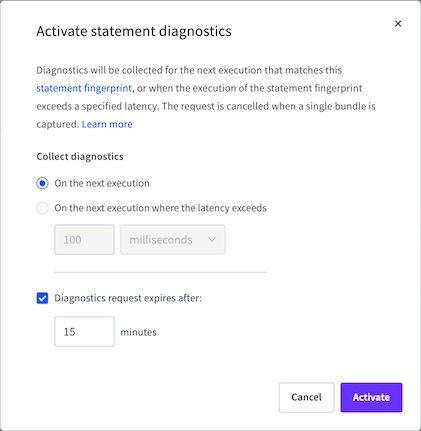
Choose whether to activate collection on the next statement execution (default) or if execution latency exceeds a certain time. If you choose the latter, accept the default latency of 100 milliseconds, or specify a different time. All executions of the statement fingerprint will run slower until diagnostics are collected.
Choose whether the request should expire after 15 minutes, or after a different the time, or disable automatic expiration by deselecting the checkbox.
Click Activate.
A row with the activation time and collection status is added to the Statement diagnostics table.
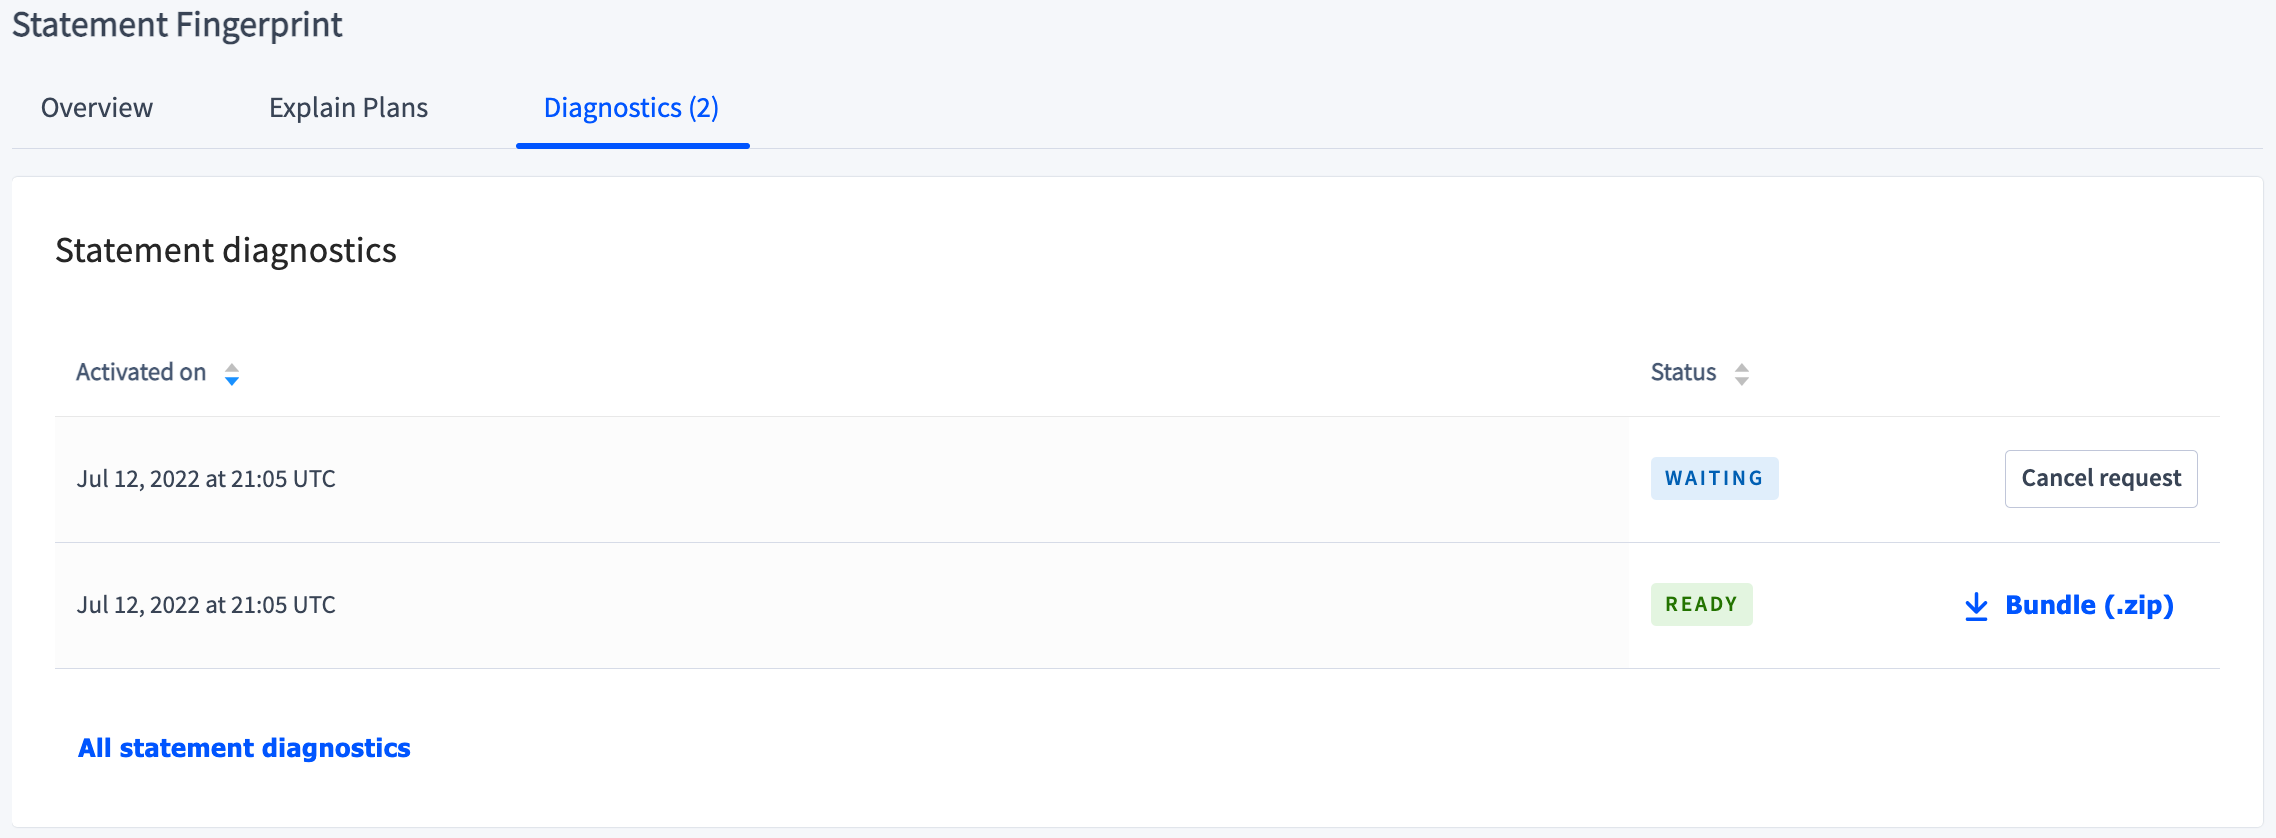
The collection status values are:
- READY: indicates that the diagnostics have been collected. To download the diagnostics bundle, click
 Bundle (.zip).
 - WAITING: indicates that a SQL statement matching the fingerprint has not yet been recorded. New in v22.1: To cancel diagnostics collection, click the Cancel request button.
- ERROR: indicates that the attempt at diagnostics collection failed.
View and download diagnostic bundles for all statement fingerprints
Although fingerprints are periodically cleared from the Statements page, all diagnostics bundles are preserved. To view and download diagnostic bundles for all statement fingerprints, do one of the following:
On the Diagnostics tab for a statement fingerprint, click the All statement diagnostics link.
Click Advanced Debug in the left-hand navigation and click Statement Diagnostics History.
Click Bundle (.zip) to download any diagnostics bundle.
