
If a SQL statement returns an unexpected result or takes longer than expected to process, this page will help you troubleshoot the issue.
For a developer-centric overview of optimizing SQL statement performance, see Optimize Statement Performance Overview.
Query issues
Hanging or stuck queries
When you experience a hanging or stuck query and the cluster is healthy (i.e., no unavailable ranges, network partitions, etc), the cause could be a long-running transaction holding write intents open against the same rows as your query.
Such long-running queries can hold intents open for (practically) unlimited durations. If your query tries to access those rows, it may have to wait for that transaction to complete (by committing or rolling back) before it can make progress.
This situation is hard to diagnose via the Transactions and Statements pages in the DB Console since contention is only reported after the conflict has been resolved (which in this scenario may be never).
In these cases, you will need to take the following steps.
- Find long running transactions
- Find client sessions for those transactions
- Cancel the transaction or session
Step 1. Find long-running transactions
Run the following query against the crdb_internal.cluster_transactions table to list transactions that have been running longer than 10 minutes.
SELECT now() - start AS dur, * FROM crdb_internal.cluster_transactions WHERE now() - start > '10m'::INTERVAL ORDER BY dur DESC LIMIT 10
For each row in the results, if the txn_string column shows lock=true (or seq > 0), the transaction associated with that row is a writing transaction, and its open write intents will block access for other transactions.
If the query returns lots of transactions, it is often the case than a single transaction is blocking others, and those may be blocking yet others. Try to look for the oldest, longest-running transaction and cancel that one first; that may be sufficient to unblock all of the others.
Step 2. Find the client session
Next, find the client session owning the long-running transaction by querying the crdb_internal.cluster_sessions table. You will need the value of the id column from the query in the previous step.
This step is necessary if you want to cancel the entire session the transaction is associated with.
SELECT * FROM crdb_internal.cluster_sessions WHERE kv_txn = {id_column_from_previous_query}
Step 3. Cancel the transaction or session
Finally, cancel the longest-running transaction you found in Step 1 using CANCEL QUERY and check if that resolves the problem.
If you want to cancel the whole session for that transaction, use CANCEL SESSION using the session ID you found in Step 2.
Identify slow queries
You can identify high-latency SQL statements (slow queries) using one of the following resources:
- The slow query log.
- The Statements page, which tracks latency in the Statement Time column.
- The Service Latency: SQL, 99th percentile graph on the SQL dashboard.
- The CPU percent graph on the Hardware dashboard.
- The graphs on the Slow requests dashboard.
If these graphs reveal latency spikes, CPU usage spikes, or slow requests, these might indicate slow queries in your cluster.
You can also collect richer diagnostics of a high-latency statement by creating a diagnostics bundle when a statement fingerprint exceeds a certain latency.
If you find queries that are consuming too much memory, cancel the queries to free up memory usage. For information on optimizing query performance, see SQL Performance Best Practices.
Visualize statement traces in Jaeger
You can look more closely at the behavior of a statement by visualizing a statement trace in Jaeger. A statement trace contains messages and timing information from all nodes involved in the execution.
Run Jaeger
Start Jaeger:
docker run -d --name jaeger -p 6831:6831/udp -p 16686:16686 jaegertracing/all-in-one:latestThis runs the latest version of Jaeger, and forwards two ports to the container.
6831is the trace ingestion port,16686is the UI port. By default, Jaeger will store all received traces in memory.
Import a trace from a diagnostics bundle into Jaeger
Activate statement diagnostics on the DB Console Statements Page or run
EXPLAIN ANALYZE (DEBUG)to obtain a diagnostics bundle for the statement.Go to
http://localhost:16686.Click JSON File in the Jaeger UI and upload
trace-jaeger.jsonfrom the diagnostics bundle. The trace will appear in the list on the right.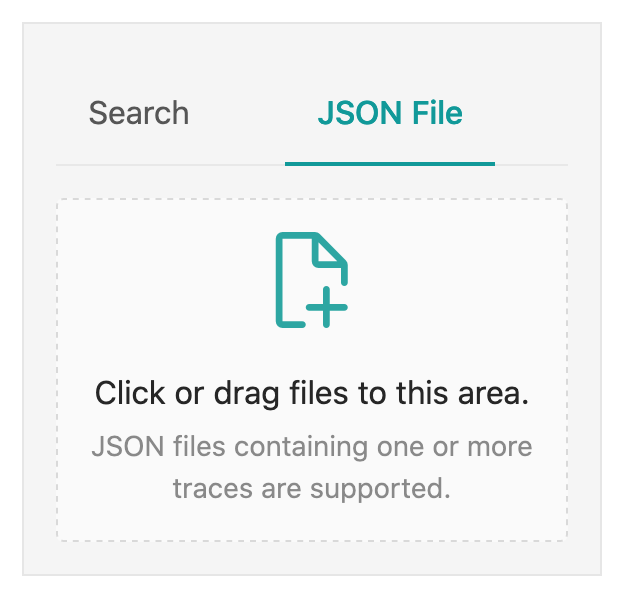
Click the trace to view its details. It is visualized as a collection of spans with timestamps. These may include operations executed by different nodes.
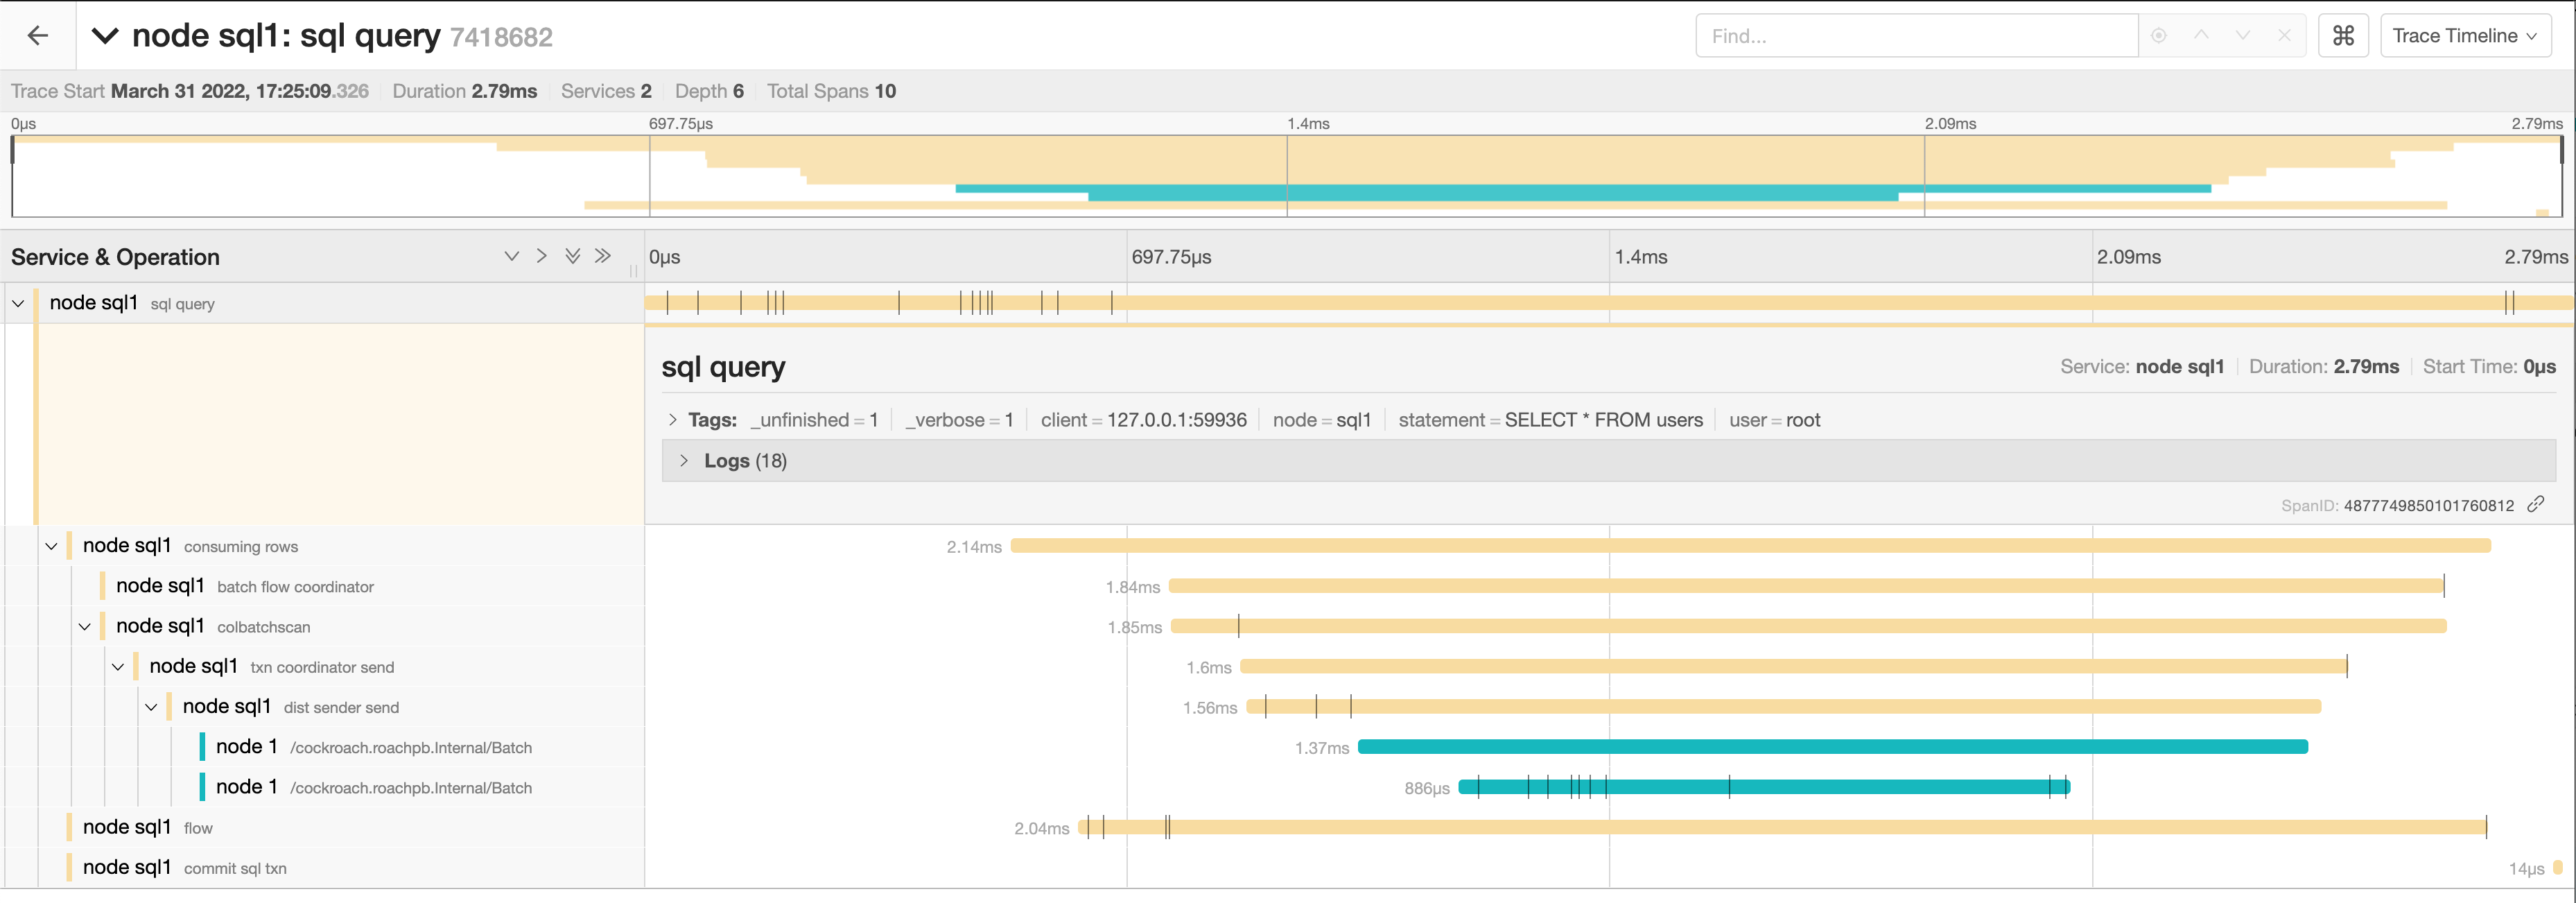
The full timeline displays the execution time and execution phases for the statement.
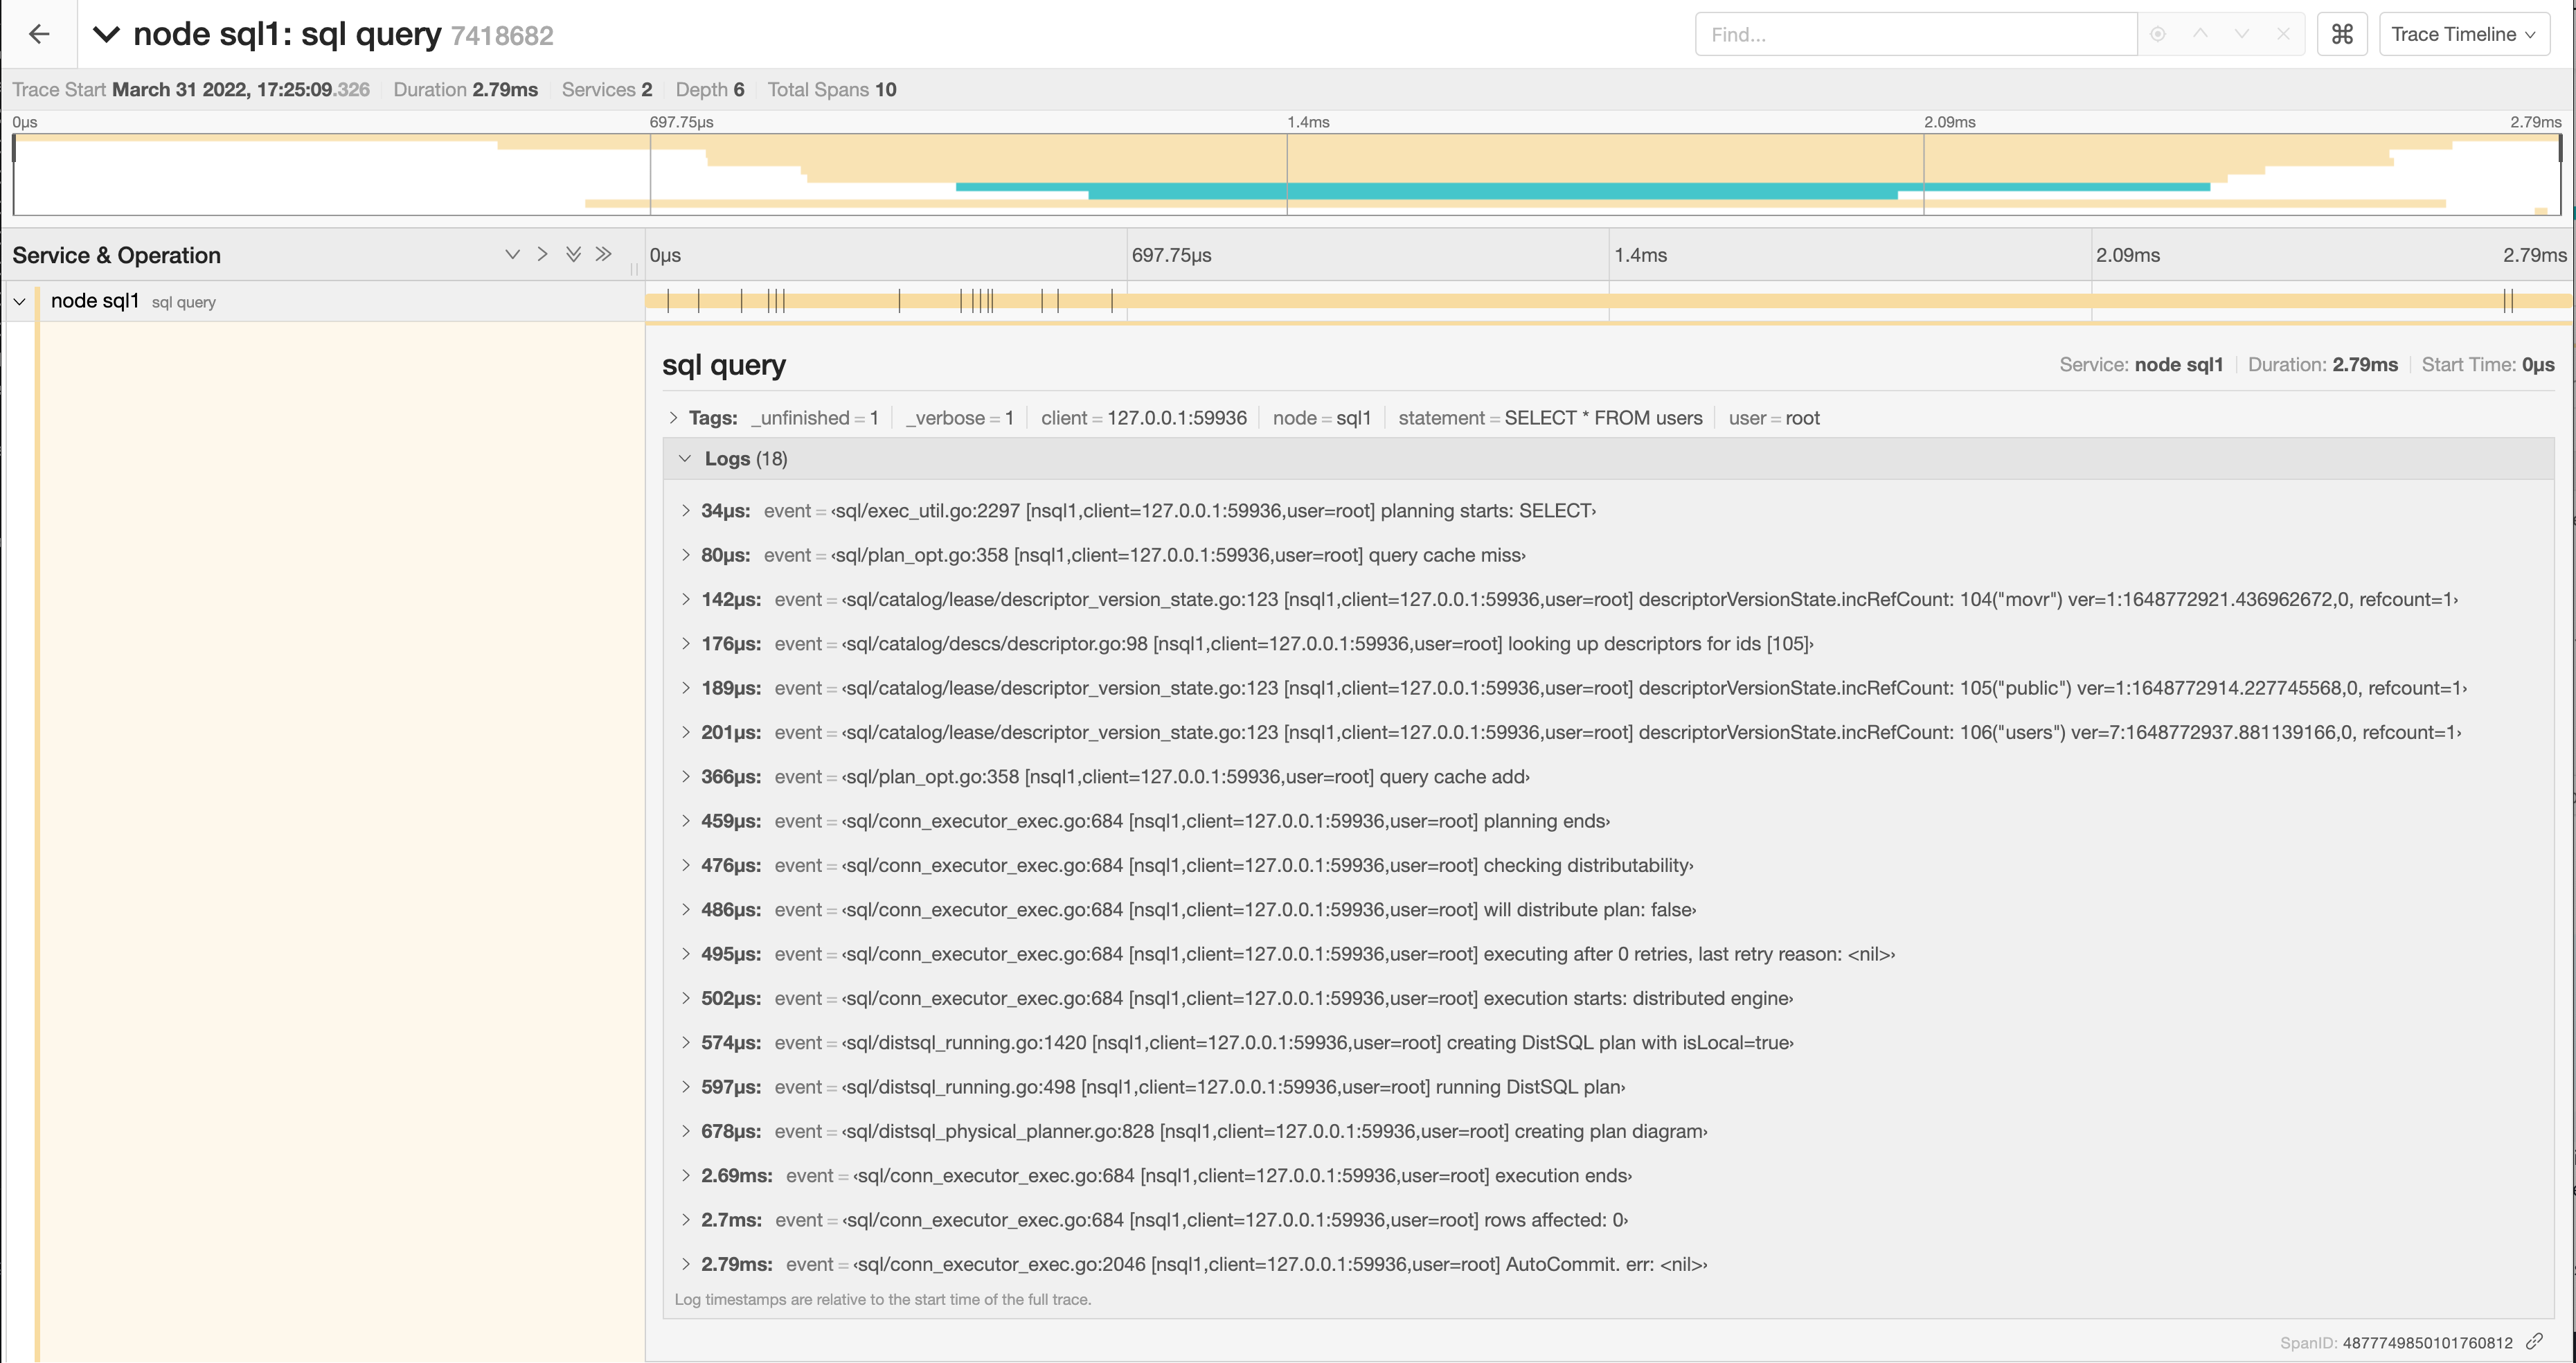
Click a span to view details for that span and log messages.
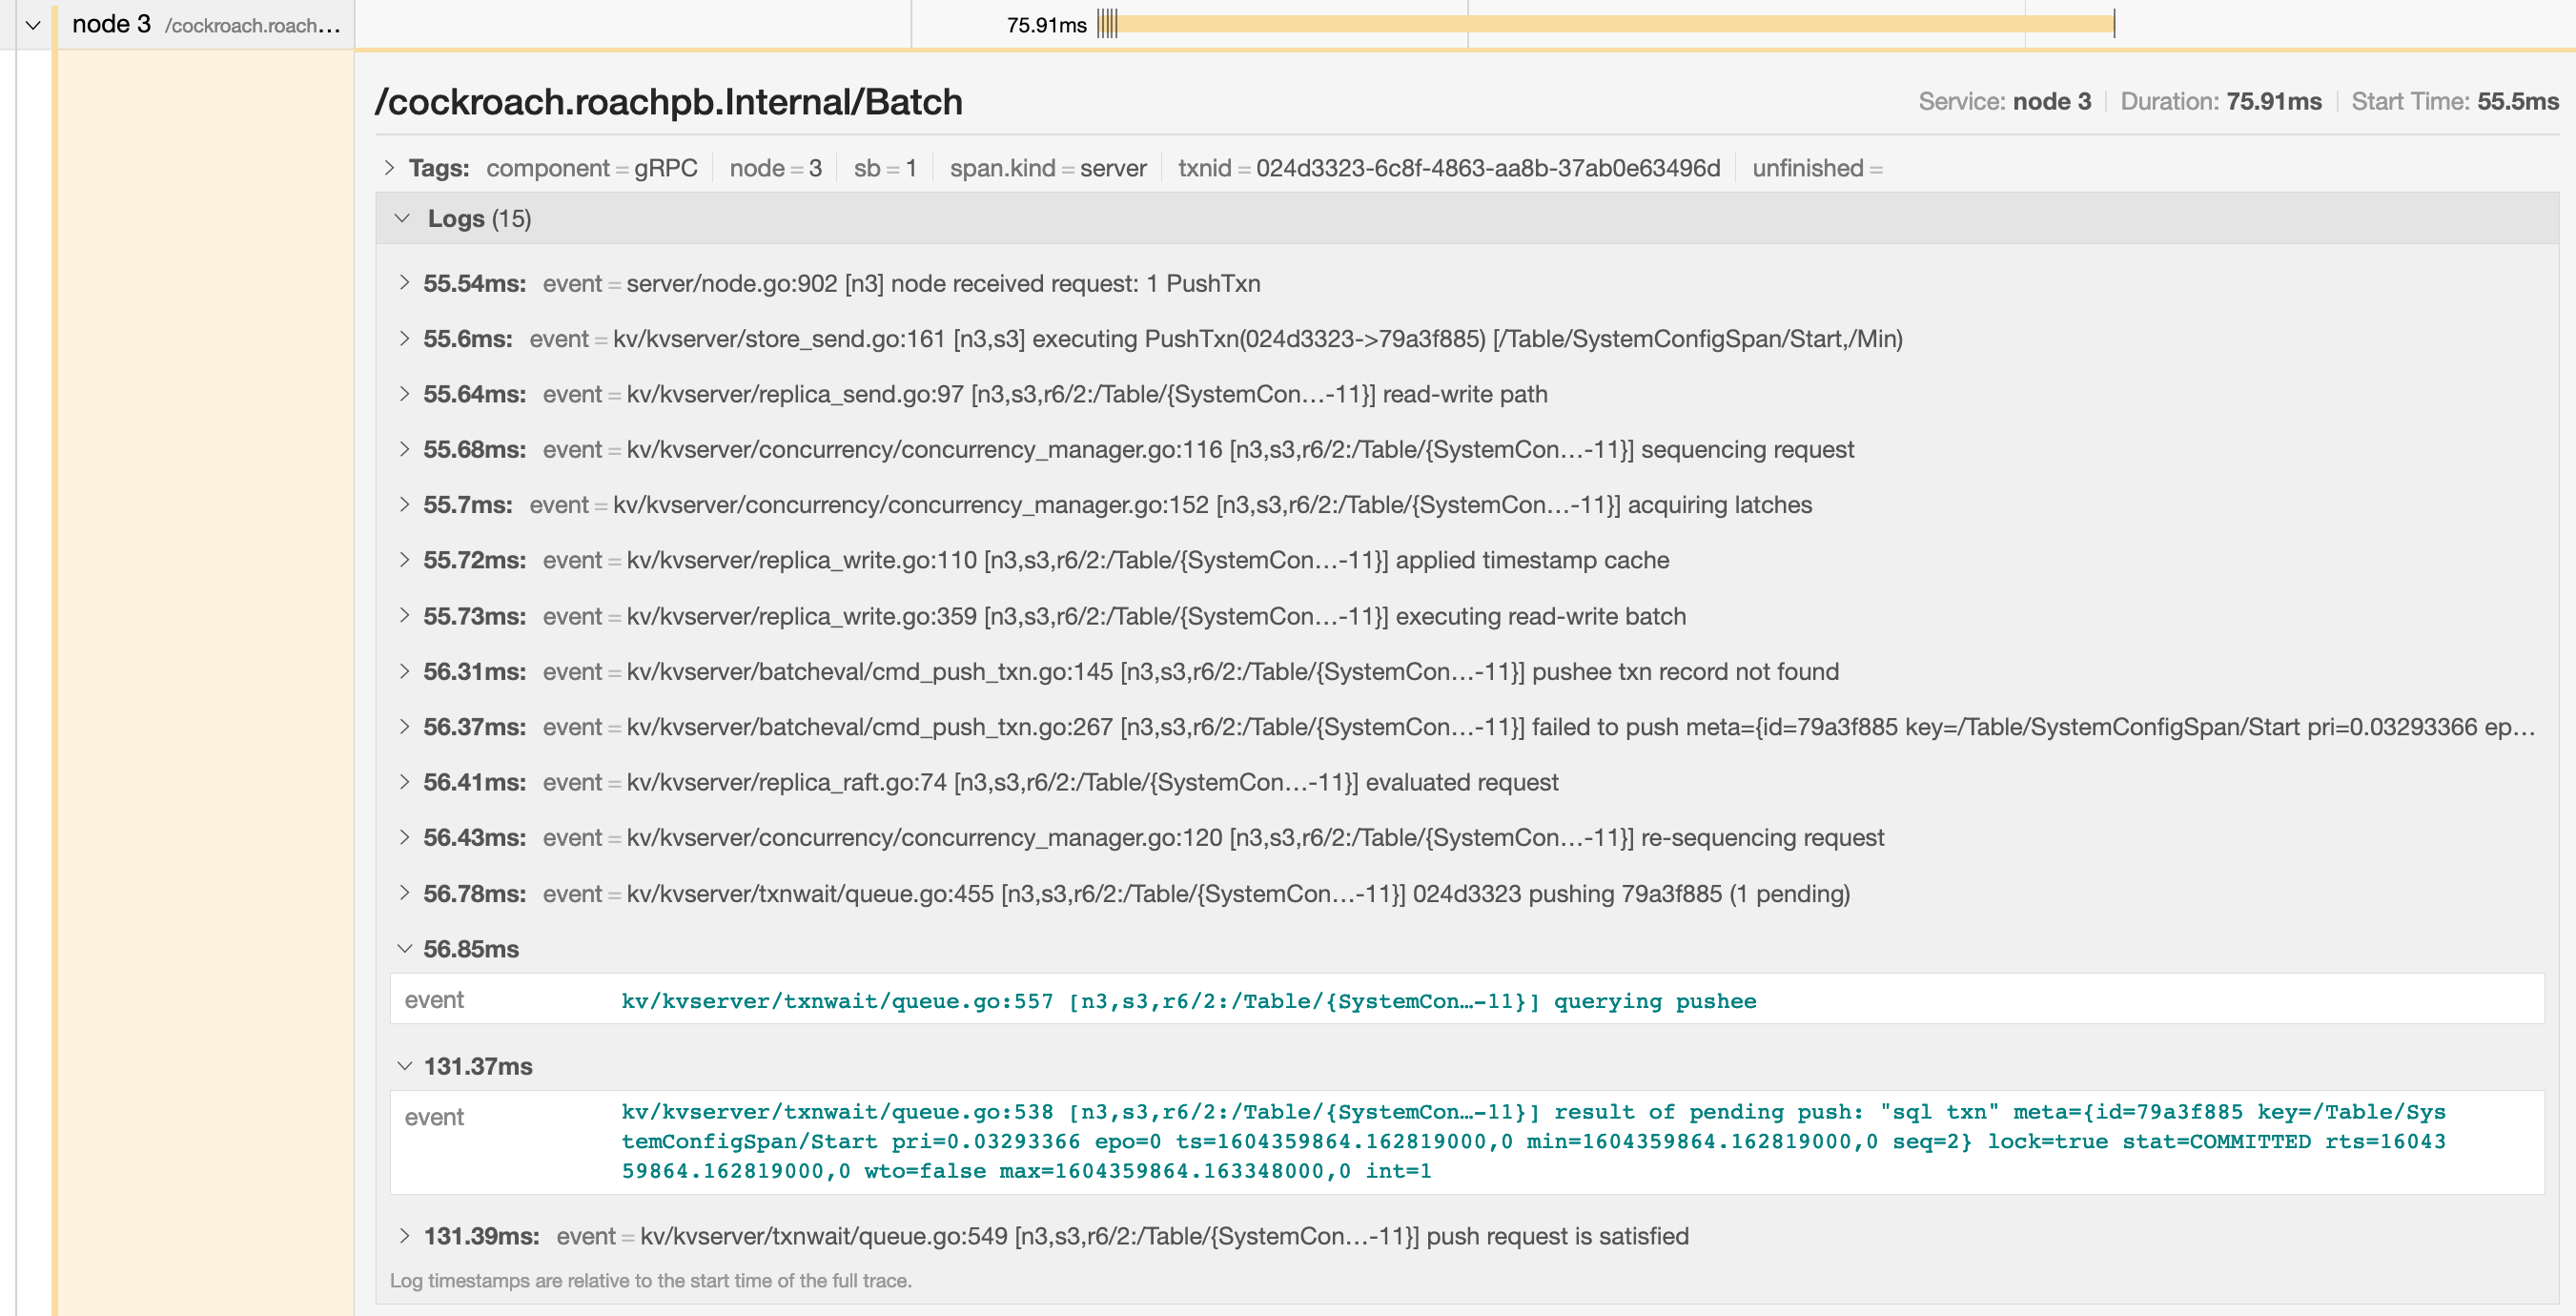
You can troubleshoot transaction contention, for example, by gathering diagnostics on statements with high latency and looking through the log messages in
trace-jaeger.jsonfor jumps in latency.In the following example, the trace shows that there is significant latency between a push attempt on a transaction that is holding a lock (56.85ms) and that transaction being committed (131.37ms).
Visualize traces sent directly from CockroachDB
This example shows how to configure CockroachDB to route all traces to Jaeger. For details on sending traces from CockroachDB to Jaeger and other trace collectors, see Configure CockroachDB to send traces to a third-party trace collector.
Enabling full tracing is expensive both in terms of CPU usage and memory footprint, and is not suitable for high throughput production environments.
Run CockroachDB and set the Jaeger agent configuration:
SET CLUSTER SETTING trace.jaeger.agent='localhost:6831'Go to
http://localhost:16686.In the Service field, select CockroachDB.
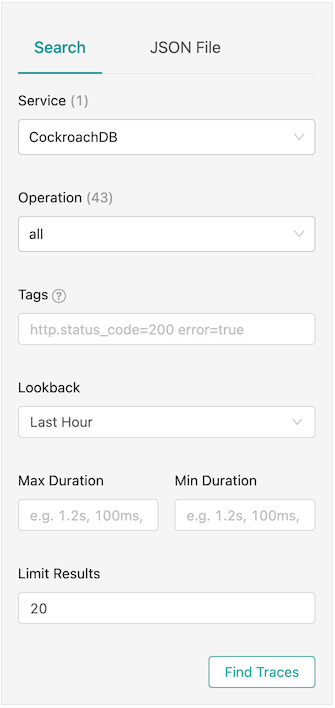
Click Find Traces.
Instead of searching through log messages in an unstructured fashion, the logs are now graphed in a tree format based on how the contexts were passed around. This also traverses machine boundaries so you don't have to look at different flat .log files to correlate events.
Jaeger's memory storage works well for small use cases, but can result in out of memory errors when collecting many traces over a long period of time. Jaeger also supports disk-backed local storage using Badger. To use this, start Jaeger by running the following Docker command:
docker run -d --name jaeger \
-e SPAN_STORAGE_TYPE=badger -e BADGER_EPHEMERAL=false \
-e BADGER_DIRECTORY_VALUE=/badger/data -e BADGER_DIRECTORY_KEY=/badger/key \
-v /mnt/data1/jaeger:/badger \
-p 6831:6831/udp -p 16686:16686 jaegertracing/all-in-one:latest
Queries are always slow
If you have consistently slow queries in your cluster, use the Statement Fingerprint page to drill down to an individual statement and collect diagnostics for the statement. A diagnostics bundle contains a record of transaction events across nodes for the SQL statement.
You can also use an EXPLAIN ANALYZE statement, which executes a SQL query and returns a physical query plan with execution statistics. You can use query plans to troubleshoot slow queries by indicating where time is being spent, how long a processor (i.e., a component that takes streams of input rows and processes them according to a specification) is not doing work, etc.
Cockroach Labs recommends sending either the diagnostics bundle (preferred) or the EXPLAIN ANALYZE output to our support team for analysis.
Queries are sometimes slow
If the query performance is irregular:
Run
SHOW TRACE FOR SESSIONfor the query twice: once when the query is performing as expected and once when the query is slow.Contact support to help analyze the outputs of the
SHOW TRACEcommand.
SELECT statements are slow
The common reasons for a sub-optimal SELECT performance are inefficient scans, full scans, and incorrect use of indexes. To improve the performance of SELECT statements, refer to the following documents:
SELECT statements with GROUP BY columns are slow
Suppose you have a slow selection query that
- Has a
GROUP BYclause. - Uses an index that has a
STORINGclause. - Where some or all of the columns in the query's
GROUP BYclause are part of the index'sSTORINGclause and are not index key columns.
For example:
SELECT
  cnt, organization, concat(os, '-', version) AS bucket
FROM
  (
    SELECT
      count(1)::FLOAT8 AS cnt, organization, os, version
    FROM
      nodes
    WHERE
      lastseen > ($1)::TIMESTAMPTZ AND lastseen <= ($2)::TIMESTAMPTZ
    GROUP BY
      organization, os, version
  )

Arguments:
  $1: '2021-07-27 13:22:09.000058Z'
  $2: '2021-10-25 13:22:09.000058Z'
The columns in the GROUP BY clause are organization, os, and version.
The query plan shows that it is using index nodes_lastseen_organization_storing:
                     distribution         full
                     vectorized           true
render                                                                                                      (cnt float, organization varchar, bucket string)
 │                   estimated row count  3760
 │                   render 0             (concat((os)[string], ('-')[string], (version)[string]))[string]
 │                   render 1             ((count_rows)[int]::FLOAT8)[float]
 │                   render 2             (organization)[varchar]
 └── group                                                                                                  (organization varchar, os string, version string, count_rows int)
      │              estimated row count  3760
      │              aggregate 0          count_rows()
      │              group by             organization, os, version
      └── project                                                                                           (organization varchar, os string, version string)
           └── scan                                                                                         (organization varchar, lastseen timestamptz, os string, version string)
                     estimated row count  2330245
                     table                nodes@nodes_lastseen_organization_storing
                     spans                /2021-07-27T13:22:09.000059Z-/2021-10-25T13:22:09.000058001Z
Here is the table schema for the example query:
CREATE TABLE public.nodes (
    id VARCHAR(60) NOT NULL,
    ampuuid UUID NULL,
    organization VARCHAR(60) NULL,
    created TIMESTAMPTZ NULL DEFAULT now():::TIMESTAMPTZ,
    disabled BOOL NOT NULL DEFAULT false,
    lastseen TIMESTAMPTZ NULL DEFAULT now():::TIMESTAMPTZ,
    os STRING NOT NULL,
    arch STRING NOT NULL,
    autotags JSONB NULL,
    version STRING NOT NULL DEFAULT '':::STRING,
    clone BOOL NOT NULL DEFAULT false,
    cloneof VARCHAR(60) NOT NULL DEFAULT '':::STRING,
    endpoint_type STRING NOT NULL DEFAULT 'amp':::STRING,
    ip INET NULL,
    osqueryversion STRING NOT NULL DEFAULT '':::STRING,
    CONSTRAINT "primary" PRIMARY KEY (id ASC),
    INDEX nodes_organization_ampuuid (organization ASC, ampuuid ASC),
    INDEX nodes_created_asc_organization (created ASC, organization ASC),
    INDEX nodes_created_desc_organization (created DESC, organization ASC),
    INDEX nodes_organization_os_version (organization ASC, os ASC, version ASC),
    INDEX nodes_organization_version (organization ASC, version ASC),
    INDEX nodes_lastseen_organization_storing (lastseen ASC, organization ASC) STORING (os, version),
    FAMILY "primary" (id, ampuuid, organization, created, disabled, lastseen, os, arch, autotags, version, clone, cloneof, endpoint_type, ip, osqueryversion)
);
The nodes_lastseen_organization_storing index has the GROUP BY column organization as an index key column. However, the STORING clause includes the GROUP BY columns os and version.
Solution
Create a new secondary index that has all of the GROUP BY columns as key columns in the index.
CREATE INDEX "nodes_lastseen_organization_os_version" (lastseen, organization, os, version)
This index allows CockroachDB to perform a streaming GROUP BY rather than a hash GROUP BY. After you make this change, you should notice an improvement in the latency of the example query.
INSERT and UPDATE statements are slow
Use the Statements page to identify the slow SQL statements.
Refer to the following pages to improve INSERT and UPDATE performance:
Cancel running queries
See Cancel long-running queries.
Low throughput
Throughput is affected by the disk I/O, CPU usage, and network latency. Use the DB Console to check the following metrics:
Disk I/O: Disk IOPS in progress
CPU usage: CPU percent
Network latency: Network Latency
Query runs out of memory
If your query returns the error code SQLSTATE: 53200 with the message ERROR: root: memory budget exceeded, follow the guidelines in memory budget exceeded.
Node issues
Single hot node
A hot node is one that has much higher resource usage than other nodes. To determine if you have a hot node in your cluster, access the DB Console and check the following:
- Click Metrics and navigate to the following graphs. Hover over each graph to see the per-node values of the metrics. If one of the nodes has a higher value, you have a hot node in your cluster.
- Replication dashboard > Average Queries per Store graph
- Overview dashboard > Service Latency graph
- Hardware dashboard > CPU Percent graph
- SQL dashboard > SQL Connections graph
- Hardware dashboard > Disk IOPS in Progress graph
- Open the Hot Ranges page and check for ranges with significantly higher QPS on any nodes.
Solution
If you have a small table that fits into one range, then only one of the nodes will be used. This is expected behavior. However, you can split your range to distribute the table across multiple nodes.
If the SQL Connections graph shows that one node has a higher number of SQL connections and other nodes have zero connections, check if your app is set to talk to only one node.
Check load balancer settings.
Check for transaction contention.
If you have a monotonically increasing index column or primary Key, then your index or primary key should be redesigned. For more information, see Unique ID best practices.
If a range has significantly higher QPS on a node, there may be a hot spot on the range that needs to be reduced. For more information, see Hot spots.
If you have a monotonically increasing index column or primary key, then your index or primary key should be redesigned. See Unique ID best practices for more information.
Per-node queries per second (QPS) is high
If a cluster is not idle, it is useful to monitor the per-node queries per second. CockroachDB will automatically distribute load throughout the cluster. If one or more nodes is not performing any queries there is likely something to investigate. See exec_success and exec_errors which track operations at the KV layer and sql_{select,insert,update,delete}_count which track operations at the SQL layer.
Increasing number of nodes does not improve performance
See Why would increasing the number of nodes not result in more operations per second?
bad connection and closed responses
A response of bad connection or closed normally indicates that the node to which you are connected has terminated. You can check this by connecting to another node in the cluster and running cockroach node status.
Once you find the node, you can check its logs (stored in cockroach-data/logs by default).
Because this kind of behavior is unexpected, you should file an issue.
Log queries executed by a specific node
If you are testing CockroachDB locally and want to log queries executed by a specific node, you can either pass a CLI flag at node startup or execute a SQL function on a running node.
Using the CLI to start a new node, use the --vmodule flag with the cockroach start command. For example, to start a single node locally and log all client-generated SQL queries it executes, run:
$ cockroach start --insecure --listen-addr=localhost --vmodule=exec_log=2 --join=<join addresses>
To log CockroachDB-generated SQL queries as well, use --vmodule=exec_log=3.
From the SQL prompt on a running node, execute the crdb_internal.set_vmodule() function:
> SELECT crdb_internal.set_vmodule('exec_log=2');
This will result in the following output:
  crdb_internal.set_vmodule
+---------------------------+
                          0
(1 row)
Once the logging is enabled, all client-generated SQL queries executed by the node will be written to the DEV logging channel, which outputs by default to the primary cockroach log file in /cockroach-data/logs. Use the symlink cockroach.log to open the most recent log.
I180402 19:12:28.112957 394661 sql/exec_log.go:173 [n1,client=127.0.0.1:50155,user=root] exec "psql" {} "SELECT version()" {} 0.795 1 ""
Configure CockroachDB to send traces to a third-party trace collector
You can configure CockroachDB to send traces to a third-party collector. CockroachDB supports Jaeger, Zipkin, and any trace collector that can ingest traces over the standard OTLP protocol. Enabling tracing also activates all the log messages, at all verbosity levels, as traces include the log messages printed in the respective trace context.
Enabling full tracing is expensive both in terms of CPU usage and memory footprint, and is not suitable for high throughput production environments.
You can configure the CockroachDB tracer to route to the OpenTelemetry tracer, with OpenTelemetry being supported by all observability tools. In particular, you can configure CockroachDB to output traces to:
- A collector that uses the OpenTelemetry Protocol (OTLP).
- The OpenTelemetry (OTEL) collector, which can in turn route them to other tools. The OTEL collector is a canonical collector, using the OTLP protocol, that can buffer traces and perform some processing on them before exporting them to Jaeger, Zipkin, and other OTLP tools.
- Jaeger or Zipkin using their native protocols. This is implemented by using the Jaeger and Zipkin dedicated "exporters" from the OTEL SDK.
The following cluster settings are supported:
| Setting | Type | Default | Description |
|---|---|---|---|
trace.opentelemetry.collector | string | | The address of an OpenTelemetry trace collector to receive traces using the OTEL gRPC protocol, as <host>:<port>. If no port is specified, 4317 is used. |
trace.jaeger.agent | string | | The address of a Jaeger agent to receive traces using the Jaeger UDP Thrift protocol, as <host>:<port>. If no port is specified, 6381 is used. |
trace.zipkin.collector | string | | The address of a Zipkin instance to receive traces, as <host>:<port>. If no port is specified, 9411 is used. |
Something else?
Try searching the rest of our docs for answers or using our other support resources, including:
