On a , you must be an or a SQL user with the or (or the legacy
VIEWACTIVITY ) to access this area of the DB Console. Refer to .- Statement Fingerprints show information about completed SQL statements.
- Active Executions show information about SQL statements which are currently executing.
Statement Fingerprints view
The Statements Fingerprints view helps you:- Identify frequently executed or high latency .
- View SQL statement fingerprint details.
- Download SQL statement diagnostics for troubleshooting.
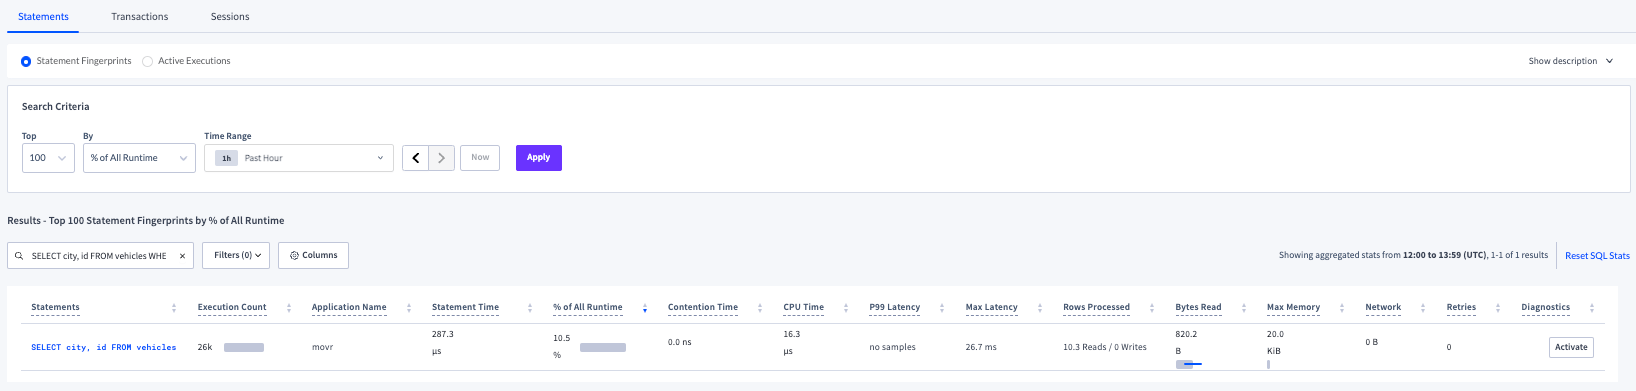
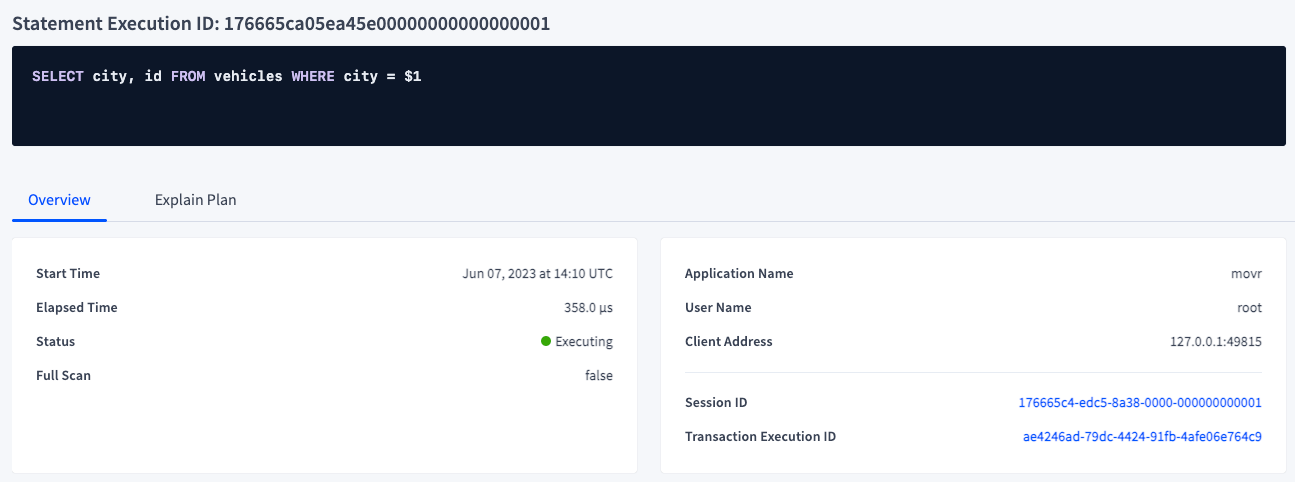
SELECT city, id FROM vehicles WHERE city = $1 while running the :
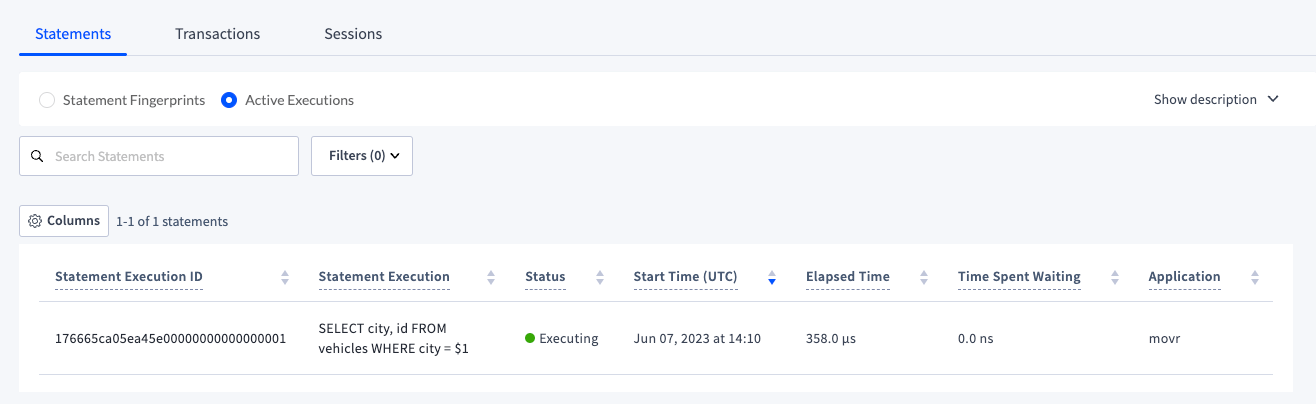
Active Executions view
The Active Executions view helps you:- Understand and tune workload performance, particularly for long-running statements.
Active executions are polled every 10 seconds. Faster-running executions will potentially disappear upon each refresh.
SELECT city, id FROM vehicles WHERE city = 'washington dc' while running the :
Statement Fingerprints results
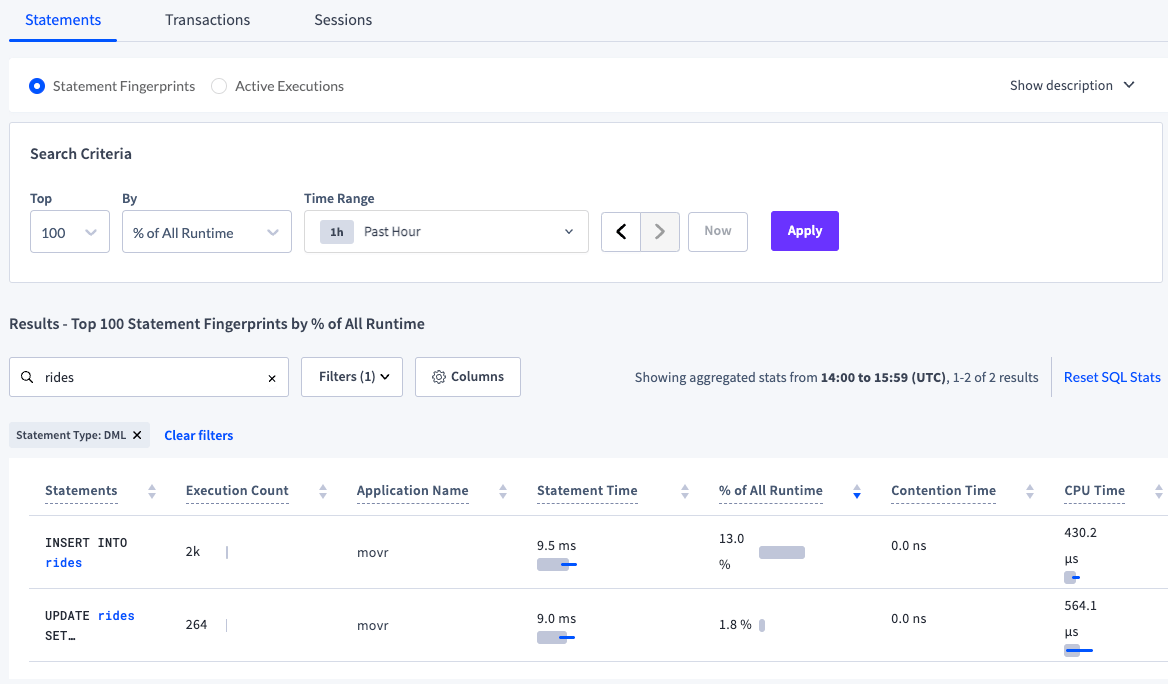
The statement fingerprints returned are determined by the selected Search Criteria.Search Criteria
By default, the Top100 statement fingerprints By % of All Runtime for the Past Hour are returned.
- To change the number of results returned, select
25,50,100, or500from the Top dropdown. To return a larger number, selectMoreand choose an option:1000,5000,10000. - To change the sort column, from the By dropdown, select a commonly sorted column:
% of All Runtime,CPU Time,Contention Time,Execution Count,P99 Latency,Statement Time. To sort by other columns, selectMorefrom the dropdown and choose an option:Last Execution Time,Max Latency,Max Memory,Min Latency,Network,P50 Latency,P90 Latency,Retries,Rows Processed.
The
More options may increase the page loading time and are not generally recommended.- Select the Time Range.
- Click Apply. The list of statements that satisfy the search criteria is displayed. The results can be further searched and filtered.
Results are not automatically refreshed.The actual time range of the statistics is displayed at the top right of the results, for example,
Showing aggregated stats from 20:00 to 21:59 (UTC). If you select a preset time interval, such as Past Hour, be aware that since the statistics displayed are not automatically refreshed, they may become stale. To see the latest statistics, update the Search Criteria and apply.However, it may take up to 10 minutes for the most recent statistics to be included in the aggregated statistics. 10 minutes is the default for the sql.stats.flush.interval cluster setting. For in-memory statistics, directly query the following in-memory table: crdb_internal.cluster_statement_statistics. Alternatively, use the Active Executions view.Time interval
To view statement fingerprints within a specific time interval, select a time interval from the selector at the top of the tab. The time interval field supports preset time intervals (1 Hour, 6 Hours, 1 Day, etc.) and custom time intervals. To select a custom time interval, click the time interval field and select Custom time interval. In the Start (UTC) and End (UTC) fields select or type a date and time. Use the arrow buttons to cycle through previous and next time intervals. To select the most recent interval, click Now. When you select a time interval, the same interval is selected in the page. CockroachDB persists statement statistics up to 1 million rows before the oldest row is deleted. The retention period of statistics is reduced the more active a workload is and the more distinct statement fingerprints there are.It’s possible to select an interval for which no statement statistics exist.
Search and filter
By default, the Statements page shows SQL statements from all applications and databases running on the cluster.For the Statement Fingerprints view, the search and filter are applied after results are returned based on the Search Criteria.
Search results
To search using the search field:- Enter a string in the search box at the top of the tab. To search for exact terms in order, wrap the search string in quotes.
-
Press
Enter. The list of statements is filtered by the string.
Filter
To filter the statements:-
Click the Filters field.
-
To filter by , select App and select one or more applications.
- Queries from the SQL shell are displayed under the
$ cockroachapp. - If you haven’t set
application_namein a client connection string, it appears asunset.
- Queries from the SQL shell are displayed under the
- To filter by one or more databases (Database), SQL statement types (Statement Type), or nodes on which the statement ran (Node), click the field and select one or more checkboxes. The Statement Type values map to the CockroachDB statement types , , , and .
- To display only statement fingerprints that take longer than a specified time to run, specify the time and units.
- To display only statement fingerprints with queries that cause full table scans, click Only show statements that contain queries with full table scans.
-
To filter by , select App and select one or more applications.
- Click Apply.
rides for the movr application filtered by Statement Type: DML:
Statement statistics
Statistics aggregation is controlled by thesql.stats.aggregation.interval , set to 1 hour by default.
Aggregated statistics are flushed from memory to statistics tables in the system catalog every 10 minutes. The flushing interval is controlled by the sql.stats.flush.interval cluster setting.
The default retention period of the statistics tables is based on the number of rows up to 1 million records. When this threshold is reached, the oldest records are deleted. The diagnostics.forced_sql_stat_reset.interval controls when persisted statistics are deleted only if the internal cleanup service experiences a failure.
If desired, may reset SQL statistics in the DB Console UI and crdb_internal system catalog by clicking reset SQL stats. This link does not appear for non-admin users.
Example
See .SQL statement fingerprints
The Statements page displays SQL statement fingerprints. A statement fingerprint represents one or more SQL statements by replacing literal values (e.g., numbers and strings) with underscores (_). This can help you quickly identify frequently executed SQL statements and their latencies.
For multiple SQL statements to be represented by a fingerprint, they must be identical aside from their literal values and placeholders.
These SQL statements:
INSERT INTO new_order(product_id, customer_id, transaction_id) VALUES (380, 11, 11098)INSERT INTO new_order(product_id, customer_id, transaction_id) VALUES (192, 891, 20)INSERT INTO new_order(product_id, customer_id, transaction_id) VALUES (784, 452, 78)
INSERT INTO new_order(product_id, customer_id, transaction_id) VALUES (_, _, _)
These SQL statements:
INSERT INTO new_order(product_id, customer_id, transaction_id) VALUES ($1, $2, 11098)INSERT INTO new_order(product_id, customer_id, transaction_id) VALUES ($3, $4, 300)
INSERT INTO new_order(product_id, customer_id, transaction_id) VALUES ($1, $1, _).
The following statements are not represented by either fingerprint:
INSERT INTO new_order(product_id, customer_id, transaction_id) VALUES ($1, 11, 11098)INSERT INTO new_order(product_id, customer_id, transaction_id) VALUES ($1, $2, $3)
- Statements with this fingerprint were executed by more than one .
- Statements with this fingerprint were executed both successfully and unsuccessfully.
Statements table
Click Columns to select the columns to display in the table. The Statements table gives details for each SQL statement fingerprint:| Column | Description |
|---|---|
| Statements | SQL statement fingerprint. To view additional details, click the SQL statement fingerprint to open its . Statement fingerprints are displayed per application rather than grouped into a single fingerprint. This may result in multiple rows for the same statement fingerprint, one per application name. |
| Execution Count | Cumulative number of executions of statements with this fingerprint within the time interval. The bar indicates the ratio of runtime success (gray) to (red) for the SQL statement fingerprint. |
| Database | The database in which the statement was executed. |
| Application Name | The name specified by the session setting. |
| Statement Time | Average of statements with this statement fingerprint within the time interval. The gray bar indicates the mean latency. The blue bar indicates one standard deviation from the mean. Hover over the bar to display exact values. |
| % of All Runtime | The percentage of execution time taken by this statement fingerprint compared to all other statements executed within the time period, including those not displayed. Runtime is calculated as the mean execution latency multiplied by the execution count. Note: The sum of the values in this column may not equal 100%. Each fingerprint’s percentage is calculated by dividing the fingerprint’s runtime by the sum of the runtimes for all statement fingerprints in the time interval. “All statement fingerprints” means all user statement fingerprints (not only those displayed by the search criteria), as well as internal statement fingerprints that are never included in the displayed result set. The search criteria are applied after the % of All Runtime calculation. |
| Contention Time | Average time statements with this fingerprint were with other transactions within the time interval. The gray bar indicates mean contention time. The blue bar indicates one standard deviation from the mean. Hover over the bar to display exact values. |
| CPU Time | Average CPU time spent executing within the specified time interval. The gray bar indicates mean CPU time. The blue bar indicates one standard deviation from the mean. The CPU time includes time spent in the . It does not include time spent in the . |
| P50 Latency | The 50th latency percentile for sampled statement executions with this fingerprint. Note: Latency percentiles are calculated from a different set of executions than other statistics, so they may be inconsistent with the minimum, maximum, and average values. This data is provided for reference only. |
| P90 Latency | The 90th latency percentile for sampled statement executions with this fingerprint. Note: Latency percentiles are calculated from a different set of executions than other statistics, so they may be inconsistent with the minimum, maximum, and average values. This data is provided for reference only. |
| P99 Latency | The 99th latency percentile for sampled statement executions with this fingerprint. Note: Latency percentiles are calculated from a different set of executions than other statistics, so they may be inconsistent with the minimum, maximum, and average values. This data is provided for reference only. |
| Min Latency | The lowest latency value for all statement executions with this fingerprint. |
| Max Latency | The highest latency value for all statement executions with this fingerprint. |
| Rows Processed | Average number of rows read and written while executing statements with this fingerprint within the time interval. |
| Bytes Read | Aggregation of all bytes across all operators for statements with this fingerprint within the time interval. The gray bar indicates the mean number of bytes read from disk. The blue bar indicates one standard deviation from the mean. Hover over the bar to display exact values. |
| Max Memory | Maximum memory used by a statement with this fingerprint at any time during its execution within the time interval. The gray bar indicates the average max memory usage. The blue bar indicates one standard deviation from the mean. Hover over the bar to display exact values. |
| Network | Amount of for statements with this fingerprint within the time interval. If this value is 0, the statement was executed on a single node. The gray bar indicates the mean number of bytes sent over the network. The blue bar indicates one standard deviation from the mean. Hover over the bar to display exact values. |
| Retries | Cumulative number of automatic (internal) by CockroachDB of statements with this fingerprint within the time interval. |
| Regions/Nodes | The regions and nodes on which statements with this fingerprint executed. Nodes are not visible for CockroachDB Serverless clusters or for clusters that are not multi-region. |
| Last Execution Time (UTC) | The timestamp when the statement was last executed. |
| Statement Fingerprint ID | The ID of the statement fingerprint. |
| Diagnostics | Activate and download diagnostics for this fingerprint. To activate, click the Activate button. The Activate statement diagnostics dialog displays. After you complete the dialog, the column displays the status of diagnostics collection (WAITING, READY, or ERROR). Click Statements are periodically cleared from the Statements page based on the start time. To access the full history of diagnostics for the fingerprint, see the Diagnostics tab of the Statement Details page. Diagnostics is not visible for CockroachDB Serverless clusters. |
To obtain the execution statistics, CockroachDB samples a percentage of the executions. If you see
no samples displayed in the Contention, Max Memory, or Network columns, there are two possibilities:- Your statement executed successfully but wasn’t sampled because there were too few executions of the statement.
- Your statement has failed (the most likely case). You can confirm by clicking the statement and viewing the value for Failed?.
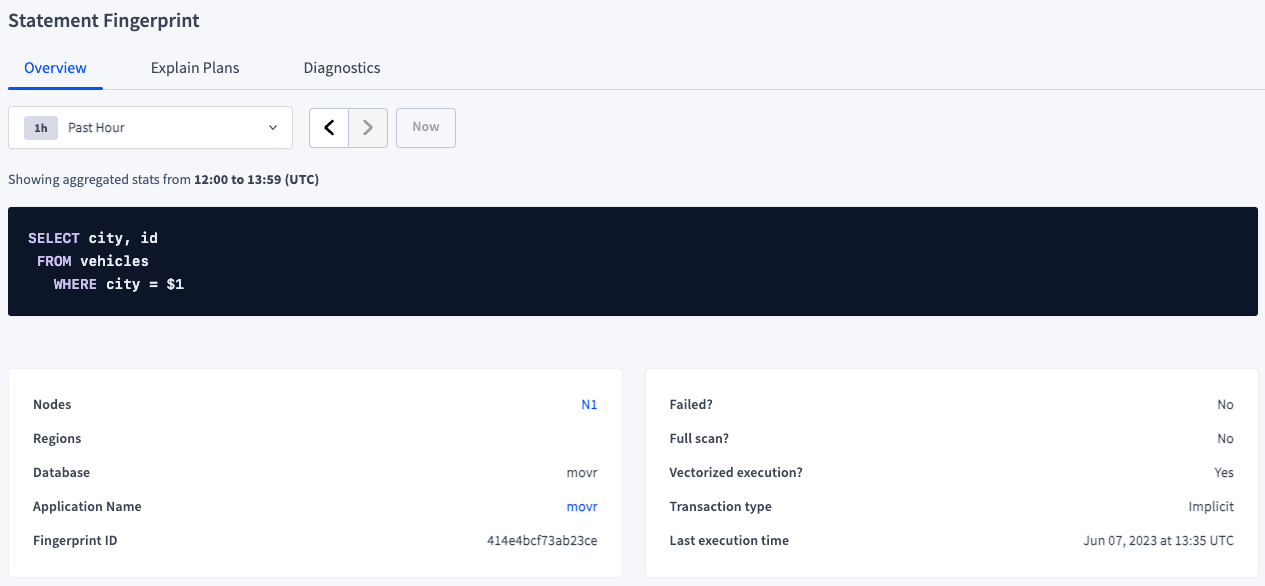
Statement Fingerprint page
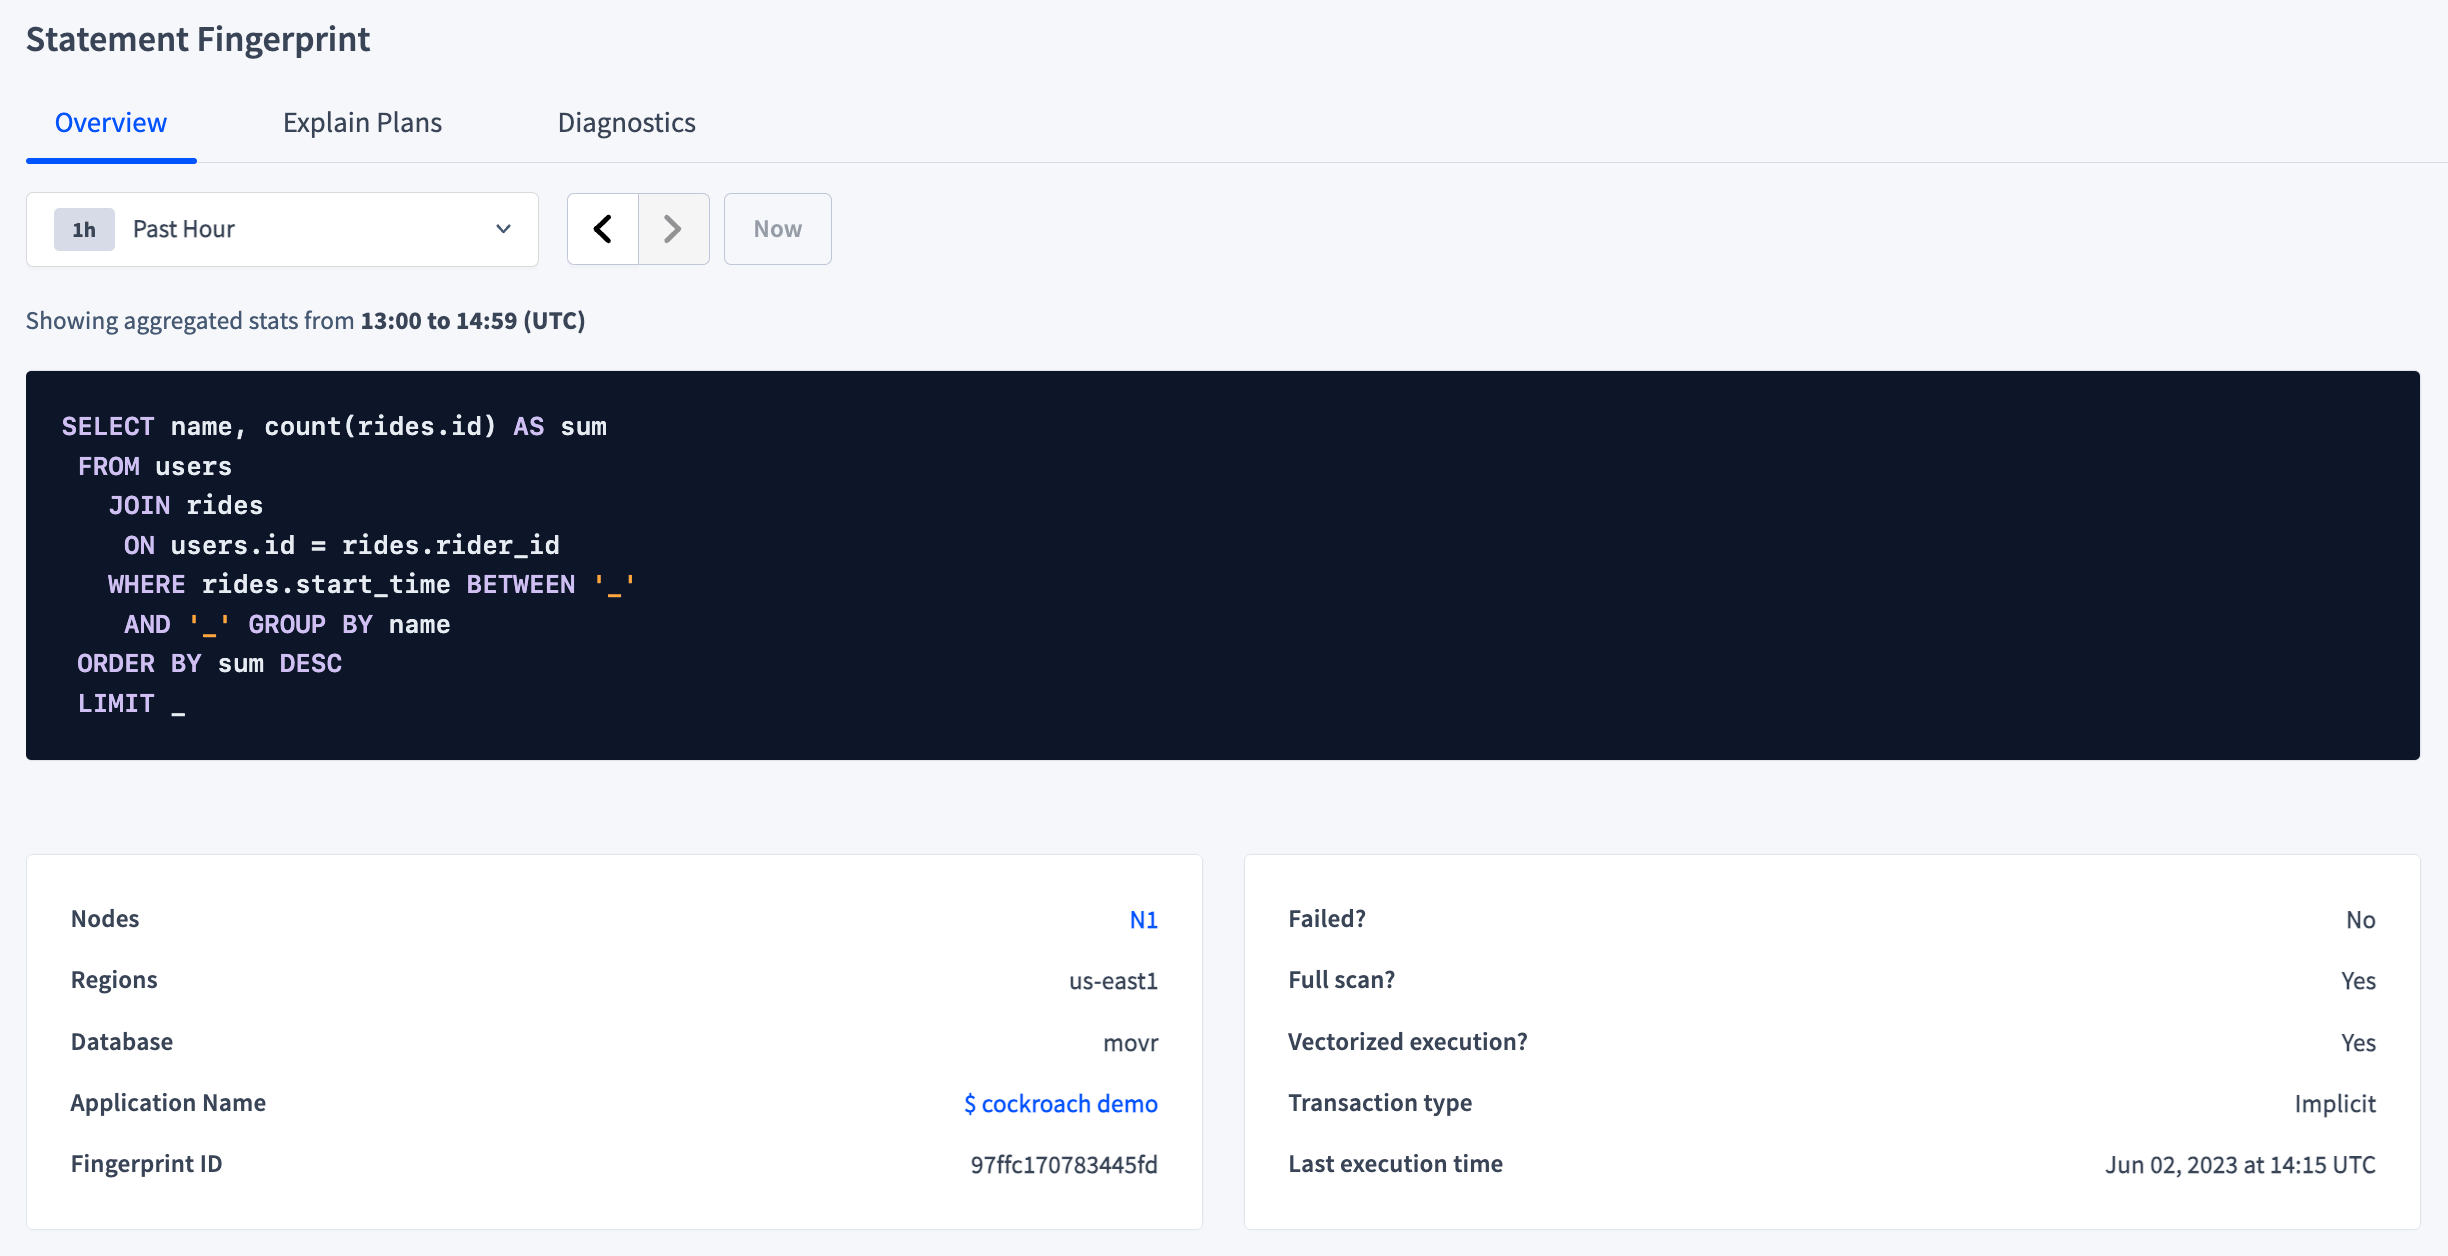
The details displayed on the Statement Fingerprint page reflect the time interval selected on the Statements page and the application name and database specified in the selected row of the Statements table.Overview
The Overview section displays the SQL statement fingerprint and execution attributes:- Nodes: The nodes on which the statements executed. Click a node ID to view node statistics. Nodes are not displayed for CockroachDB Serverless clusters.
- Regions: The regions on which the statements executed. Regions are not displayed for CockroachDB Serverless clusters.
- Database: The database on which the statements executed.
- Application Name: The name specified by the session setting. Click the name to view all statements run by that application.
- Failed?: Whether the statement failed to execute.
- Full scan?: Whether the execution performed a full scan of the table.
- Vectorized execution?: Whether the execution used the .
- Transaction type: The type of transaction ( or ).
- Last execution time: The timestamp when the statement was last executed.
- Fingerprint ID: The ID of the statement fingerprint in hexadecimal format. It may be used to query the table.
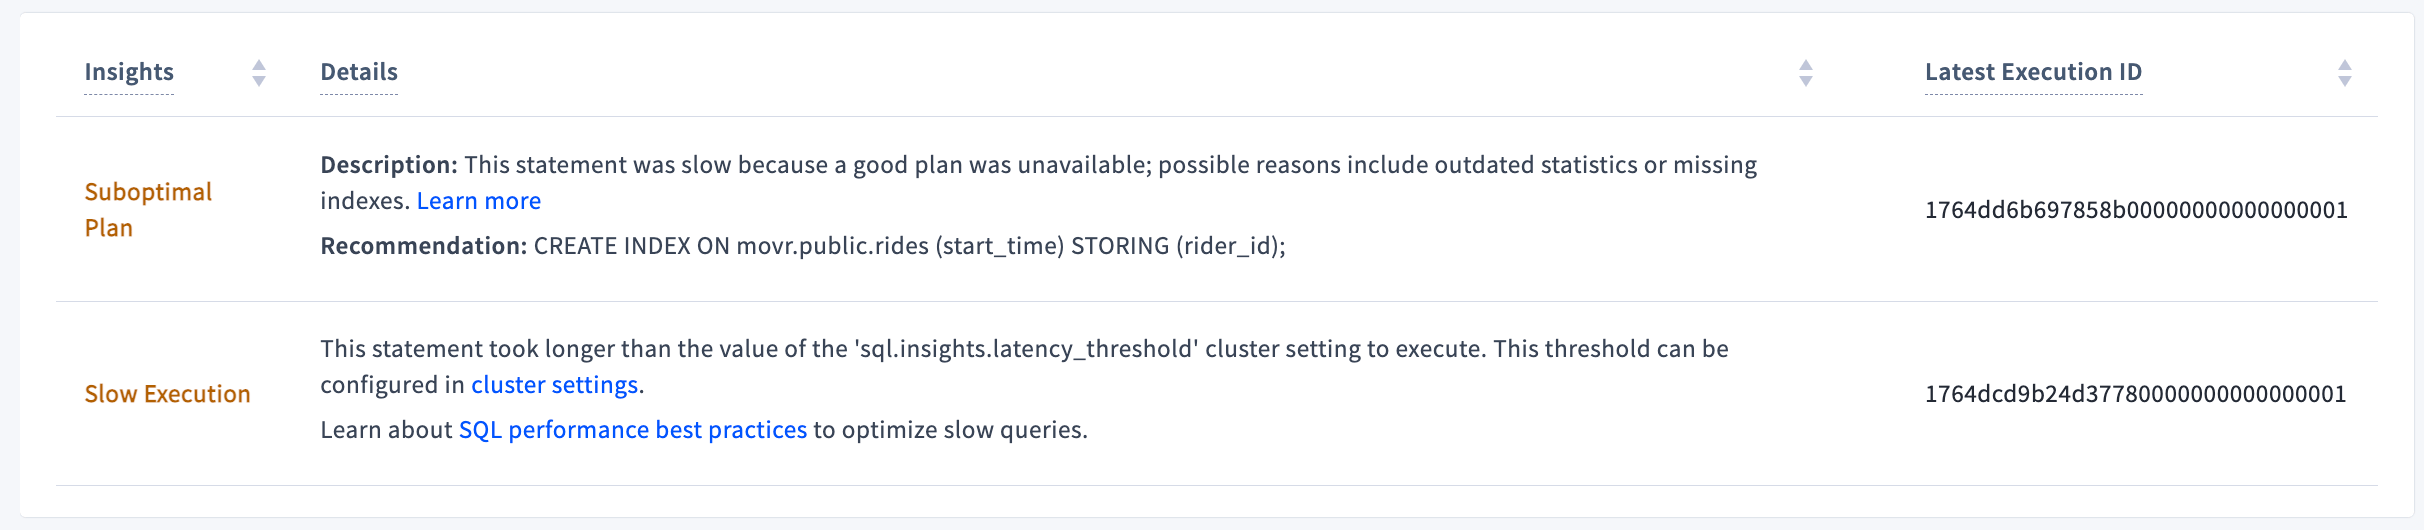
Insights
The Insights table is displayed when CockroachDB has detected a problem with the statement fingerprint.- Insights: Provides the .
- Details: Provides a description and possible recommendation.
- Latest Execution ID: The ID of the latest statement execution. To display the details of the , click the ID.
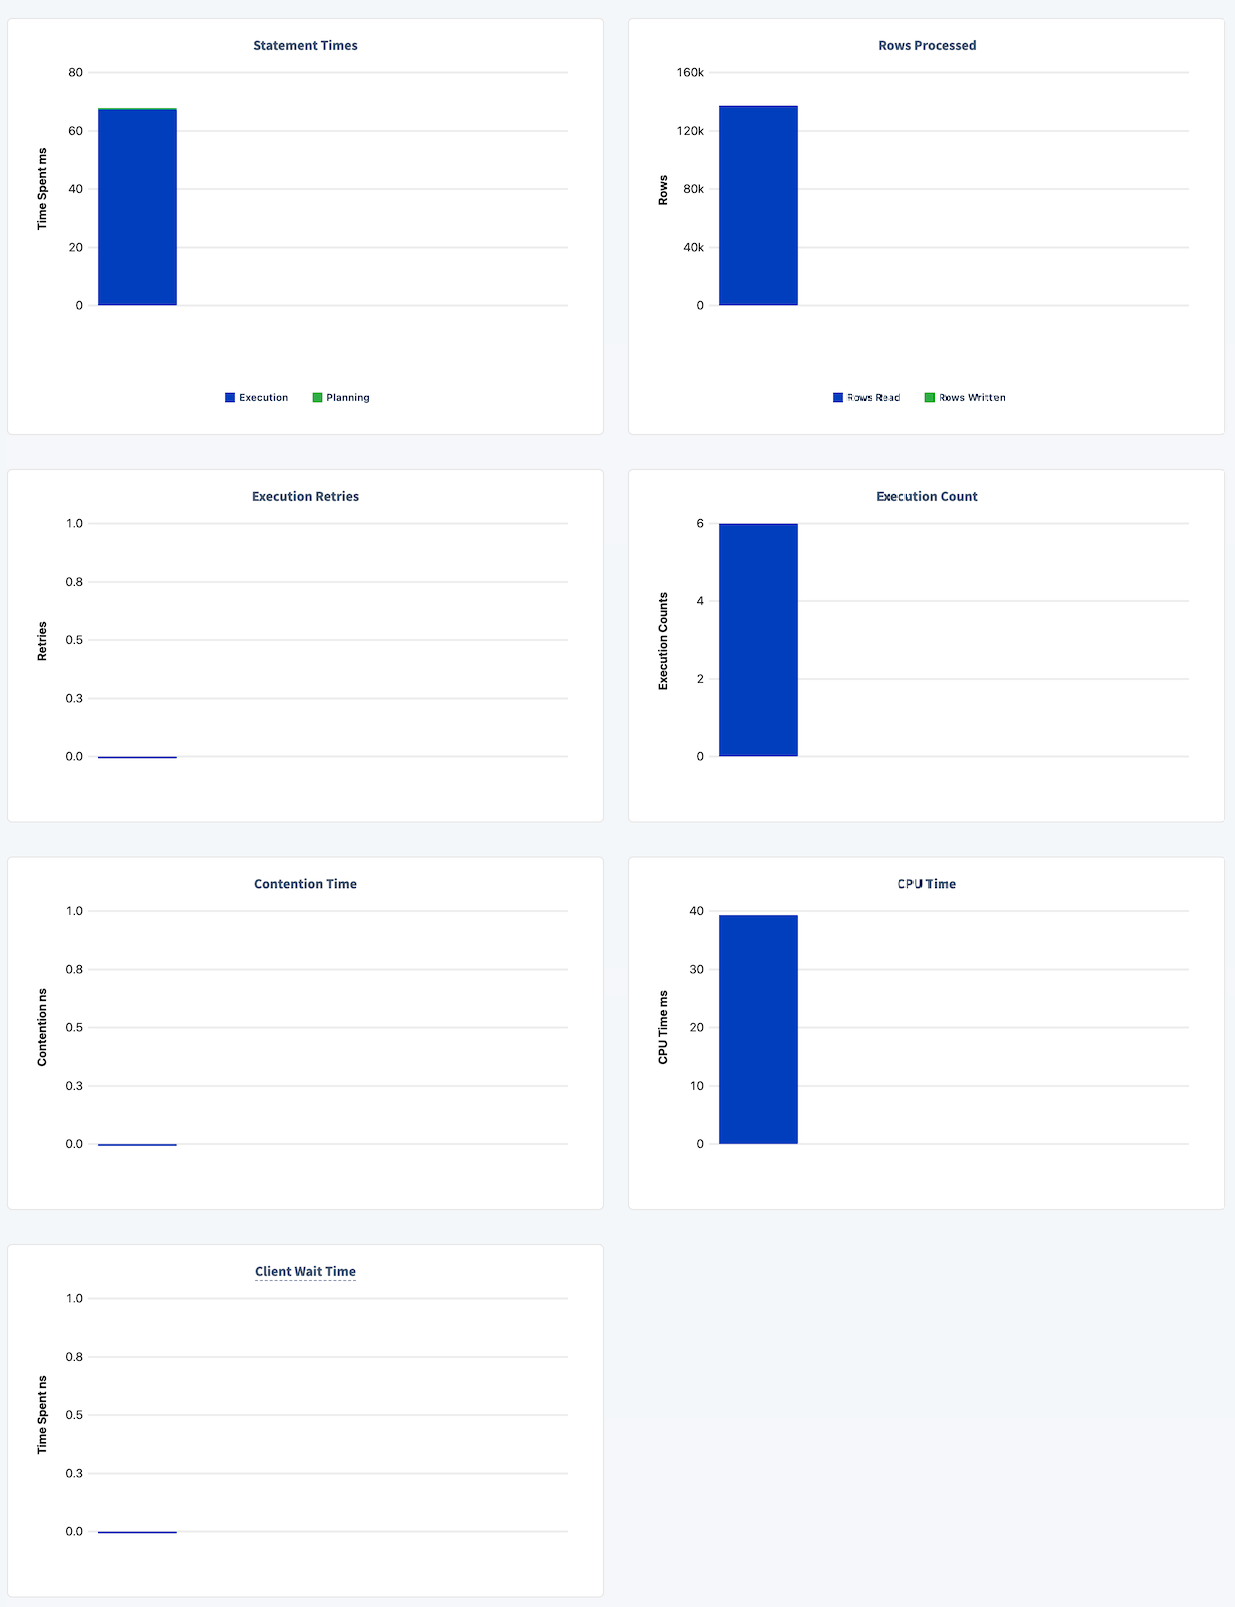
Charts
Charts following the execution attributes display statement fingerprint statistics:- Statement Time: The time taken by the to create an execution plan and for CockroachDB to execute statements.
- Rows Processed: The total number of rows read and written.
- Execution Retries: The number of .
- Execution Count: The total number of executions. It is calculated as the sum of first attempts and retries.
- Contention Time: The amount of time spent waiting for resources. For more information about contention, see .
- CPU Time: The amount of CPU time spent executing the statement. The CPU time represents the time spent and work done within SQL execution operators.
- Client Wait Time: The time spent waiting for the client to send the statement while holding the transaction open. A high wait time indicates that you should revisit the entire transaction and .
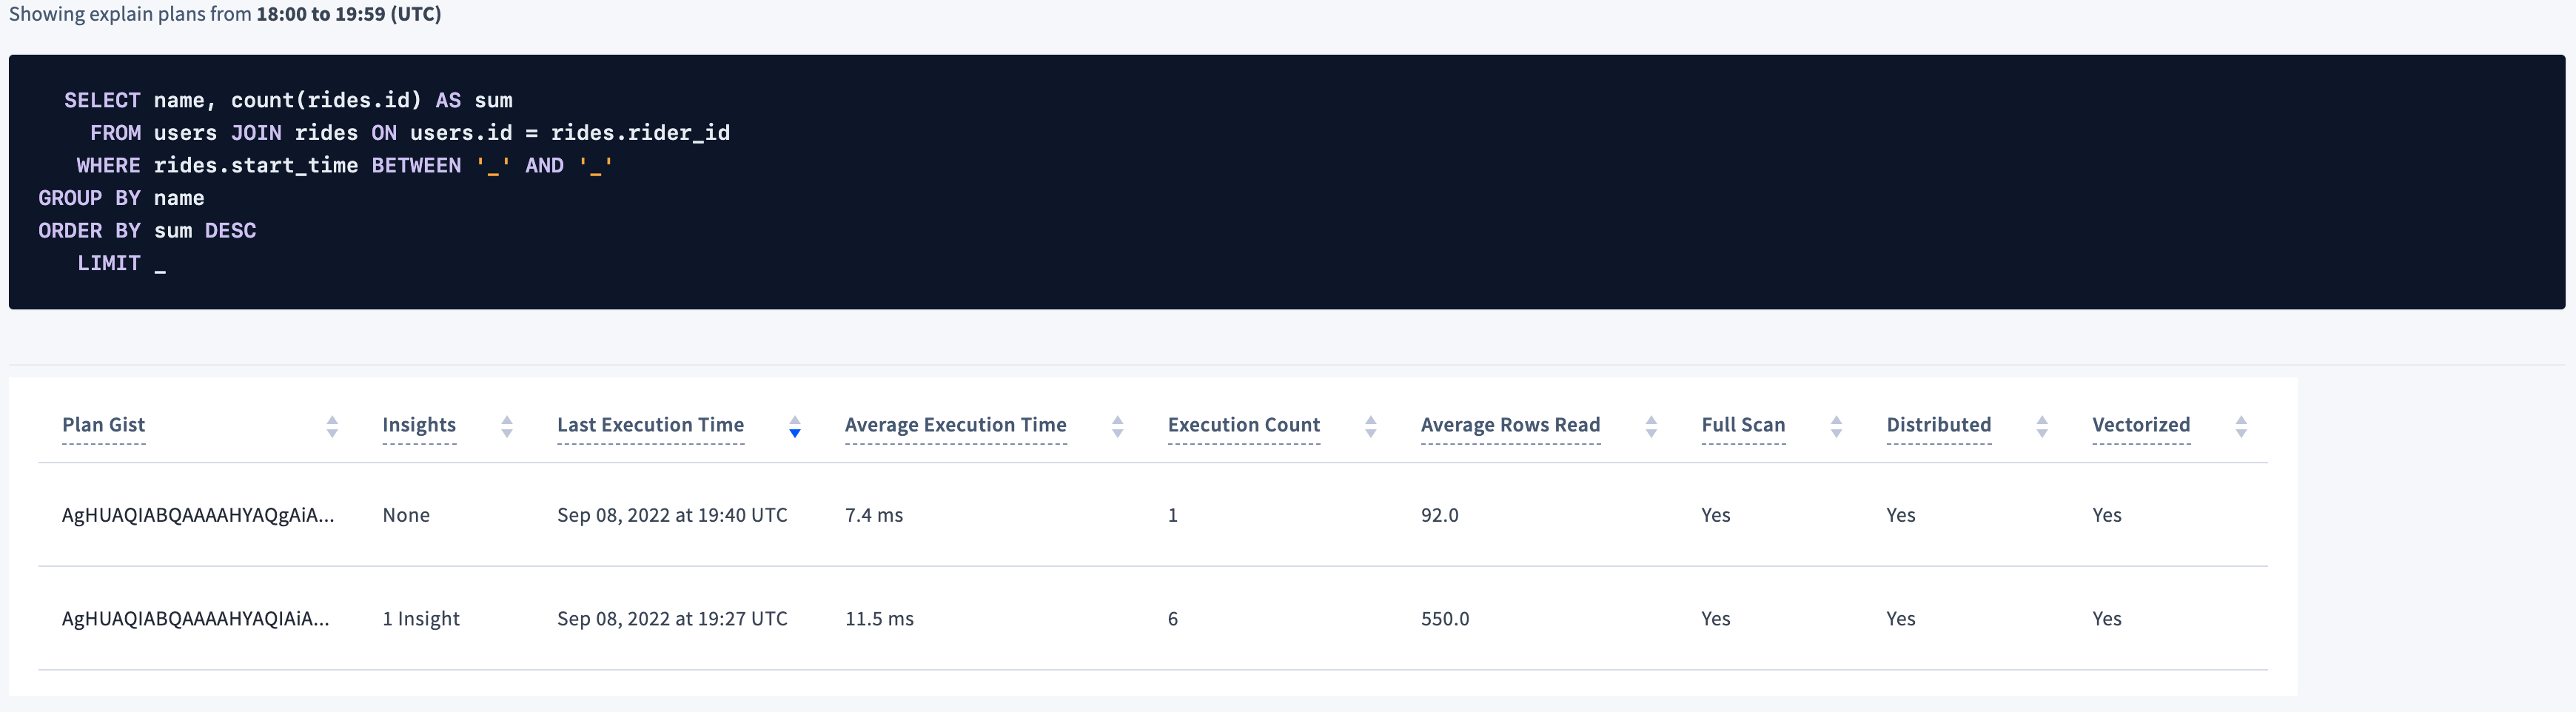
Explain Plans
The Explain Plans tab displays statement plans for an in the selected time interval. You can use this information to optimize the query. For more information about plans, see . The following screenshot shows an execution of the query discussed in Overview: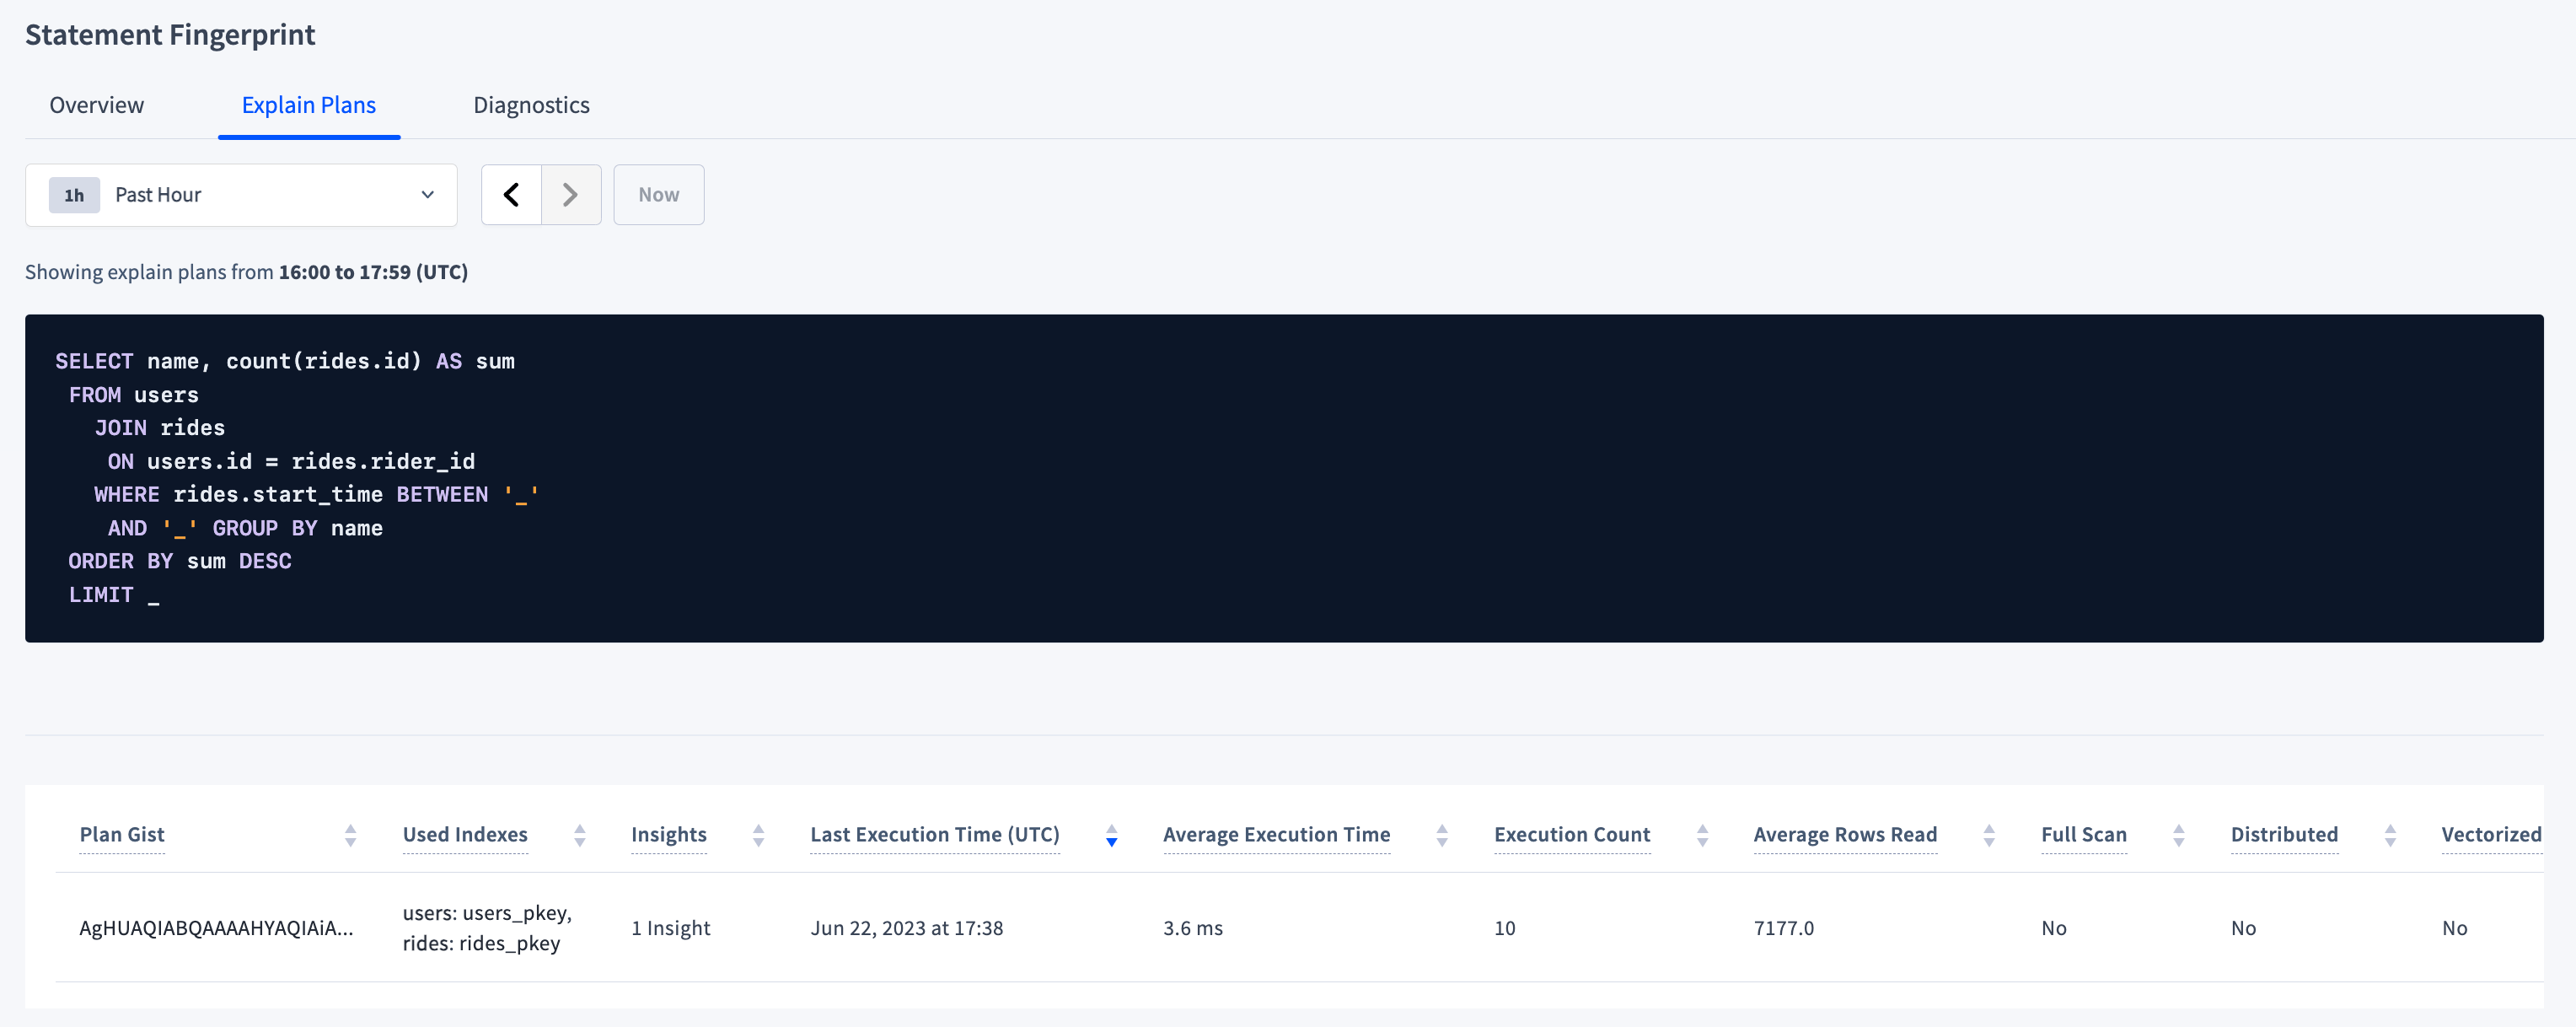
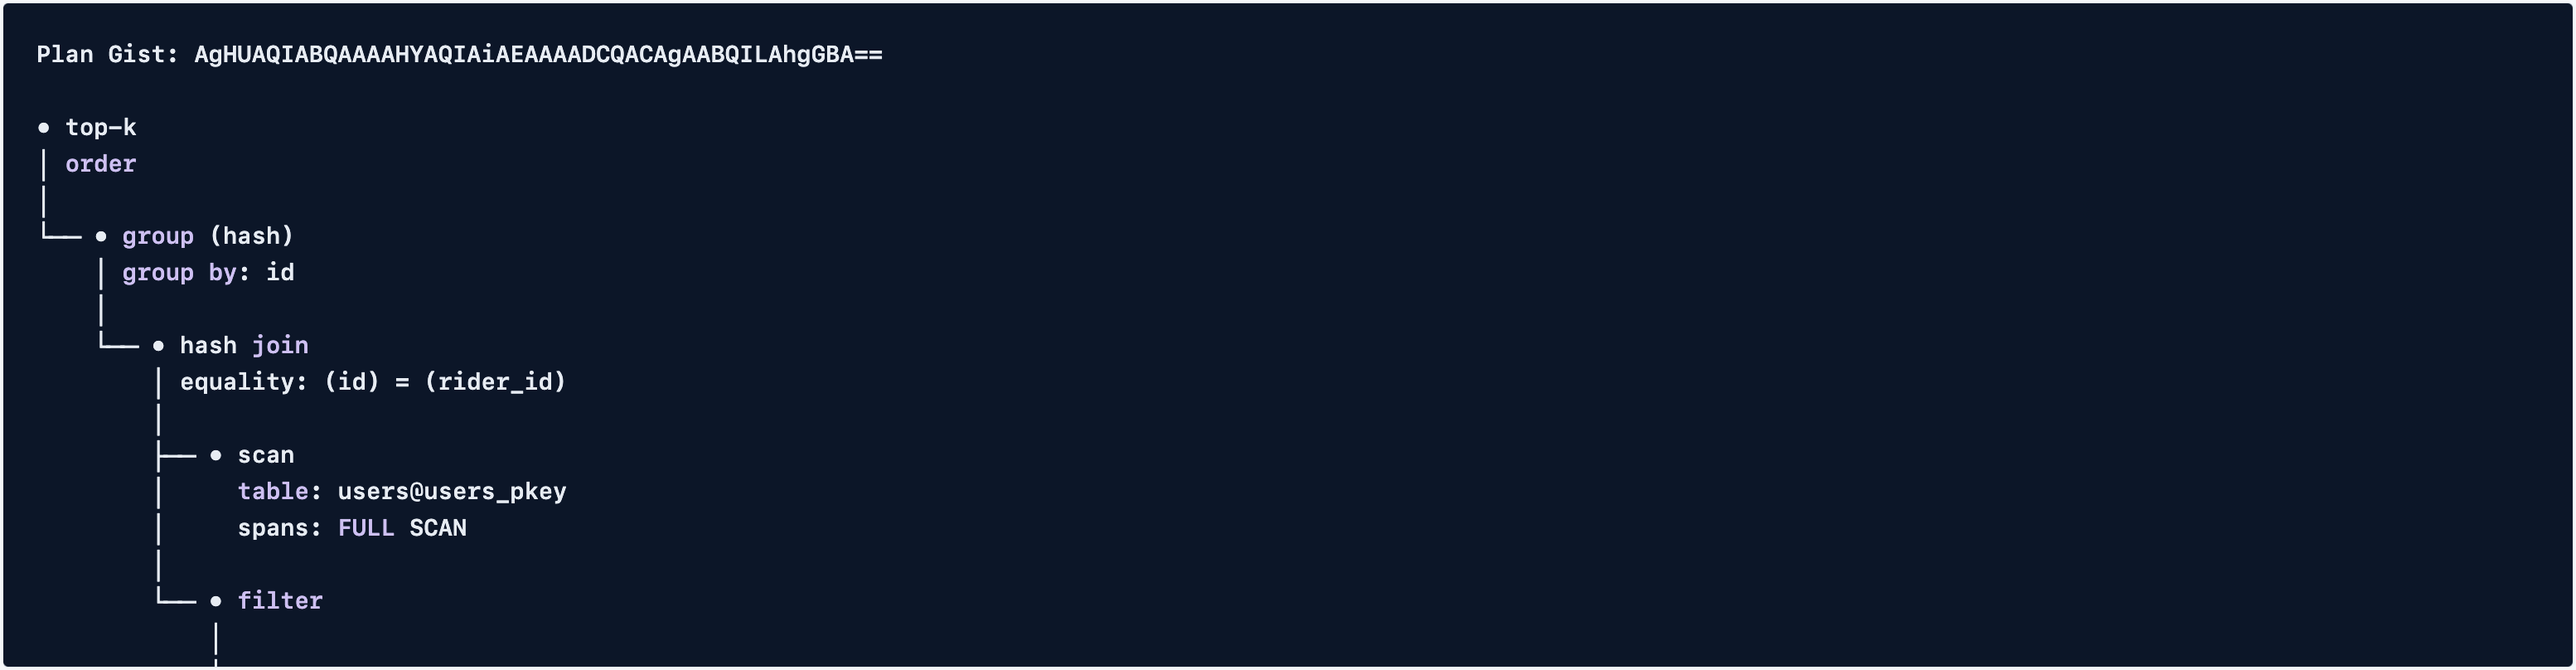
To display the plan that was executed, click the plan gist. For the plan gist
AgHUAQIABQAAAAHYAQIAiA..., the following plan displays:
Insights
The plan table displays the number of insights related to the plan. If a plan has at least 1 insight, when you click the plan gist, a table of insights that describe how to improve the performance will follow the plan. The following screenshot shows 1 insight found after running the query discussed in Overview 6 or more times: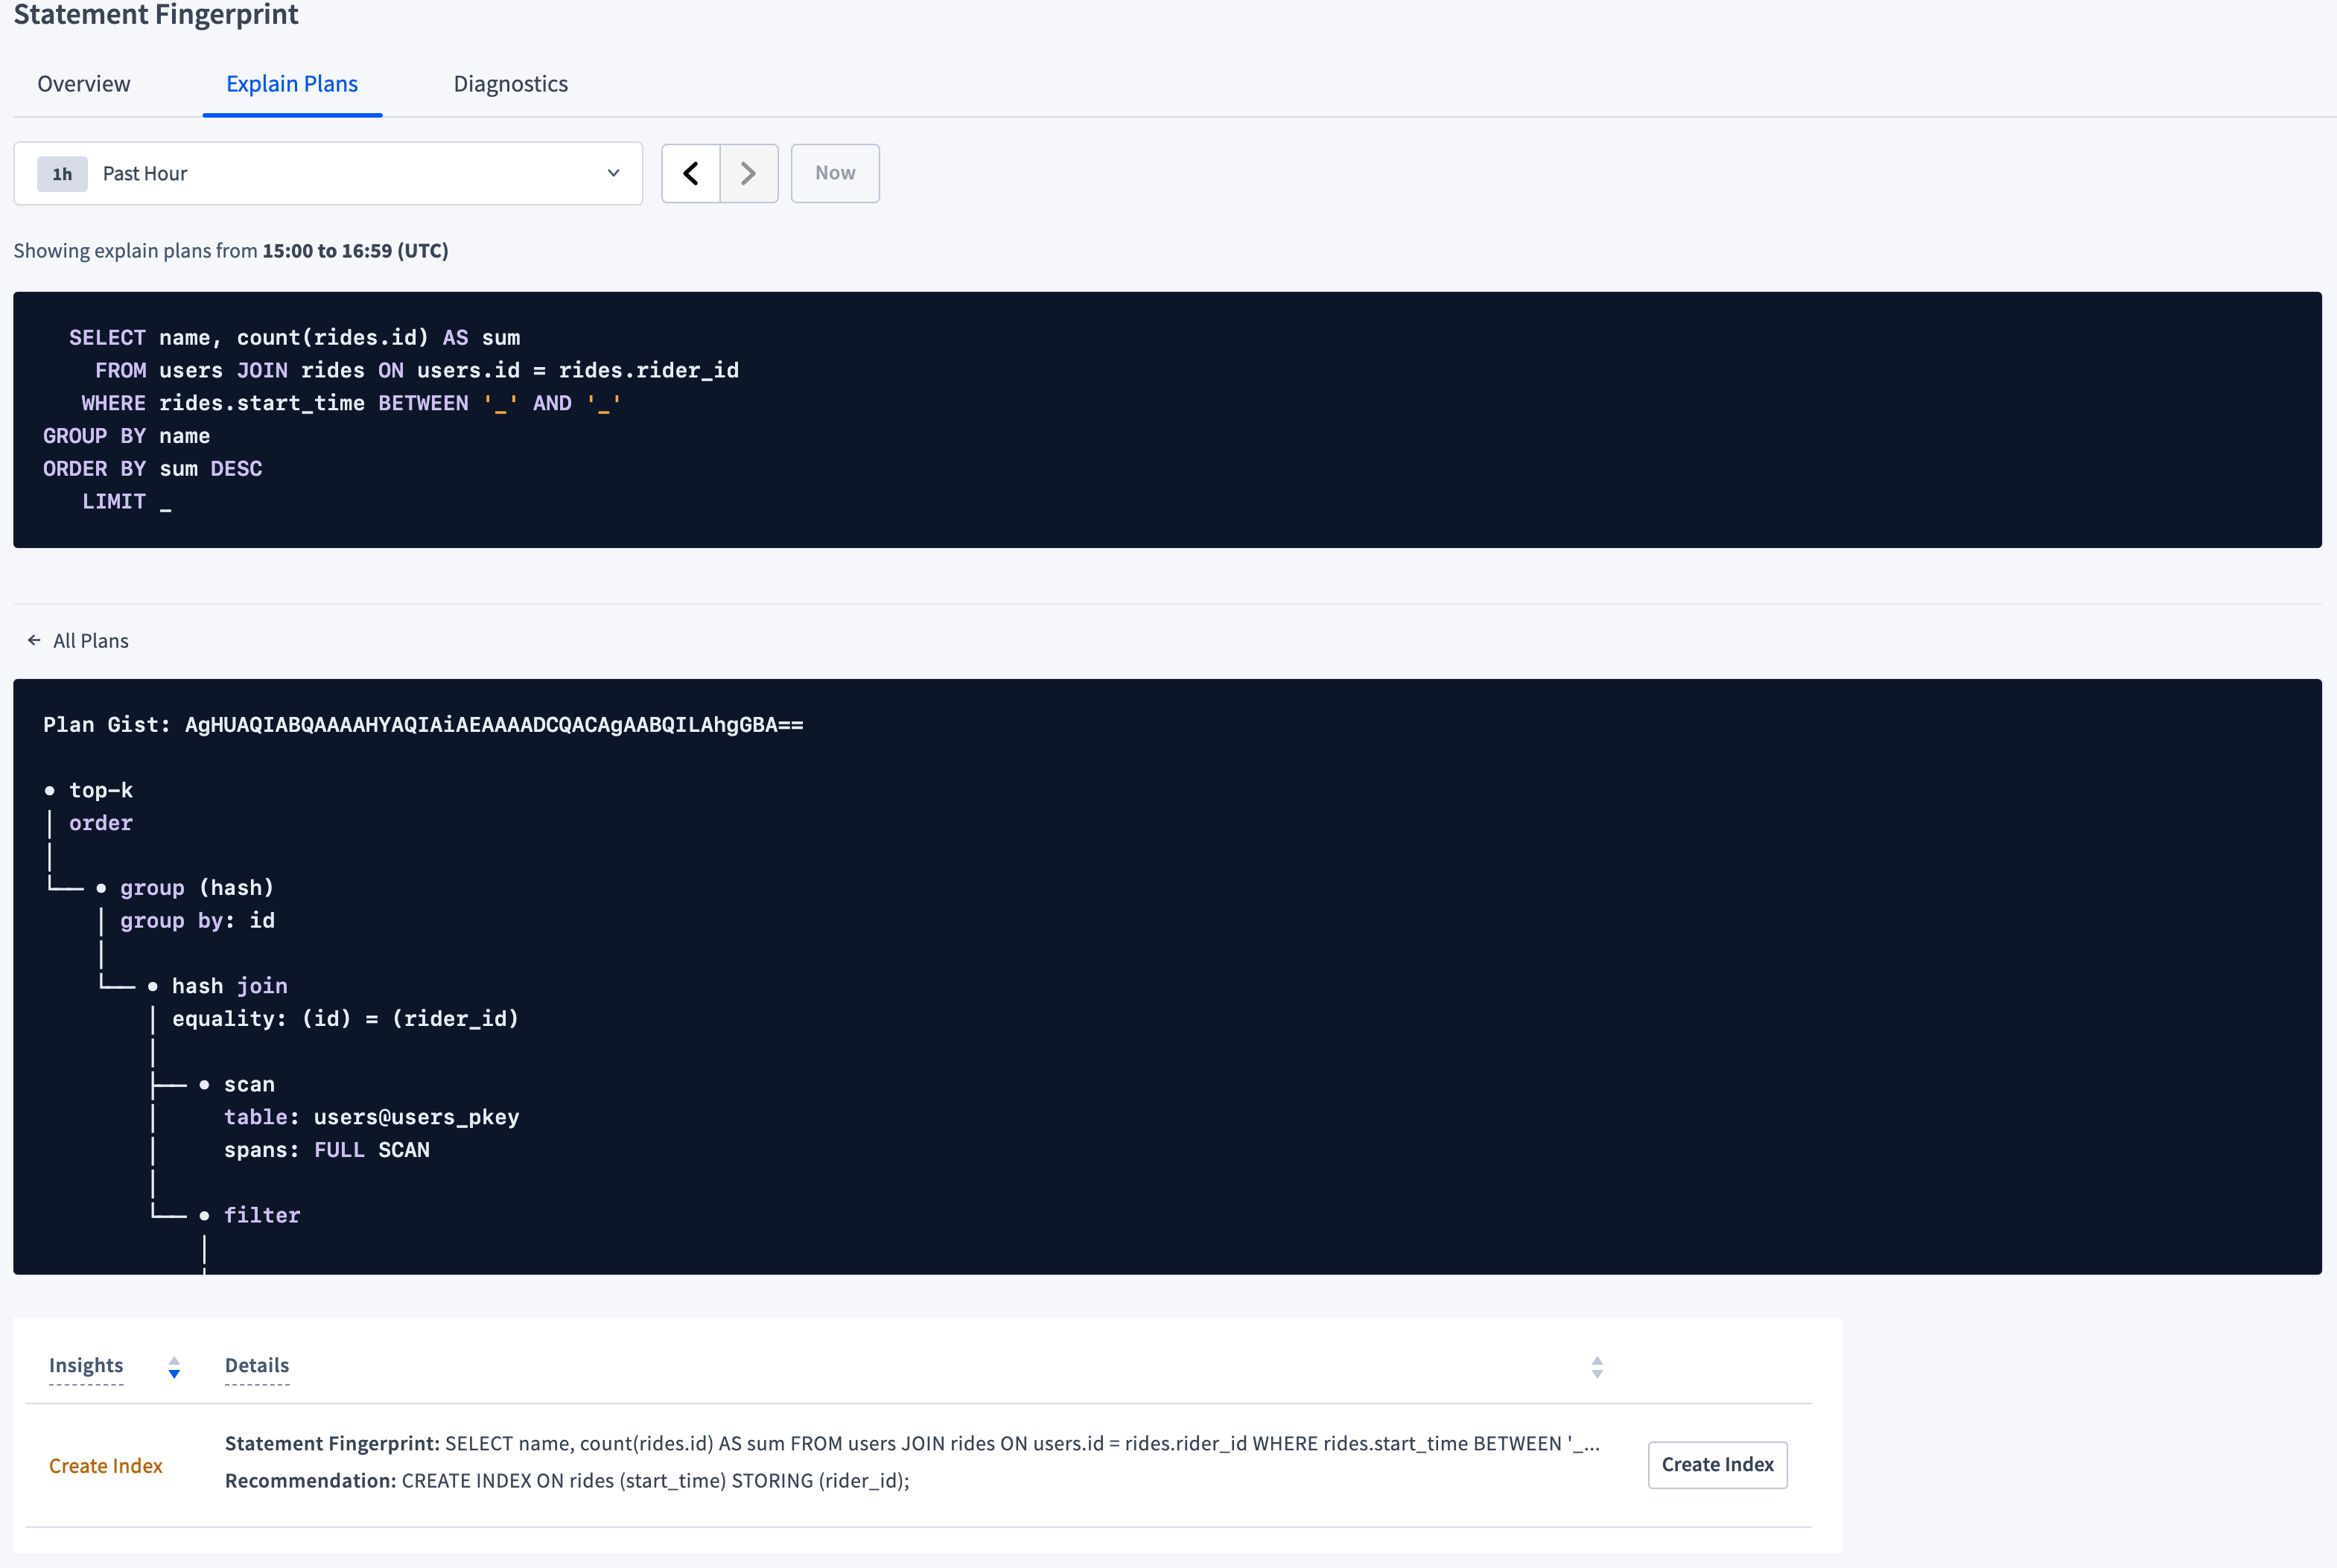
CockroachDB uses the threshold of 6 executions before offering an insight because it assumes that you are no longer merely experimenting with a query at that point.
start_time column of the rides table and storing the rider_id.
If you click Create Index, a confirmation dialog displays a warning about the cost of and a button to copy the SQL statement for later execution in a SQL client.
If you click Apply to create the index and then execute the statement again, the Explain Plans tab will show that the second execution (in this case at 19:40), which uses the index and has no insight, takes less time than the first 6 executions.
Diagnostics
The Diagnostics tab allows you to activate and download diagnostics for a SQL statement fingerprint.The Diagnostics tab is not visible:
- On CockroachDB Serverless clusters.
- For roles with the
VIEWACTIVITYREDACTED(or the legacyVIEWACTIVITYREDACTED) defined.
In CockroachDB v24.3.1 and later,
admin users or SQL users with the VIEWACTIVITY system privilege can choose to redact user data from the Activate statement diagnostics dialog.
To allow or disallow a role from seeing statements diagnostics bundles, set the
VIEWACTIVITYREDACTED role option.
In CockroachDB v21.2.x, v22.1.0 to v22.1.16, v22.2.0 to v22.2.6, non-admin SQL users with an authenticated HTTP session could download statement diagnostic bundles given a bundle URL from the DB Console or the
EXPLAIN ANALYZE (DEBUG) statement with a valid HTTP session cookie. This has been resolved in v22.1.17 and v22.2.7. For more information, see the Technical Advisory A99049.
Activate diagnostics collection and download bundles
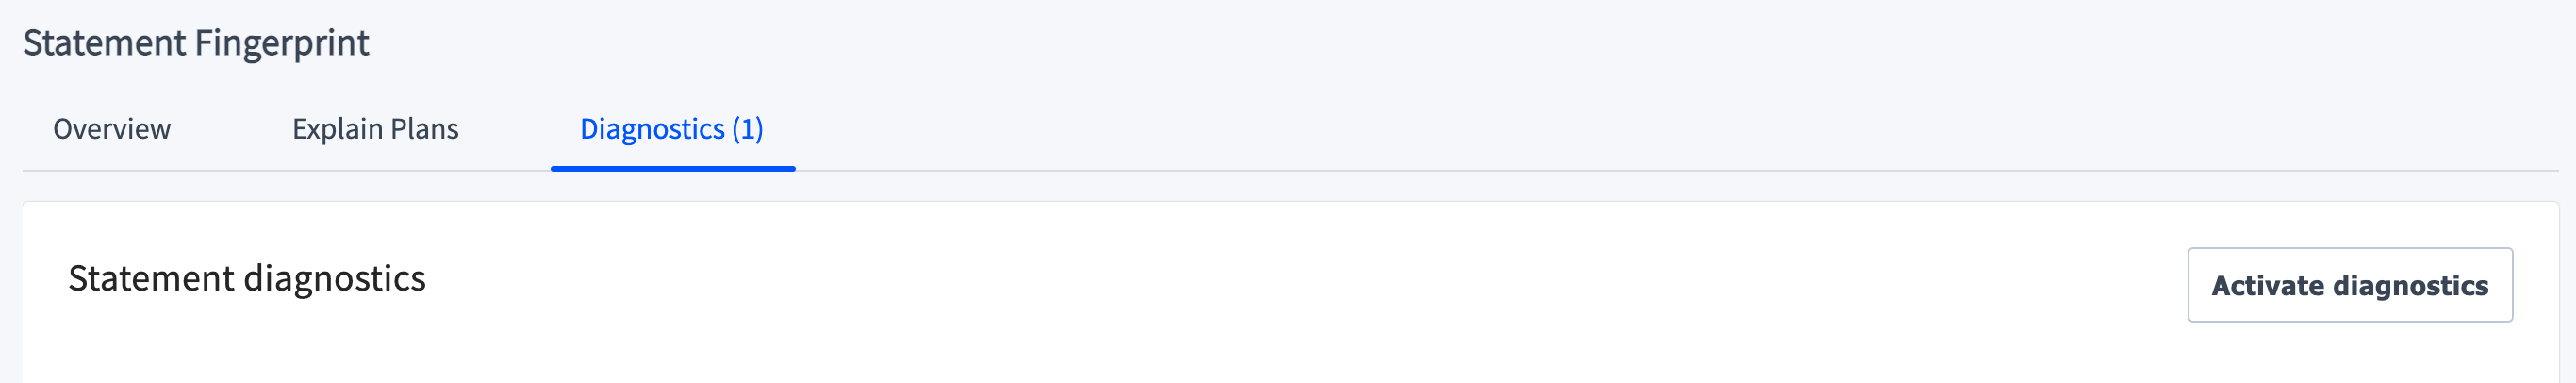
Collecting diagnostics has an impact on performance. All executions of the statement fingerprint will run slower until diagnostics are collected.
- Click the Activate diagnostics button. The Activate statement diagnostics dialog displays.
-
Choose whether to:
- trace and collect diagnostics at the default sampled rate of 1% (or specify a different rate) when the statement execution latency exceeds the default time of 100 milliseconds (or specify a different time), or
- trace and collect diagnostics on the next statement execution.
- Choose whether the request should expire after 15 minutes, or after a different time, or disable automatic expiration by deselecting the checkbox. Executions of the same statement fingerprint will run slower while diagnostics are activated, so it is recommended to set an expiration time if collecting according to a latency threshold.
- Click Activate.
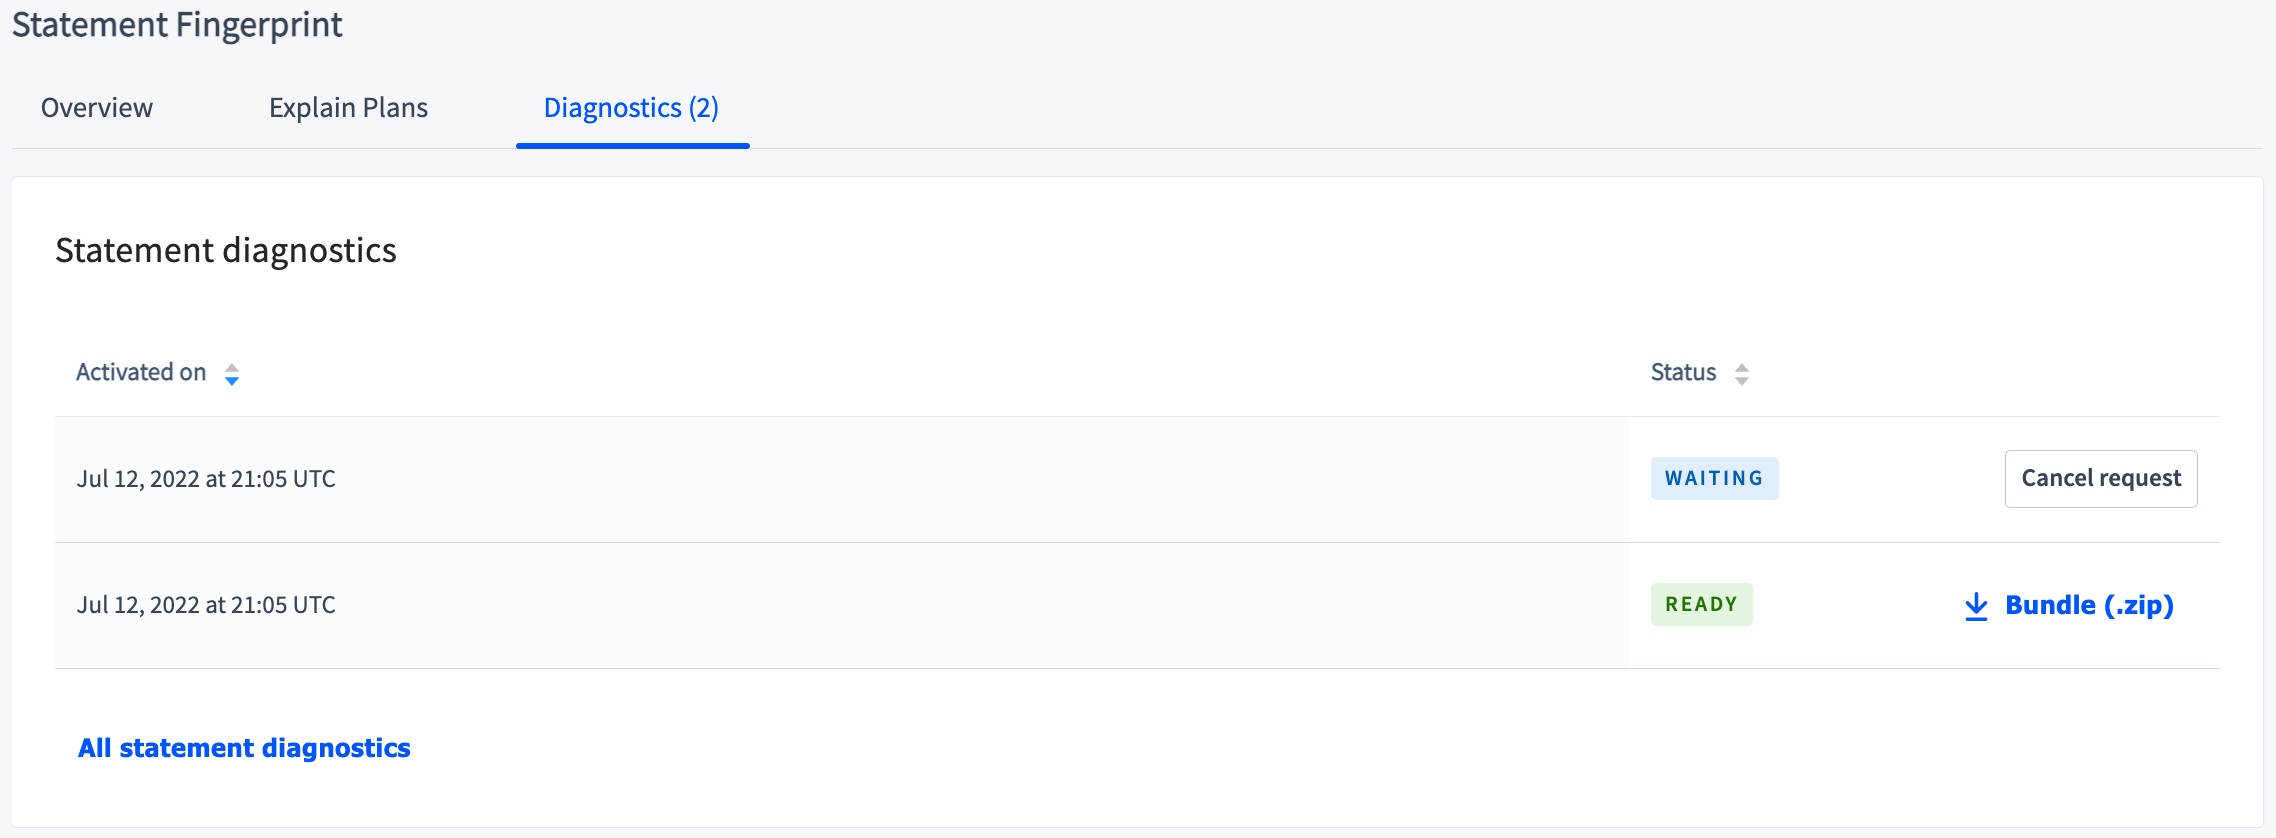
- READY: indicates that the diagnostics have been collected. To download the diagnostics bundle, click
 Bundle (.zip).
 - WAITING: indicates that a SQL statement matching the fingerprint has not yet been recorded. To cancel diagnostics collection, click the Cancel request button.
- ERROR: indicates that the attempt at diagnostics collection failed.
View and download diagnostic bundles for all statement fingerprints
Although fingerprints are periodically cleared from the Statements page, all diagnostics bundles are preserved. To view and download diagnostic bundles for all statement fingerprints, do one of the following:- On the Diagnostics tab for a statement fingerprint, click the All statement diagnostics link.
- Click Advanced Debug in the left-hand navigation and click .
Active Executions table
Click Columns to select the columns to display in the table.
To view details of an active statement execution, click an execution ID in the Statement Execution ID column to open the Statement Execution details page.
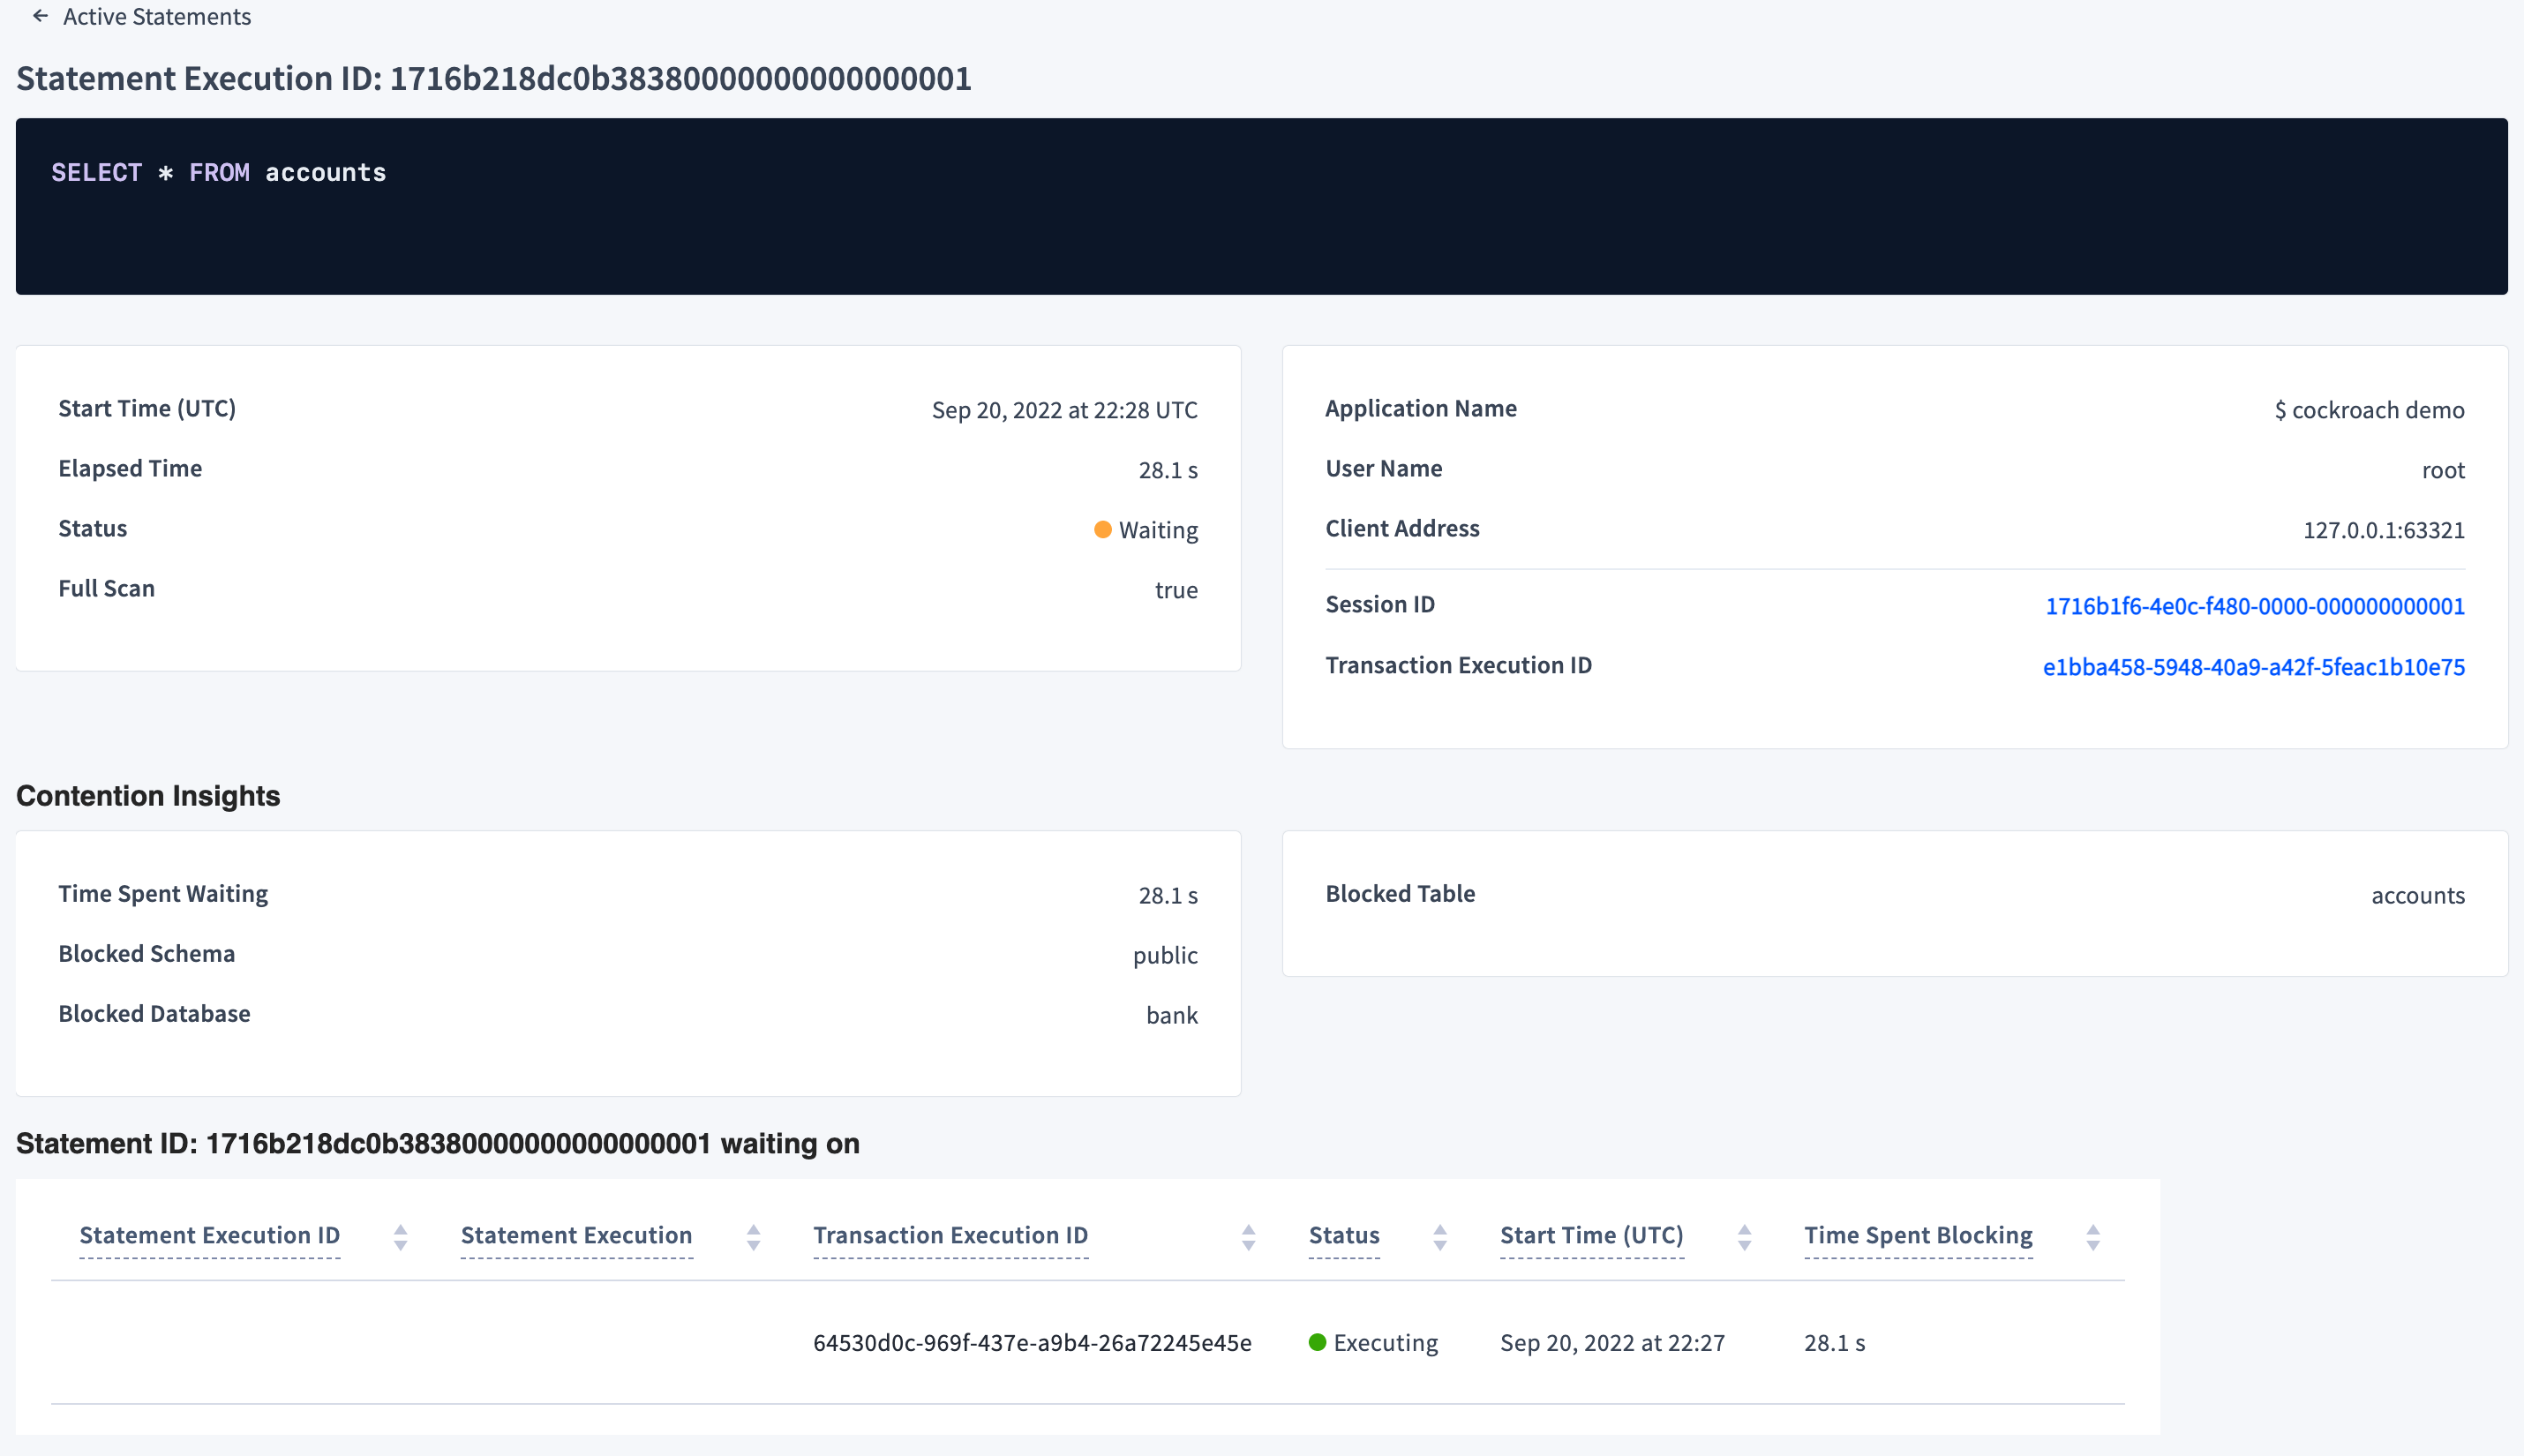
Statement execution details page
The statement execution details page provides the following details on the statement execution.- Start Time (UTC): The timestamp when the execution started.
- Elapsed Time: The time elapsed since the execution started.
- Status: The status of the execution:
Preparing,Waiting, orExecuting. - Full Scan: Whether the execution performed a full scan of the table.
- Application Name: The name specified by the session setting.
- User Name: The name of the user running the statement.
- Client Address: The IP address and port of the client that opened the session in which the statement is running.
- Session ID: Link to the in which the transaction is running.
- Transaction Execution ID: Link to the ID of the in which the statement is executing.