
If a SQL statement returns an unexpected result or takes longer than expected to process, this page will help you troubleshoot the issue.
For a developer-centric tutorial of optimizing SQL query performance, see Optimize Statement Performance.
Identify slow statements
Use the slow query log or DB Console to detect slow queries in your cluster.
High latency SQL statements are displayed on the Statements page of the DB Console. To view the Statements page, access the DB Console and click Statements on the left.
You can also check the service latency graph and the CPU graph on the SQL and Hardware Dashboards, respectively. If the graphs show latency spikes or CPU usage spikes, these might indicate slow queries in your cluster.
Visualize statement traces in Jaeger
You can look more closely at the behavior of a statement by visualizing a statement trace in Jaeger. A statement trace contains messages and timing information from all nodes involved in the execution.
Activate statement diagnostics on the DB Console Statements Page or run
EXPLAIN ANALYZE (DEBUG)to obtain a diagnostics bundle for the statement.Start Jaeger:
docker run -d --name jaeger -p 16686:16686 jaegertracing/all-in-one:1.17
Access the Jaeger UI at
http://localhost:16686/search.Click on JSON File in the Jaeger UI and upload
trace-jaeger.jsonfrom the diagnostics bundle. The trace will appear in the list on the right.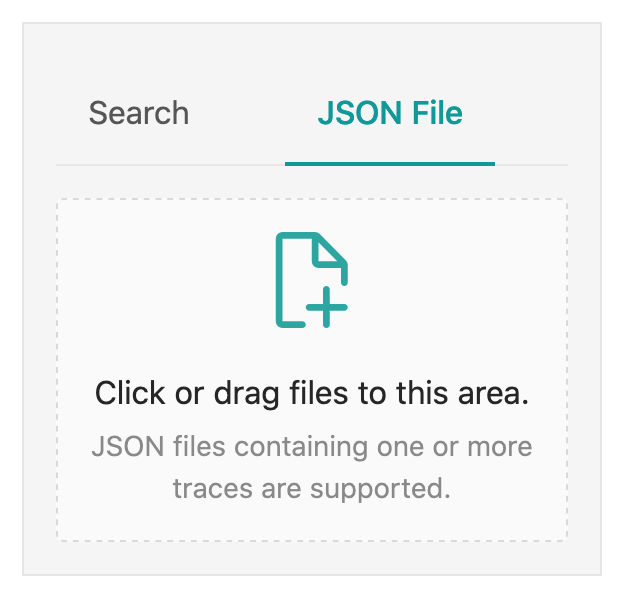
Click on the trace to view its details. It is visualized as a collection of spans with timestamps. These may include operations executed by different nodes.
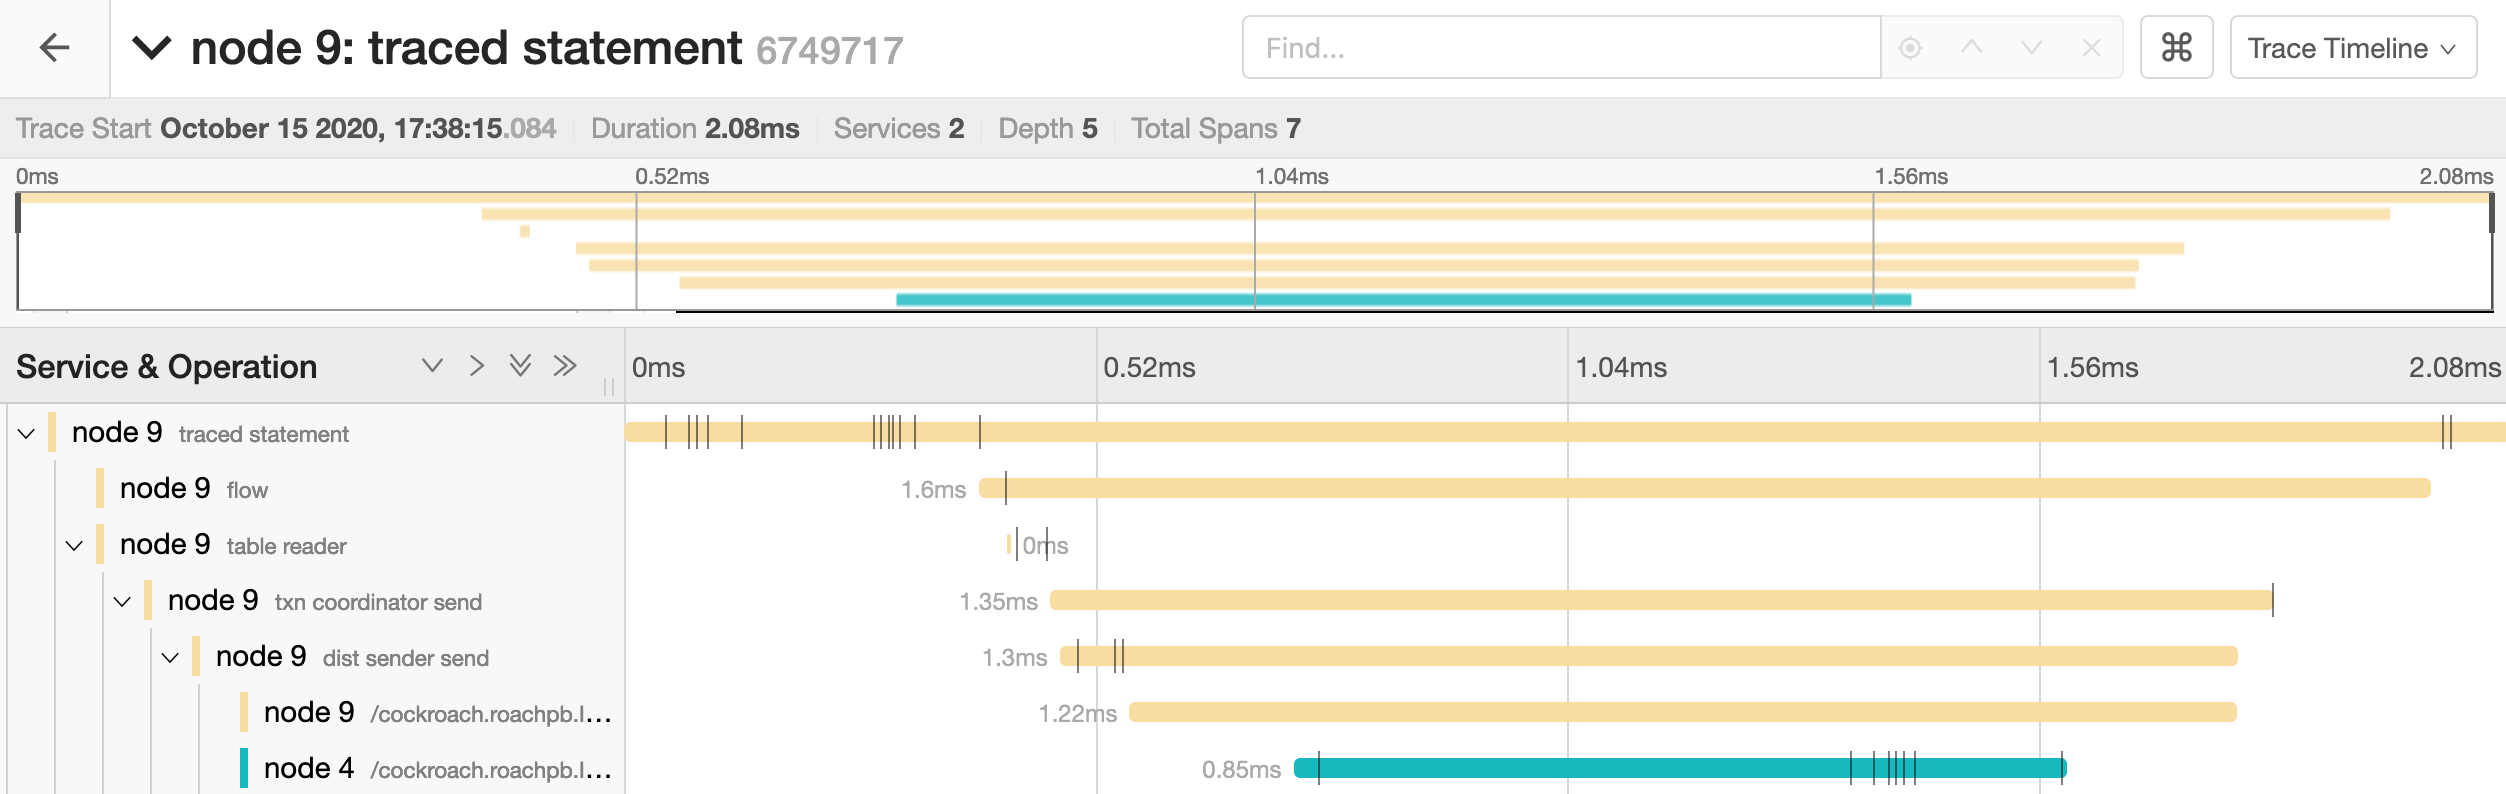
The full timeline displays the execution time and execution phases for the statement.
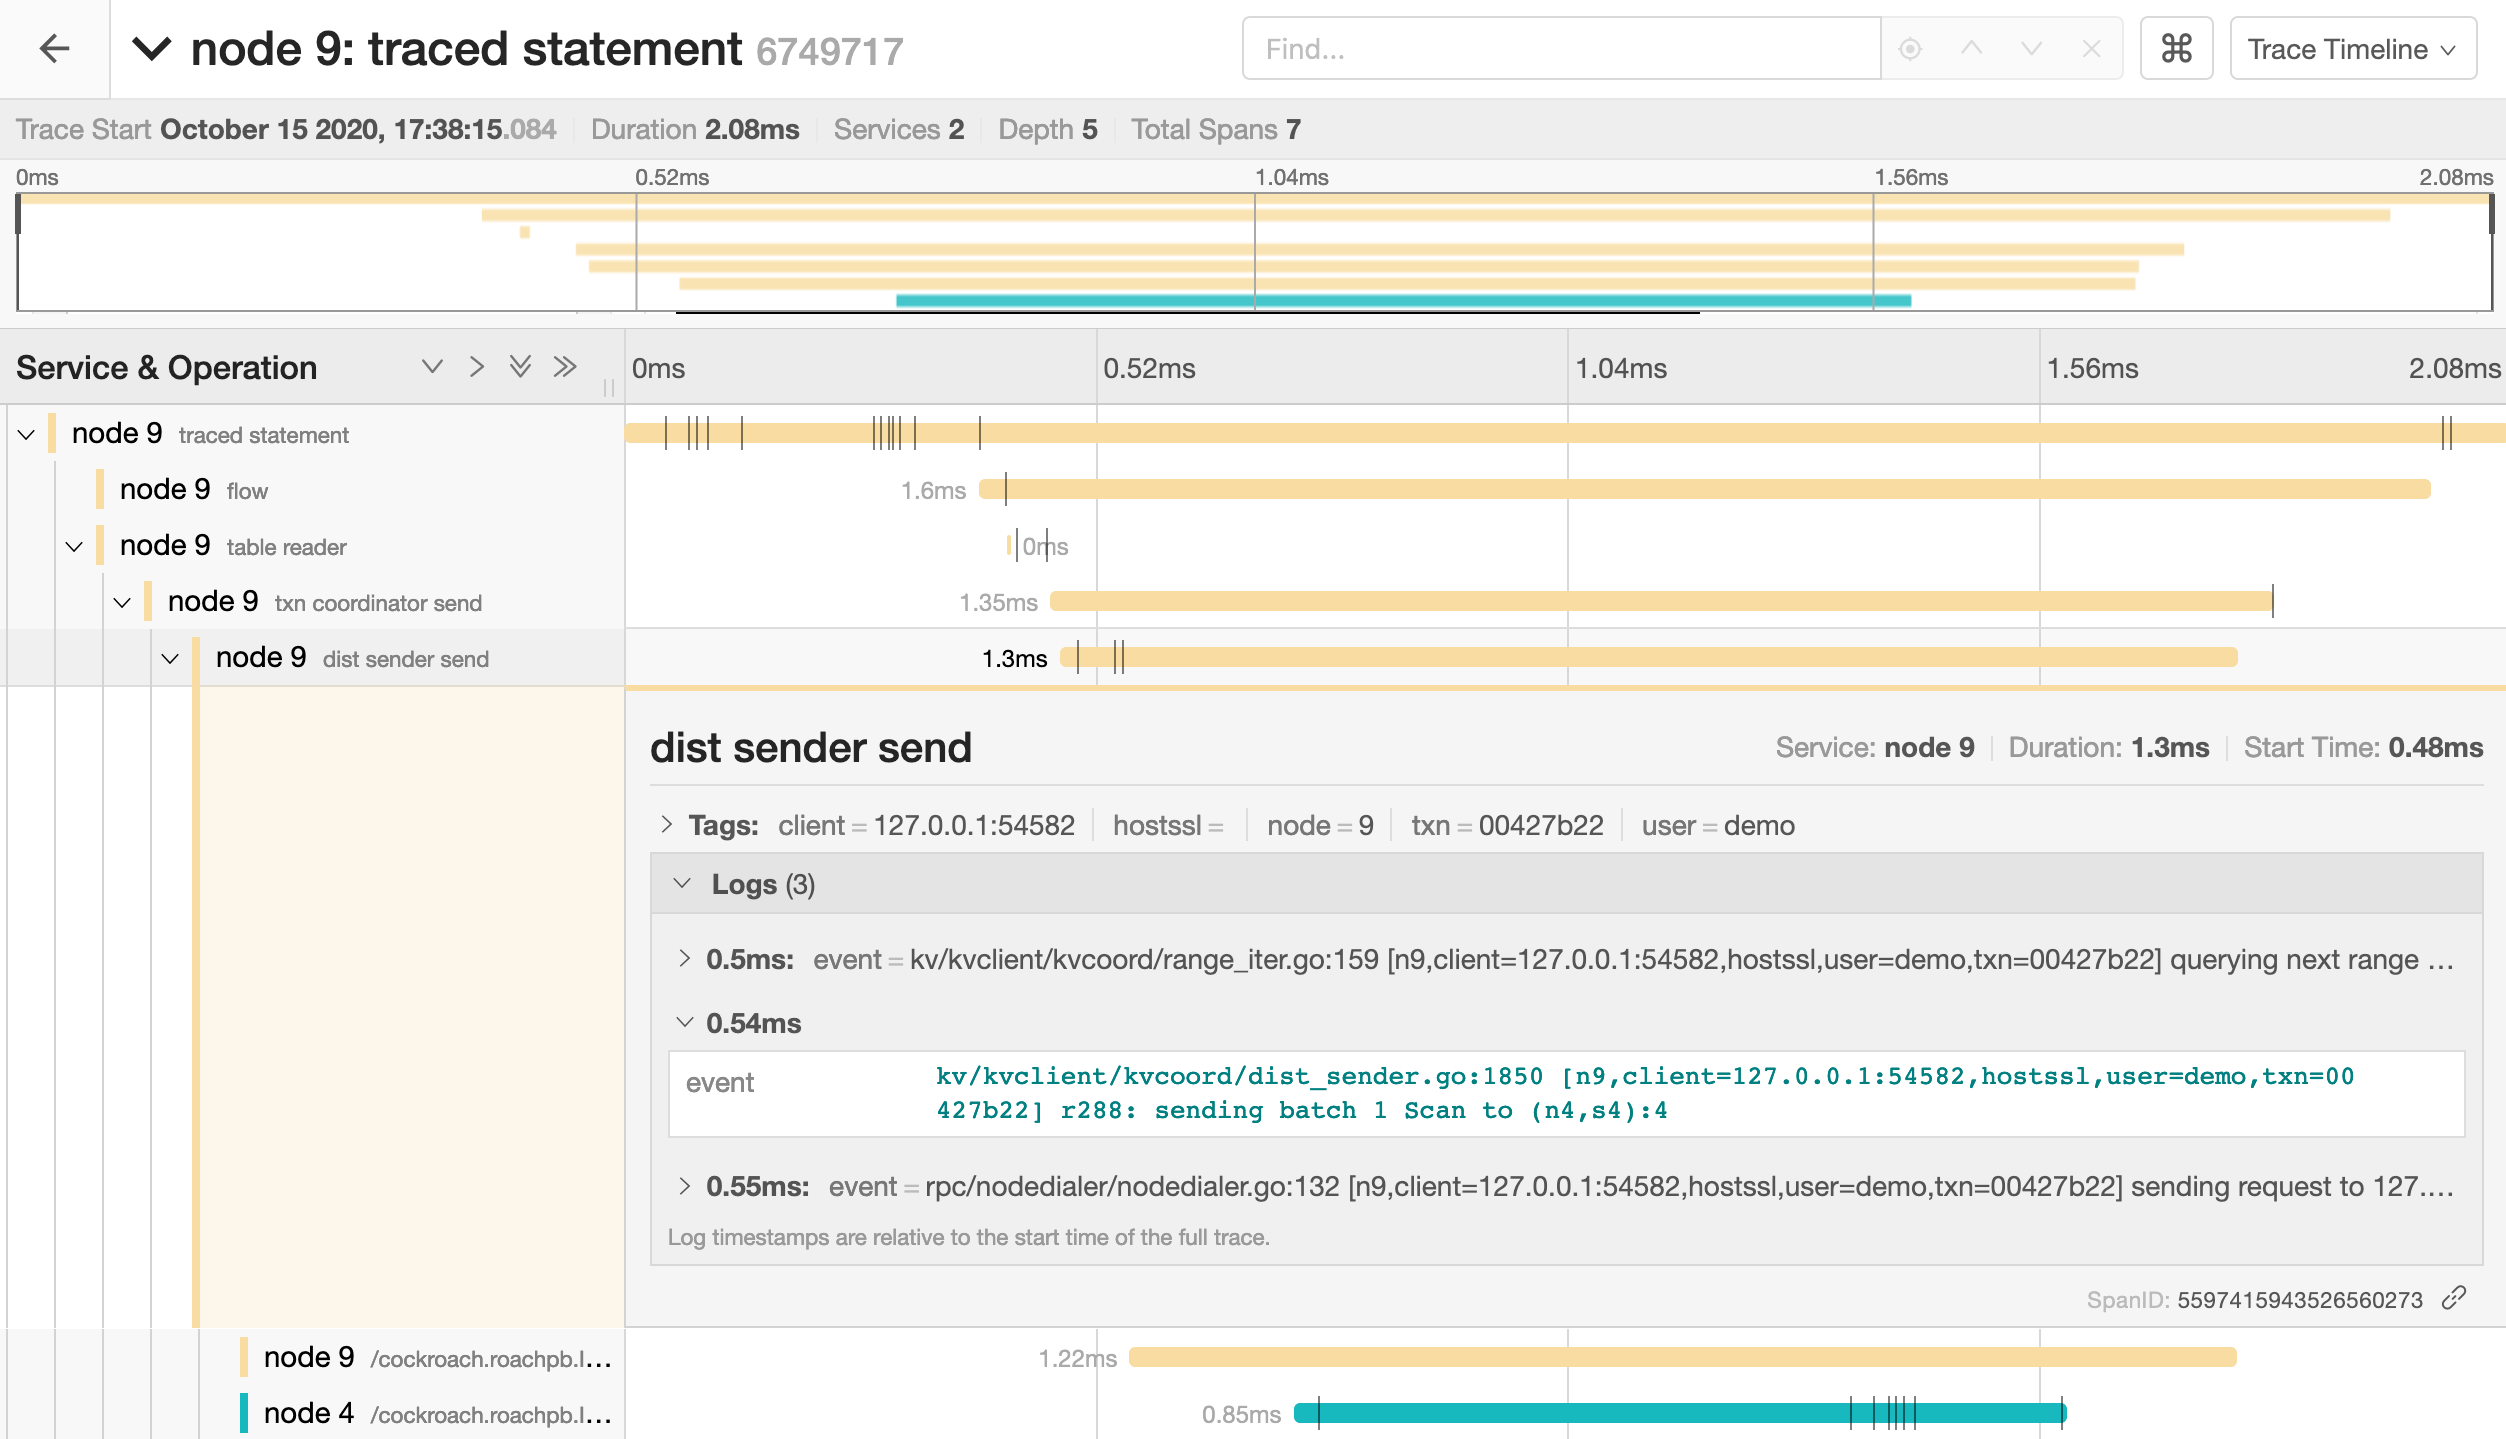
Click on a span to view details for that span and log messages.
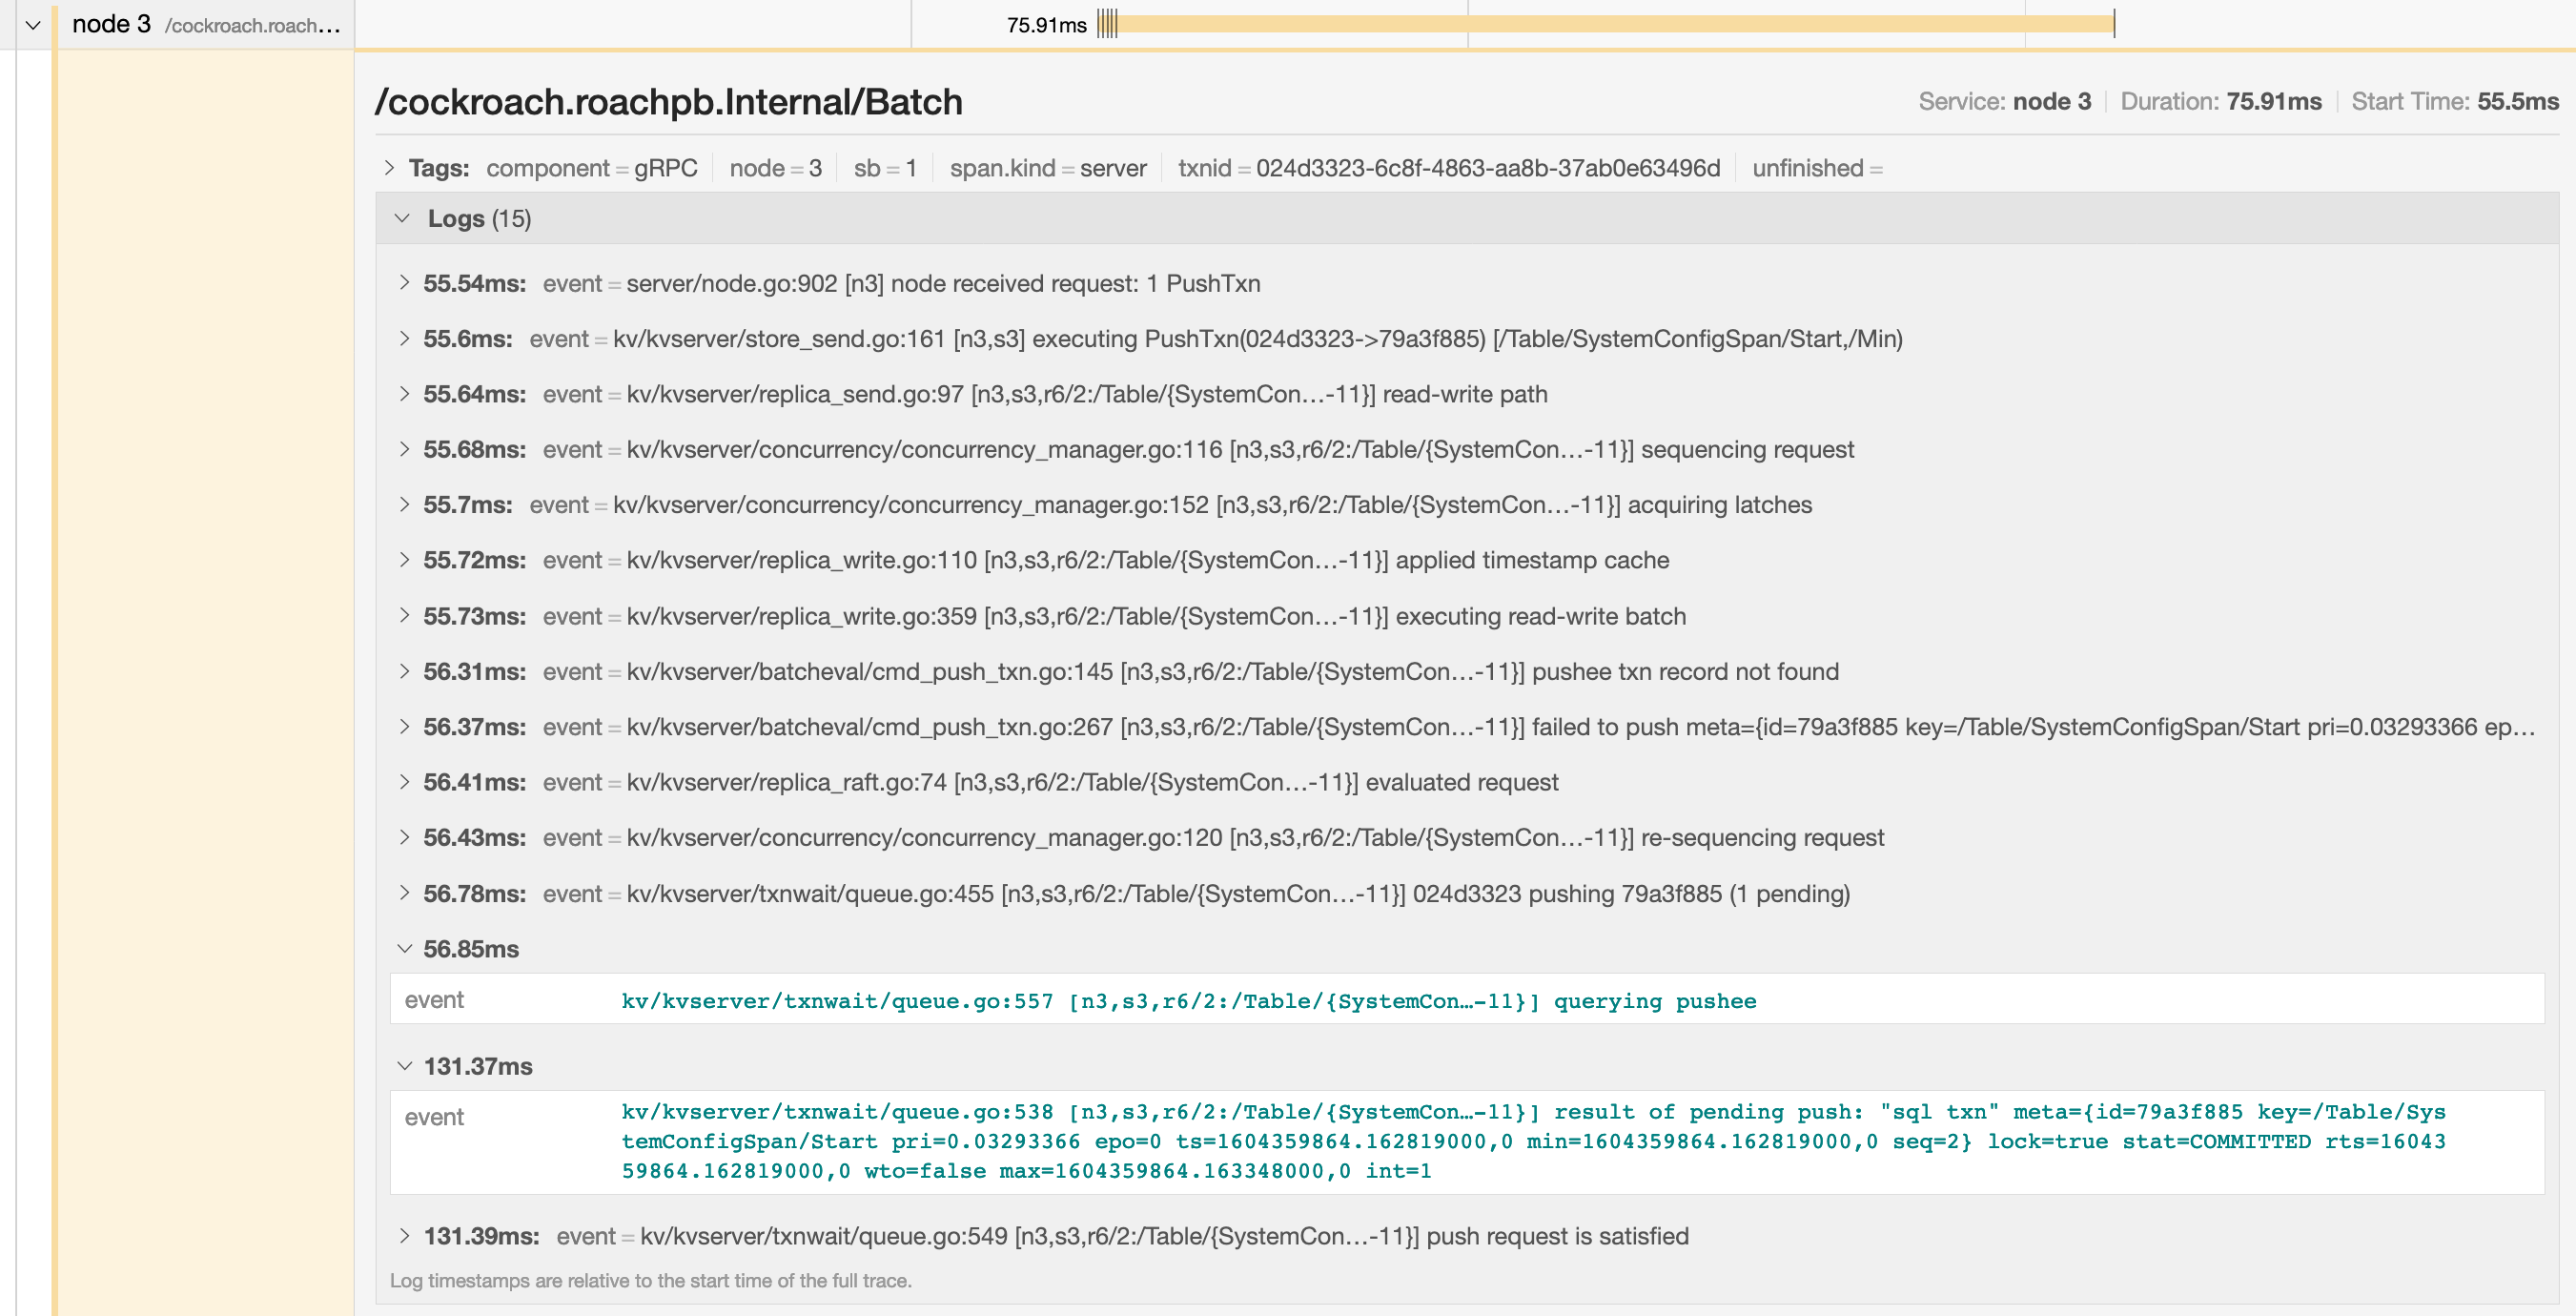
You can troubleshoot transaction contention, for example, by gathering diagnostics on statements with high latency and looking through the log messages in
trace-jaeger.jsonfor jumps in latency.
In the example below, the trace shows that there is significant latency between a push attempt on a transaction that is holding a lock (56.85ms) and that transaction being committed (131.37ms).
SELECT statement performance issues
The common reasons for a sub-optimal SELECT performance are inefficient scans, full scans, and incorrect use of indexes. To improve the performance of SELECT statements, refer to the following documents:
Query is always slow
If you have consistently slow queries in your cluster, use the Statement Details page to drill down to an individual statement and collect diagnostics for the statement. A diagnostics bundle contains a record of transaction events across nodes for the SQL statement.
You can also use an EXPLAIN ANALYZE statement, which executes a SQL query and returns a physical query plan with execution statistics. Query plans can be used to troubleshoot slow queries by indicating where time is being spent, how long a processor (i.e., a component that takes streams of input rows and processes them according to a specification) is not doing work, etc.
We recommend sending either the diagnostics bundle or the EXPLAIN ANALYZE output to our support team for analysis.
Query is sometimes slow
If the query performance is irregular:
Run
SHOW TRACEfor the query twice: once when the query is performing as expected and once when the query is slow.Contact us to analyze the outputs of the
SHOW TRACEcommand.
Cancelling running queries
See Cancel query
Low throughput
Throughput is affected by the disk I/O, CPU usage, and network latency. Use the DB Console to check the following metrics:
Disk I/O: Disk IOPS in progress
CPU usage: CPU percent
Network latency: Network Latency page
Single hot node
A hot node is one that has much higher resource usage than other nodes. To determine if you have a hot node in your cluster, access the DB Console, click Metrics on the left, and navigate to the following graphs. Hover over each of the following graphs to see the per-node values of the metrics. If one of the nodes has a higher value, you have a hot node in your cluster.
Replication dashboard > Average queries per store graph.
Overview Dashboard > Service Latency graph
Hardware Dashboard > CPU percent graph
SQL Dashboard > SQL Connections graph
Hardware Dashboard > Disk IOPS in Progress graph
Solution:
If you have a small table that fits into one range, then only one of the nodes will be used. This is expected behavior. However, you can split your range to distribute the table across multiple nodes.
If the SQL Connections graph shows that one node has a higher number of SQL connections and other nodes have zero connections, check if your app is set to talk to only one node.
Check load balancer settings.
Check for transaction contention.
If you have a monotonically increasing index column or Primary Key, then your index or Primary Key should be redesigned. See Unique ID best practices for more information.
INSERT/UPDATE statements are slow
Use the Statements page to identify the slow SQL statements. To view the Statements page, access the DB Console and then click Statements on the left.
Refer to the following documents to improve INSERT / UPDATE performance:
Per-node queries per second (QPS) is high
If a cluster is not idle, it is useful to monitor the per-node queries per second. Cockroach will automatically distribute load throughout the cluster. If one or more nodes is not performing any queries there is likely something to investigate. See exec_success and exec_errors which track operations at the KV layer and sql_{select,insert,update,delete}_count which track operations at the SQL layer.
Increasing number of nodes does not improve performance
See Why would increasing the number of nodes not result in more operations per second?
bad connection & closed responses
If you receive a response of bad connection or closed, this normally indicates that the node you connected to died. You can check this by connecting to another node in the cluster and running cockroach node status.
Once you find the downed node, you can check its logs (stored in cockroach-data/logs by default).
Because this kind of behavior is entirely unexpected, you should file an issue.
Local query testing
If you are testing CockroachDB locally and want to log queries executed just by a specific node, you can either pass a CLI flag at node startup or execute a SQL function on a running node.
Using the CLI to start a new node, use the --vmodule flag with the cockroach start command. For example, to start a single node locally and log all client-generated SQL queries it executes, you'd run:
$ cockroach start --insecure --listen-addr=localhost --vmodule=exec_log=2 --join=<join addresses>
To log CockroachDB-generated SQL queries as well, use --vmodule=exec_log=3.
From the SQL prompt on a running node, execute the crdb_internal.set_vmodule() function:
> SELECT crdb_internal.set_vmodule('exec_log=2');
This will result in the following output:
  crdb_internal.set_vmodule
+---------------------------+
                          0
(1 row)
Once the logging is enabled, all client-generated SQL queries executed by the node will be written to the DEV logging channel, which outputs by default to the primary cockroach log file in /cockroach-data/logs. Use the symlink cockroach.log to open the most recent log.
I180402 19:12:28.112957 394661 sql/exec_log.go:173 [n1,client=127.0.0.1:50155,user=root] exec "psql" {} "SELECT version()" {} 0.795 1 ""
Something else?
Try searching the rest of our docs for answers or using our other support resources, including:
