
The Storage dashboard lets you monitor the storage utilization of your cluster.
To view this dashboard, access the Admin UI, click Metrics in the left-hand navigation, and select Dashboard > Storage.
Dashboard navigation
Use the Graph menu to display metrics for your entire cluster or for a specific node.
To the right of the Graph and Dashboard menus, a range selector allows you to filter the view for a predefined timeframe or custom date/time range. Use the navigation buttons to move to the previous, next, or current timeframe. Note that the active timeframe is reflected in the URL and can be easily shared.
The Storage dashboard displays the following time series graphs:
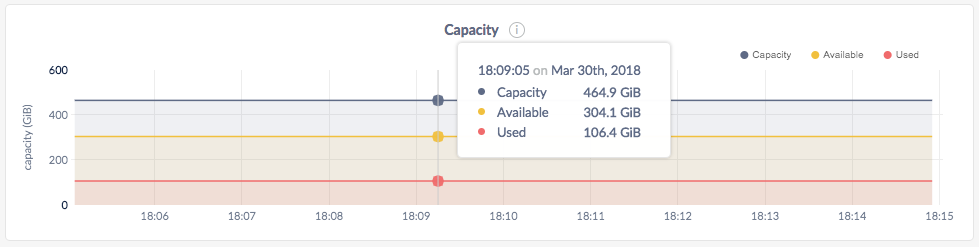
Capacity
You can monitor the Capacity graph to determine when additional storage is needed (e.g., by scaling your cluster).
| Metric | Description |
|---|---|
| Capacity | The maximum store size. This value may be set per node using --store. If a store size has not been set, this metric displays the actual disk capacity. See Capacity metrics. |
| Available | The free disk space available to CockroachDB data. |
| Used | The disk space in use by CockroachDB data. This excludes the Cockroach binary, operating system, and other system files. |
Capacity metrics
The Capacity graph displays disk usage by CockroachDB data in relation to the maximum store size, which is determined as follows:
- If a store size was specified using the
--storeflag when starting nodes, this value is used as the limit for CockroachDB data. - If no store size has been explicitly set, the actual disk capacity is used as the limit for CockroachDB data.
The available capacity thus equals the amount of empty disk space, up to the value of the maximum store size. The used capacity refers only to disk space occupied by CockroachDB data, which resides in the store directory on each node.
The disk usage of the Cockroach binary, operating system, and other system files is not shown on the Capacity graph.
If you are testing your deployment locally with multiple CockroachDB nodes running on a single machine (this is not recommended in production), you must explicitly set the store size per node in order to display the correct capacity. Otherwise, the machine's actual disk capacity will be counted as a separate store for each node, thus inflating the computed capacity.
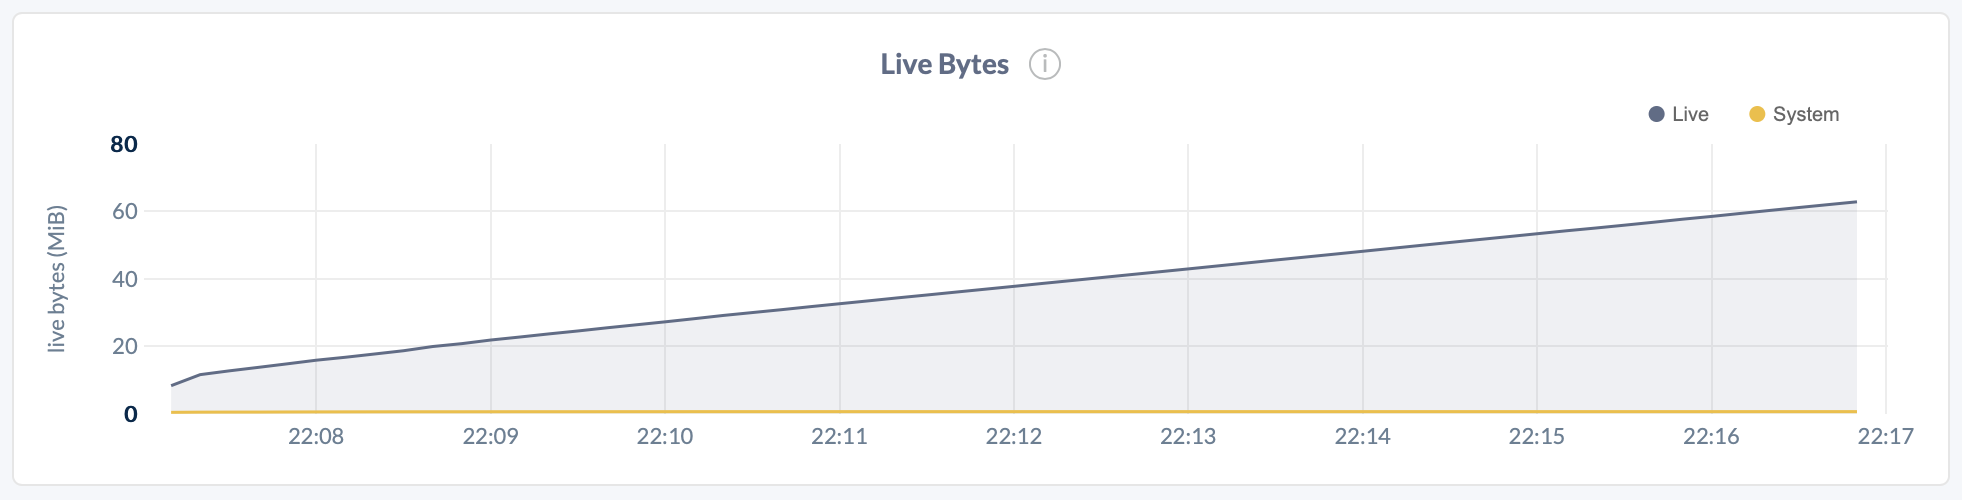
Live Bytes
The Live Bytes graph displays the amount of data that can be read by applications and CockroachDB.
| Metric | Description |
|---|---|
| Live | Number of logical bytes stored in live key-value pairs. Live data excludes historical and deleted data. |
| System | Number of physical bytes stored in system key-value pairs. This includes historical and deleted data that has not been garbage collected. |
Logical bytes reflect the approximate number of bytes stored in the database. This value may deviate from the number of physical bytes on disk, due to factors such as compression and write amplification.
File Descriptors
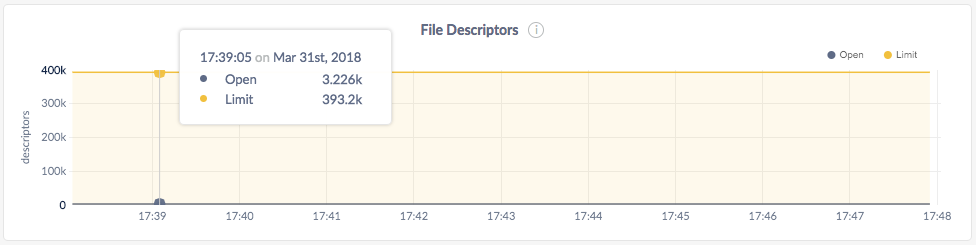
In the node view, the graph shows the number of open file descriptors for that node, compared with the file descriptor limit.
In the cluster view, the graph shows the number of open file descriptors across all nodes, compared with the file descriptor limit.
If the Open count is almost equal to the Limit count, increase File Descriptors.
If you are running multiple nodes on a single machine (not recommended), the actual number of open file descriptors are considered open on each node. Thus the limit count value displayed on the Admin UI is the actual value of open file descriptors multiplied by the number of nodes, compared with the file descriptor limit.
For Windows systems, you can ignore the File Descriptors graph because the concept of file descriptors is not applicable to Windows.
Other graphs
The Storage dashboard shows other time series graphs that are important for CockroachDB developers:
- Log Commit Latency
- Command Commit Latency
- Read Amplification
- SSTables
- Compactions/Flushes
- Time Series Writes
- Time Series Bytes Written
For monitoring CockroachDB, it is sufficient to use the Capacity and File Descriptors graphs.
Summary and events
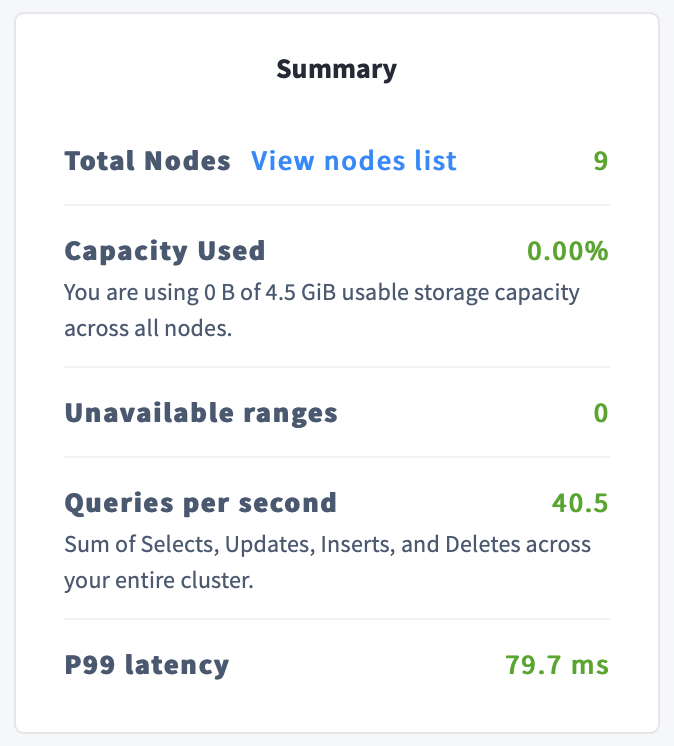
Summary panel
A Summary panel of key metrics is displayed to the right of the timeseries graphs.
| Metric | Description |
|---|---|
| Total Nodes | The total number of nodes in the cluster. Decommissioned nodes are not included in this count. |
| Capacity Used | The storage capacity used as a percentage of usable capacity allocated across all nodes. |
| Unavailable Ranges | The number of unavailable ranges in the cluster. A non-zero number indicates an unstable cluster. |
| Queries per second | The total number of SELECT, UPDATE, INSERT, and DELETE queries executed per second across the cluster. |
| P99 Latency | The 99th percentile of service latency. |
If you are testing your deployment locally with multiple CockroachDB nodes running on a single machine (this is not recommended in production), you must explicitly set the store size per node in order to display the correct capacity. Otherwise, the machine's actual disk capacity will be counted as a separate store for each node, thus inflating the computed capacity.
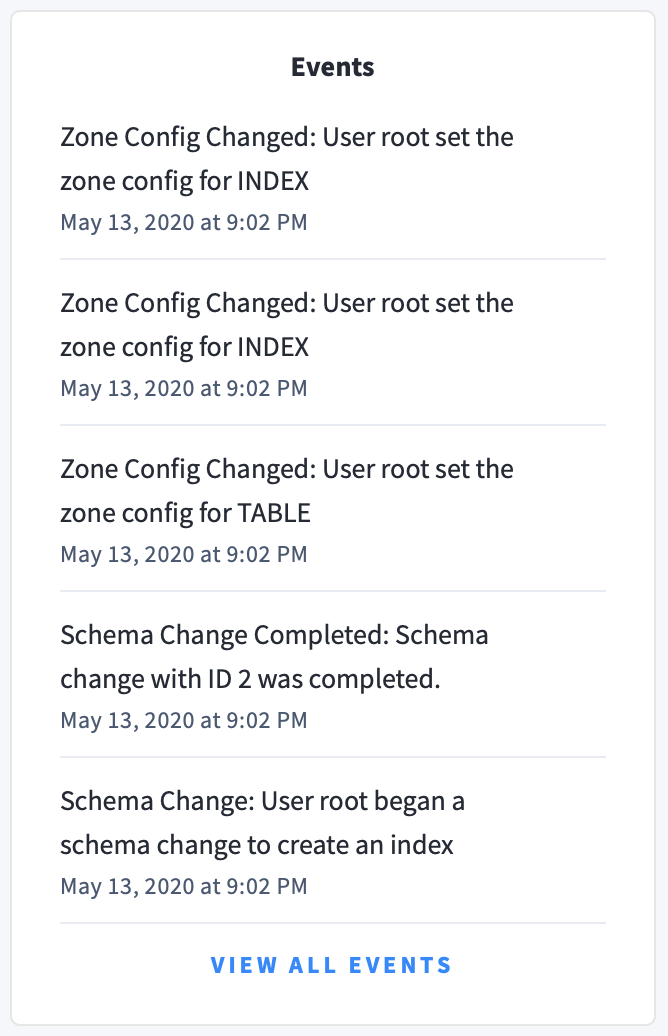
Events panel
Underneath the Summary panel, the Events panel lists the 5 most recent events logged for all nodes across the cluster. To list all events, click View all events.
The following types of events are listed:
- Database created
- Database dropped
- Table created
- Table dropped
- Table altered
- Index created
- Index dropped
- View created
- View dropped
- Schema change reversed
- Schema change finished
- Node joined
- Node decommissioned
- Node restarted
- Cluster setting changed
