
The Storage dashboard in the CockroachDB Admin UI lets you monitor the storage utilization for your cluster. To view this dashboard, access the Admin UI, click Metrics on the left-hand navigation bar, and then select Dashboard > Storage.
The Storage dashboard displays the following time series graphs:
Capacity
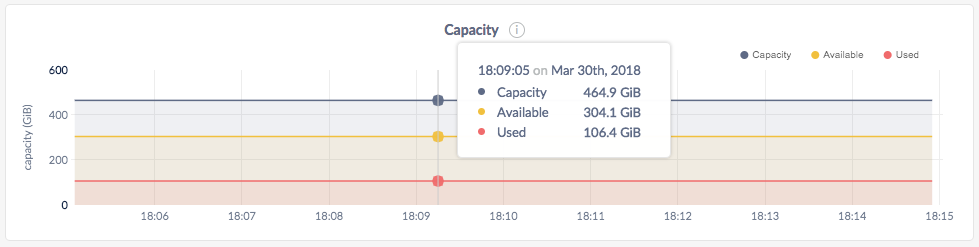
You can monitor the Capacity graph to determine when additional storage is needed.
In the node view, the graph shows the maximum allocated capacity, available storage capacity, and capacity used by CockroachDB for the selected node.
In the cluster view, the graph shows the maximum allocated capacity, available storage capacity, and capacity used by CockroachDB across all nodes in the cluster.
On hovering over the graph, the values for the following metrics are displayed:
| Metric | Description |
|---|---|
| Capacity | The maximum storage capacity allocated to CockroachDB. You can configure the maximum storage capacity for a given node using the --store flag. For more information, see Start a Node. |
| Available | The free storage capacity available to CockroachDB. |
| Used | Disk space used by the data in the CockroachDB store. Note that this value is less than (Capacity - Available) because Capacity and Available metrics consider the entire disk and all applications on the disk, including CockroachDB, whereas Used metric tracks only the store's disk usage. |
If you are running multiple nodes on a single machine (not recommended in production) and didn't specify the maximum allocated storage capacity for each node using the --store flag, the capacity metrics in the Admin UI are incorrect. This is because when multiple nodes are running on a single machine, the machine's hard disk is treated as an available store for each node, while in reality, only one hard disk is available for all nodes. The total available capacity is then calculated as the hard disk size multiplied by the number of nodes on the machine.
File Descriptors
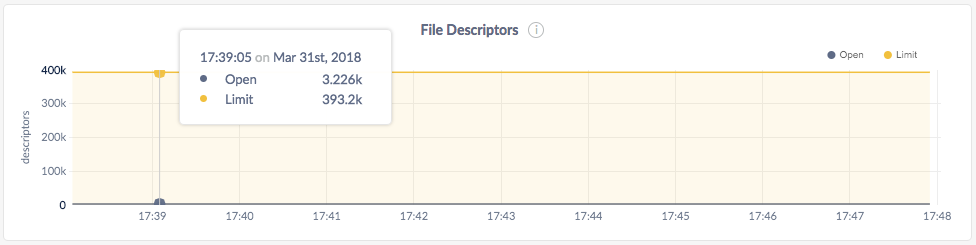
In the node view, the graph shows the number of open file descriptors for that node, compared with the file descriptor limit.
In the cluster view, the graph shows the number of open file descriptors across all nodes, compared with the file descriptor limit.
If the Open count is almost equal to the Limit count, increase File Descriptors.
If you are running multiple nodes on a single machine (not recommended), the actual number of open file descriptors are considered open on each node. Thus the limit count value displayed on the Admin UI is the actual value of open file descriptors multiplied by the number of nodes, compared with the file descriptor limit.
For Windows systems, you can ignore the File Descriptors graph because the concept of file descriptors is not applicable to Windows.
Other graphs
The Storage dashboard shows other time series graphs that are important for CockroachDB developers:
- Live Bytes
- Log Commit Latency
- Command Commit Latency
- RocksDB Read Amplification
- RocksDB SSTables
- Time Series Writes
- Time Series Bytes Written
For monitoring CockroachDB, it is sufficient to use the Capacity and File Descriptors graphs.
