
The SQL dashboard in the CockroachDB Admin UI lets you monitor the performance of your SQL queries. To view this dashboard, access the Admin UI, click Metrics on the left-hand navigation bar, and then select Dashboard > SQL.
Dashboard navigation
Use the Graph menu to display metrics for your entire cluster or for a specific node.
To the right of the Graph and Dashboard menus, a range selector allows you to filter the view for a predefined timeframe or custom date/time range. Use the navigation buttons to move to the previous, next, or current timeframe. Note that the active timeframe is reflected in the URL and can be easily shared.
The SQL dashboard displays the following time series graphs:
SQL Connections
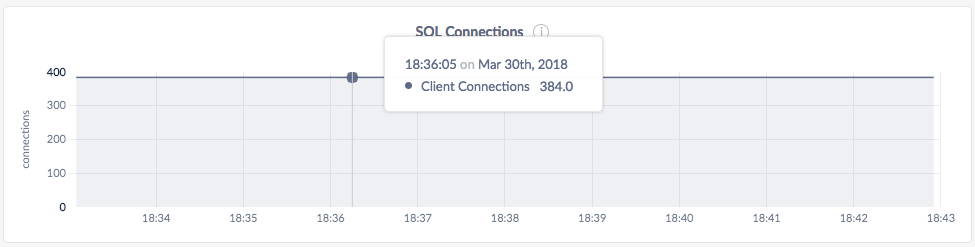
In the node view, the graph shows the number of connections currently open between the client and the selected node.
In the cluster view, the graph shows the total number of SQL client connections to all nodes combined.
SQL Byte Traffic
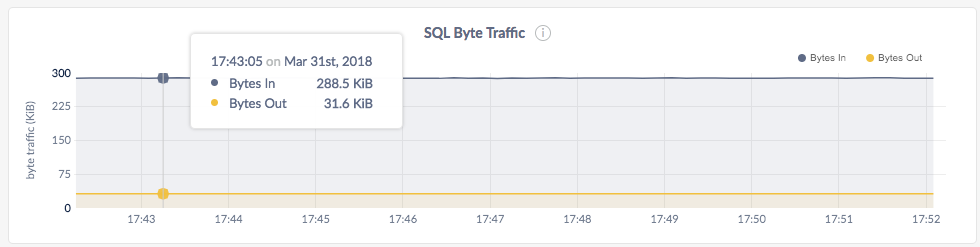
The SQL Byte Traffic graph helps you correlate SQL query count to byte traffic, especially in bulk data inserts or analytic queries that return data in bulk.
In the node view, the graph shows the current byte throughput (bytes/second) between all the currently connected SQL clients and the node.
In the cluster view, the graph shows the aggregate client throughput across all nodes.
SQL Queries
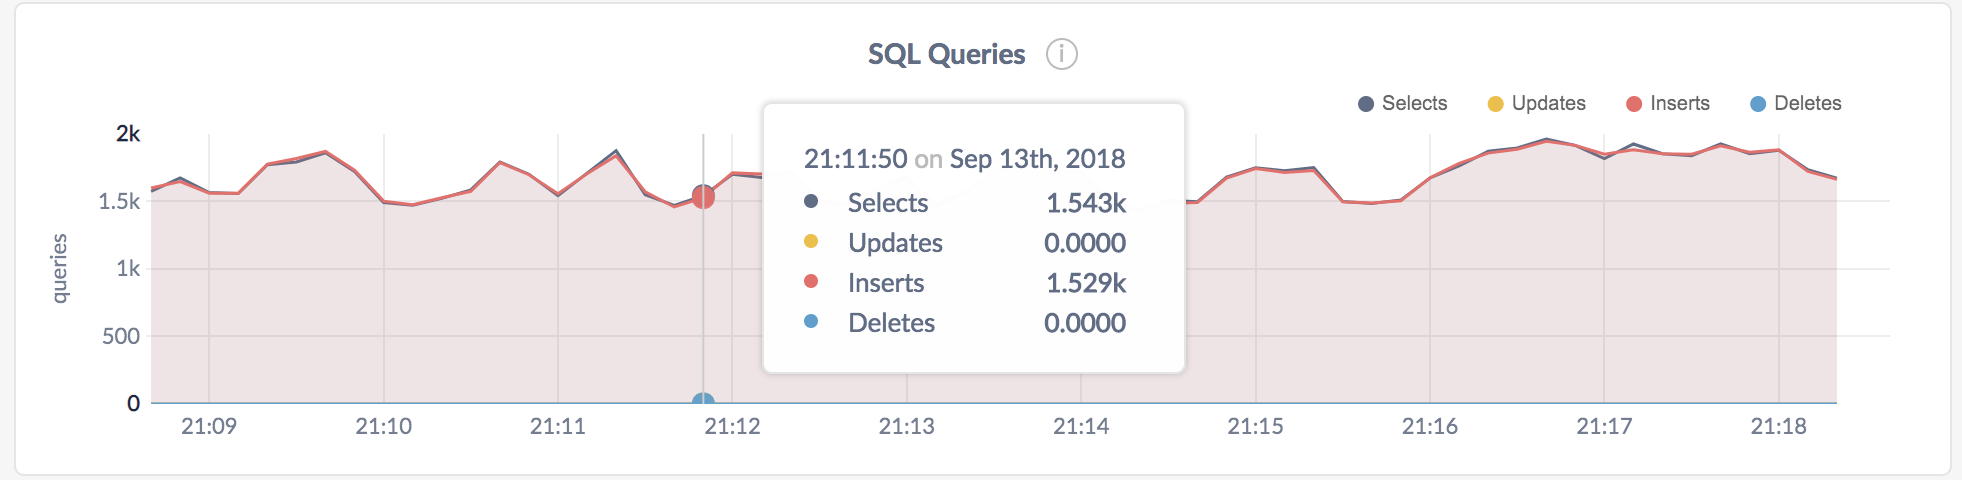
In the node view, the graph shows the 10-second average of the number of
SELECT/INSERT/UPDATE/DELETEqueries per second issued by SQL clients on the node.In the cluster view, the graph shows the sum of the per-node averages, that is, an aggregate estimation of the current query load over the cluster, assuming the last 10 seconds of activity per node are representative of this load.
SQL Query Errors
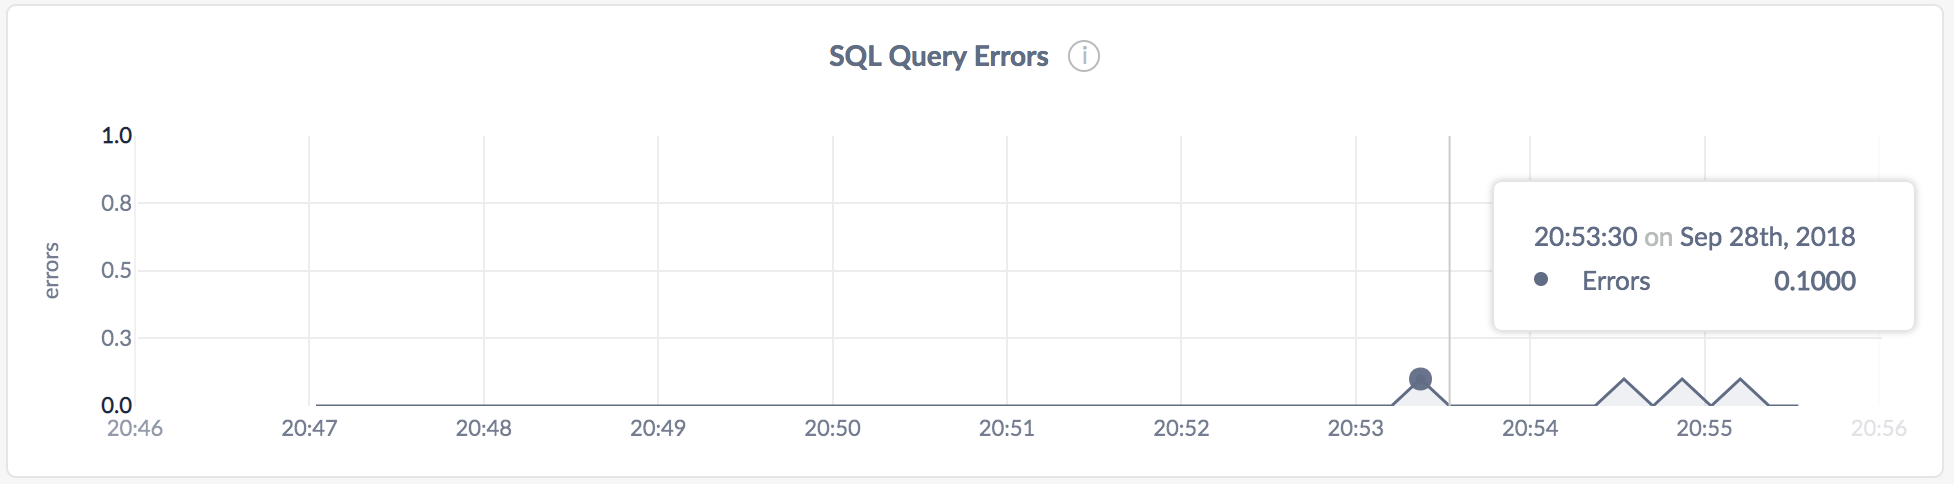
In the node view, the graph shows the 10-second average of the number of SQL statements issued to the node that returned a planning, runtime, or retry error.
In the cluster view, the graph shows the 10-second average of the number of SQL statements that returned a planning, runtime, or retry error across all nodes.
Service Latency: SQL, 99th percentile
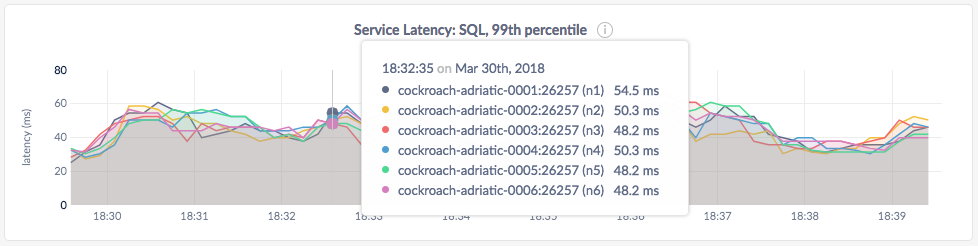
Service latency is calculated as the time between when the cluster receives a query and finishes executing the query. This time does not include returning results to the client.
In the node view, the graph displays the 99th percentile of service latency for the selected node.
In the cluster view, the graph displays the 99th percentile of service latency for each node in the cluster.
Transactions
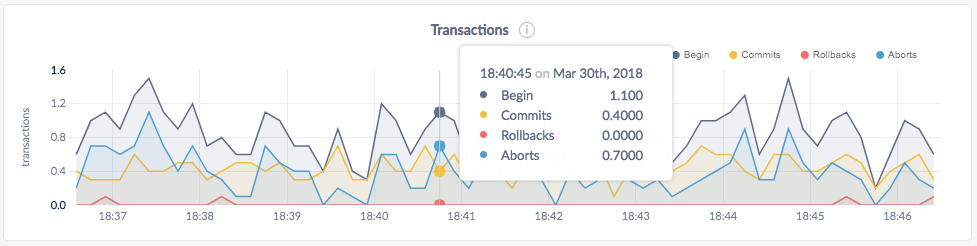
In the node view, the graph shows the 10-second average of the number of opened, committed, aborted, and rolled back transactions per second issued by SQL clients on the node.
In the cluster view, the graph shows the sum of the per-node averages, that is, an aggregate estimation of the current transactions load over the cluster, assuming the last 10 seconds of activity per node are representative of this load.
If the graph shows excessive aborts or rollbacks, it might indicate issues with the SQL queries. In that case, re-examine queries to lower contention.
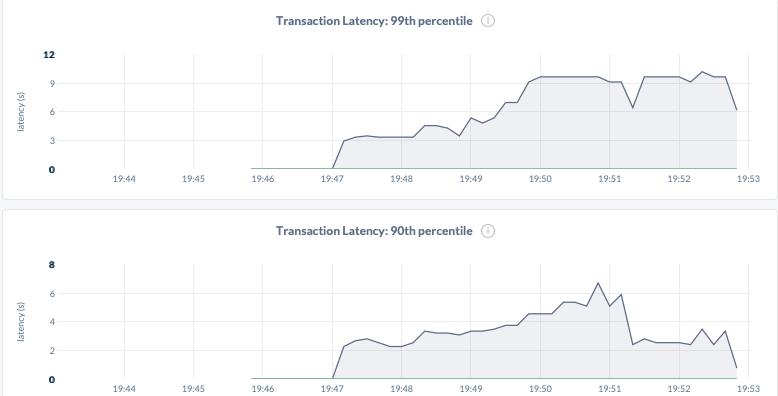
Additionally, per-application average transaction times are displayed for each node, at the 90th and 99th percentiles.
Other graphs
The SQL dashboard shows other time series graphs that are important for CockroachDB developers:
- KV Execution Latency
- Active Distributed SQL Queries
- Active Flows for Distributed SQL Queries
- Service Latency: DistSQL
- Schema Changes
For monitoring CockroachDB, it is sufficient to use the SQL Connections, SQL Byte Traffic, SQL Queries, Service Latency, and Transactions graphs.
Summary and events
Summary panel
A Summary panel of key metrics is displayed to the right of the timeseries graphs.
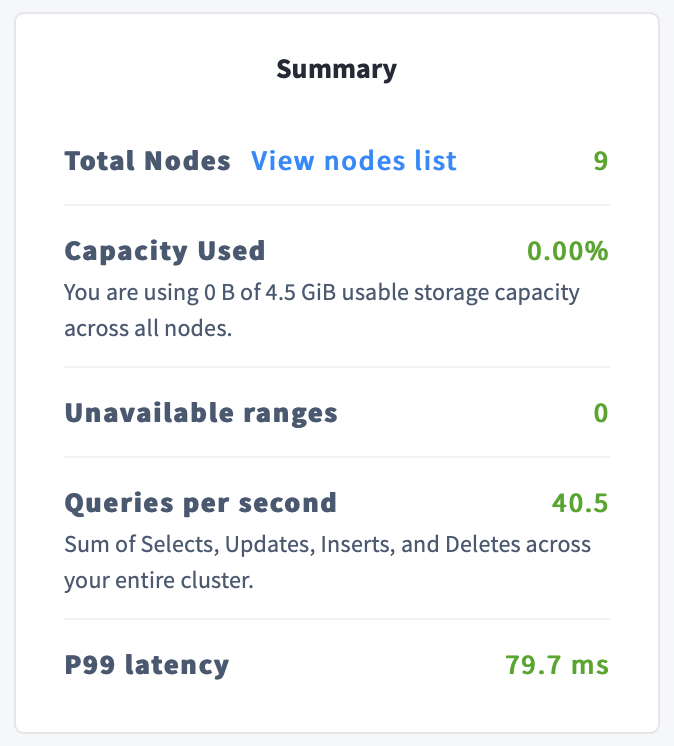
| Metric | Description |
|---|---|
| Total Nodes | The total number of nodes in the cluster. Decommissioned nodes are not included in this count. |
| Capacity Used | The storage capacity used as a percentage of usable capacity allocated across all nodes. |
| Unavailable Ranges | The number of unavailable ranges in the cluster. A non-zero number indicates an unstable cluster. |
| Queries per second | The total number of SELECT, UPDATE, INSERT, and DELETE queries executed per second across the cluster. |
| P99 Latency | The 99th percentile of service latency. |
If you are testing your deployment locally with multiple CockroachDB nodes running on a single machine (this is not recommended in production), you must explicitly set the store size per node in order to display the correct capacity. Otherwise, the machine's actual disk capacity will be counted as a separate store for each node, thus inflating the computed capacity.
Events panel
Underneath the Summary panel, the Events panel lists the 5 most recent events logged for all nodes across the cluster. To list all events, click View all events.
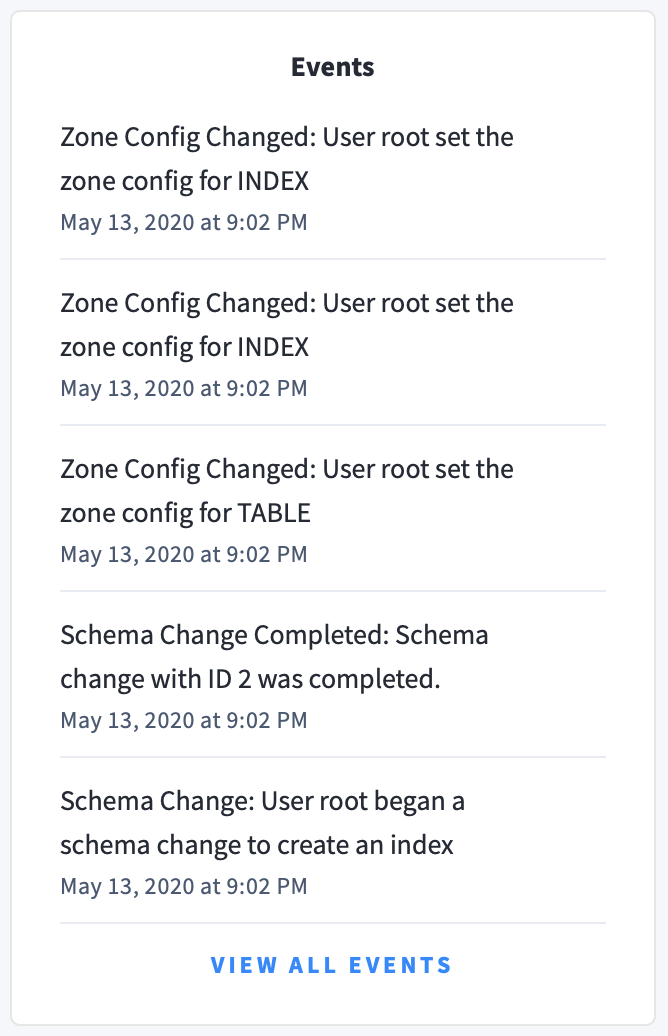
The following types of events are listed:
- Database created
- Database dropped
- Table created
- Table dropped
- Table altered
- Index created
- Index dropped
- View created
- View dropped
- Schema change reversed
- Schema change finished
- Node joined
- Node decommissioned
- Node restarted
- Cluster setting changed
