
The SQL dashboard in the CockroachDB Admin UI lets you monitor the performance of your SQL queries. To view this dashboard, access the Admin UI and then select Dashboard > SQL.
The SQL dashboard displays the following time series graphs:
SQL Connections
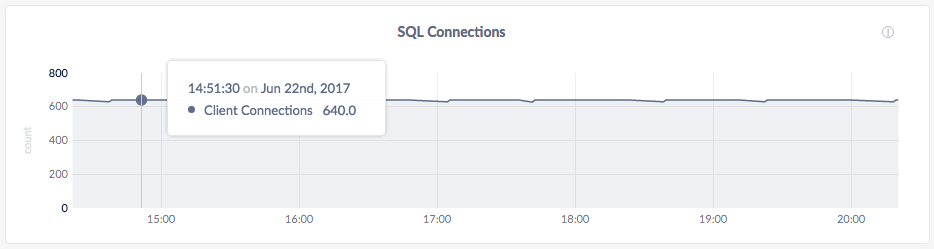
In the node view, the graph shows the number of connections currently open between the client and the selected node.
In the cluster view, the graph shows the total number of SQL client connections to all nodes combined.
SQL Byte Traffic
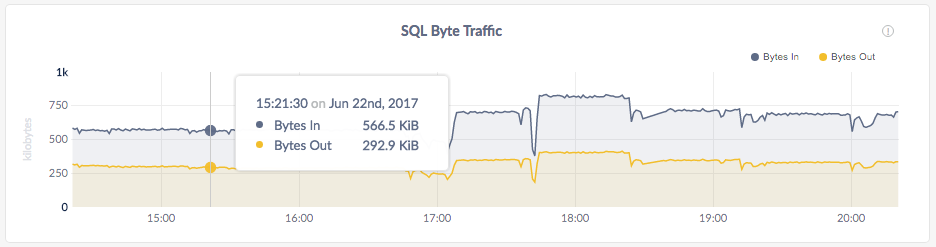
The SQL Byte Traffic graph helps you correlate SQL query count to byte traffic, especially in bulk data inserts or analytic queries that return data in bulk.
In the node view, the graph shows the current byte throughput (bytes/second) between all the currently connected SQL clients and the node.
In the cluster view, the graph shows the aggregate client throughput across all nodes.
SQL Queries
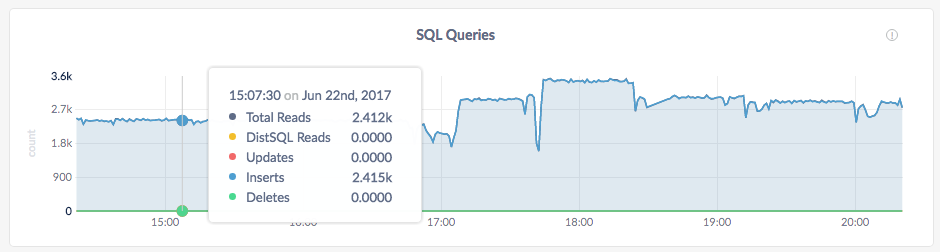
In the node view, the graph shows the current moving average, over the last 10 seconds, of the number of
SELECT/INSERT/UPDATE/DELETEqueries per second issued by SQL clients on the node.In the cluster view, the graph shows the sum of the per-node averages, that is, an aggregate estimation of the current query load over the cluster, assuming the last 10 seconds of activity per node are representative of this load.
Transactions
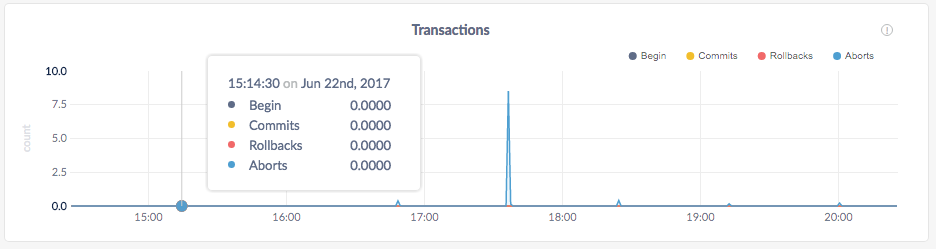
In the node view, the graph shows separately the current moving average, over the last 10 seconds, of the number of opened, committed, aborted and rolled back transactions per second issued by SQL clients on the node.
In the cluster view, the graph shows the sum of the per-node averages, that is, an aggregate estimation of the current transactions load over the cluster, assuming the last 10 seconds of activity per node are representative of this load.
If the graph shows excessive aborts or rollbacks, it might indicate issues with the SQL queries. In that case, re-examine queries to lower contention.
Service Latency
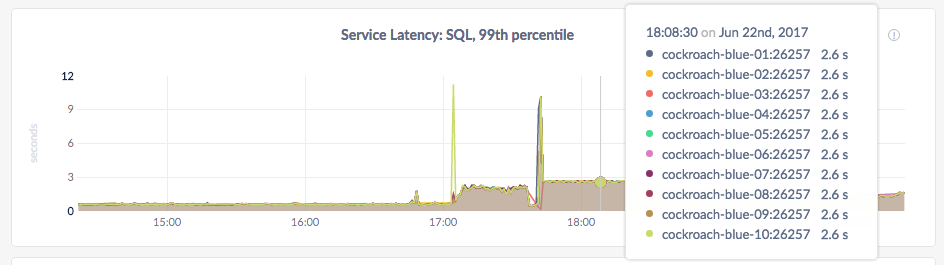
Service latency is calculated as the time between when the cluster receives a query and finishes executing the query. This time does not include returning results to the client.
In the node view, the graph displays the 99th percentile of service latency for the selected node.
In the cluster view, the graph displays the 99th percentile of service latency for each node in the cluster.
Other Graphs
The SQL dashboard shows other time series graphs that are important for CockroachDB developers:
- Execution Latency
- Active Distributed SQL Queries
- Active Flows for Distributed SQL Queries
- Service Latency: DistSQL
- Schema Changes
For monitoring CockroachDB, it is sufficient to use the SQL Connections, SQL Byte Traffic, SQL Queries, Service Latency, and Transactions graphs.
