
This page provides recipes for fixing performance issues in your applications.
Problems
This section describes how to use CockroachDB commands and dashboards to identify performance problems in your applications.
| Observation | Diagnosis | Solution |
|---|---|---|
|
|
|
|
|
|
|
|
|
|
|
|
|
Solutions
This section provides solutions for common performance issues in your applications.
Transaction contention
Transaction contention occurs when transactions issued from multiple clients at the same time operate on the same data. This can cause transactions to wait on each other (like when many people try to check out with the same cashier at a store) and decrease performance.
Indicators that your application is experiencing transaction contention
- Your application is experiencing degraded performance with transaction errors like
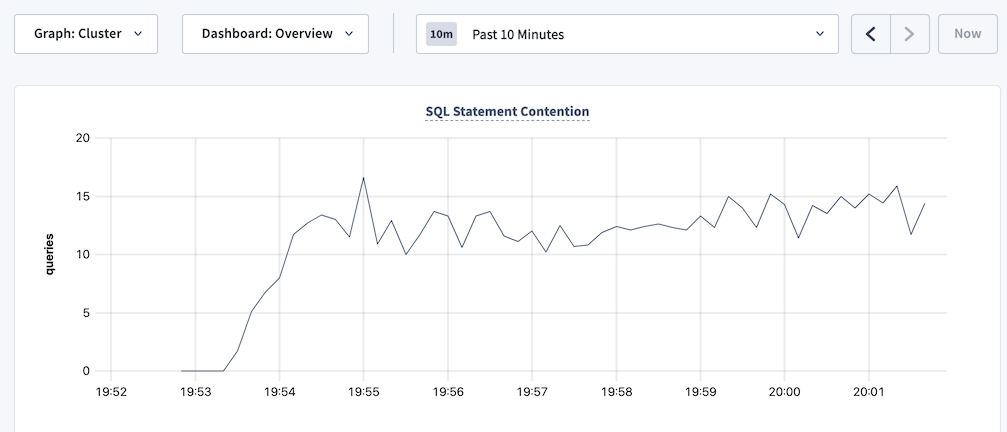
SQLSTATE: 40001,RETRY_WRITE_TOO_OLD, andRETRY_SERIALIZABLE. See Transaction Retry Error Reference. - The SQL Statement Contention graph is showing spikes over time.
- The Transaction Restarts graph is showing spikes in retries over time.
Fix transaction contention problems
Find the transactions and statements within the transactions that are experiencing contention. CockroachDB has several tools to help you track down such transactions and statements:
- In DB Console, visit the Transactions and Statements pages and sort transactions and statements by contention.
Query the following tables:
crdb_internal.cluster_contended_indexesandcrdb_internal.cluster_contended_tablestables for your database to find the indexes and tables that are experiencing contention.crdb_internal.cluster_locksto find out which transactions are holding locks on which objects.crdb_internal.cluster_contention_eventsto view the tables/indexes with the most time under contention.
After you identify the transactions or statements that are causing contention, follow the steps in the next section to avoid contention.
If you experience a hanging or stuck query that is not showing up in the list of contended transactions and statements on the Transactions or Statements pages in the DB Console, the process described above will not work. You will need to follow the process described in Hanging or stuck queries instead.
Statements with full table scans
Full table scans often result in poor statement performance.
Indicators that your application has statements with full table scans
The following query returns statements with full table scans in their statement plan:
SHOW FULL TABLE SCANS;The following query against the
CRDB_INTERNAL.node_statement_statisticstable returns results:SELECT count(*) as total_full_scans FROM crdb_internal.node_statement_statistics WHERE full_scan = true;Viewing the statement plan on the Statement details page of the DB Console indicates that the plan contains full table scans.
The statement plans returned by the
EXPLAINandEXPLAIN ANALYZEcommands indicate that there are full table scans.The Full Table/Index Scans graph in the DB Console is showing spikes over time.
Fix full table scans in statements
Not every full table scan is an indicator of poor performance. The cost-based optimizer may decide on a full table scan when other index or join scans would result in longer execution time.
Examine the statements that result in full table scans and consider adding secondary indexes.
Also see Table scans best practices.
Suboptimal primary keys
Indicators that your tables are using suboptimal primary keys
- The Hardware metrics dashboard in the DB Console shows high resource usage per node.
- The Problem Ranges report on the Advanced Debug page of the DB Console indicates a high number of queries per second on a subset of ranges or nodes.
Fix suboptimal primary keys
Evaluate the schema of your table to see if you can redistribute data more evenly across multiple ranges. Specifically, make sure you have followed best practices when selecting your primary key.
If your application with a small dataset (for example, a dataset that contains few index key values) is experiencing resource contention, consider splitting your tables and indexes to distribute ranges across multiple nodes to reduce resource contention.
Slow writes
Indicators that your tables are experiencing slow writes
If the Overview dashboard in the DB Console shows high service latency when the QPS of INSERT and UPDATE statements is high, your tables are experiencing slow writes.
Fix slow writes
Secondary indexes can improve application read performance. However, there is overhead in maintaining secondary indexes that can affect your write performance. You should profile your tables periodically to determine whether an index is worth the overhead. To identify infrequently accessed indexes that could be candidates to drop, run a join query against the crdb_internal.index_usage_statistics and crdb_internal.table_indexes tables:
SELECT ti.descriptor_name as table_name, ti.index_name, total_reads, last_read
FROM crdb_internal.index_usage_statistics AS us
JOIN crdb_internal.table_indexes ti
ON us.index_id = ti.index_id
AND us.table_id = ti.descriptor_id
ORDER BY total_reads ASC;
              table_name     |                  index_name                   | total_reads |           last_read
-----------------------------+-----------------------------------------------+-------------+--------------------------------
  vehicle_location_histories | vehicle_location_histories_pkey               |           1 | 2021-09-28 22:59:03.324398+00
  rides                      | rides_auto_index_fk_city_ref_users            |           1 | 2021-09-28 22:59:01.500962+00
  rides                      | rides_auto_index_fk_vehicle_city_ref_vehicles |           1 | 2021-09-28 22:59:02.470526+00
  user_promo_codes           | user_promo_codes_pkey                         |         456 | 2021-09-29 00:01:17.063418+00
  promo_codes                | promo_codes_pkey                              |         910 | 2021-09-29 00:01:17.062319+00
  vehicles                   | vehicles_pkey                                 |        3591 | 2021-09-29 00:01:18.261658+00
  users                      | users_pkey                                    |        5401 | 2021-09-29 00:01:18.260198+00
  rides                      | rides_pkey                                    |       45658 | 2021-09-29 00:01:18.258208+00
  vehicles                   | vehicles_auto_index_fk_city_ref_users         |       87119 | 2021-09-29 00:01:19.071476+00
(9 rows)
Use the values in the total_reads and last_read columns to identify indexes that have low usage or are stale and could be dropped.
See also
If you aren't sure whether SQL query performance needs to be improved, see Identify slow queries.
