
On a secure cluster, this area of the DB Console can only be accessed by a SQL user with the VIEWACTIVITY role option. Note that non-admin users will see only their own sessions, while admin users see sessions for all users.
The Sessions page of the DB Console provides details of all open sessions in the cluster.
To view this page, access the DB Console and click Sessions in the left-hand navigation.
Sessions list
Use the Sessions list to see the open sessions in the cluster. This includes active and idle sessions.
A session is active if it has an open transaction (including implicit transactions, which are individual SQL statements), and idle if it has no open transaction. Active sessions consume hardware resources.
- If a session is active, the most recent SQL statement is displayed in the Statement column.
- If a session is idle, Transaction Duration, Statement Duration, and Statement will display
N/A. - To view details of a session, click the Session Duration.
An active session can have an open transaction that is not currently running SQL. In this case, the Statement and Statement Duration columns will display N/A and Transaction Duration will display a value. Transactions that are held open can cause contention.
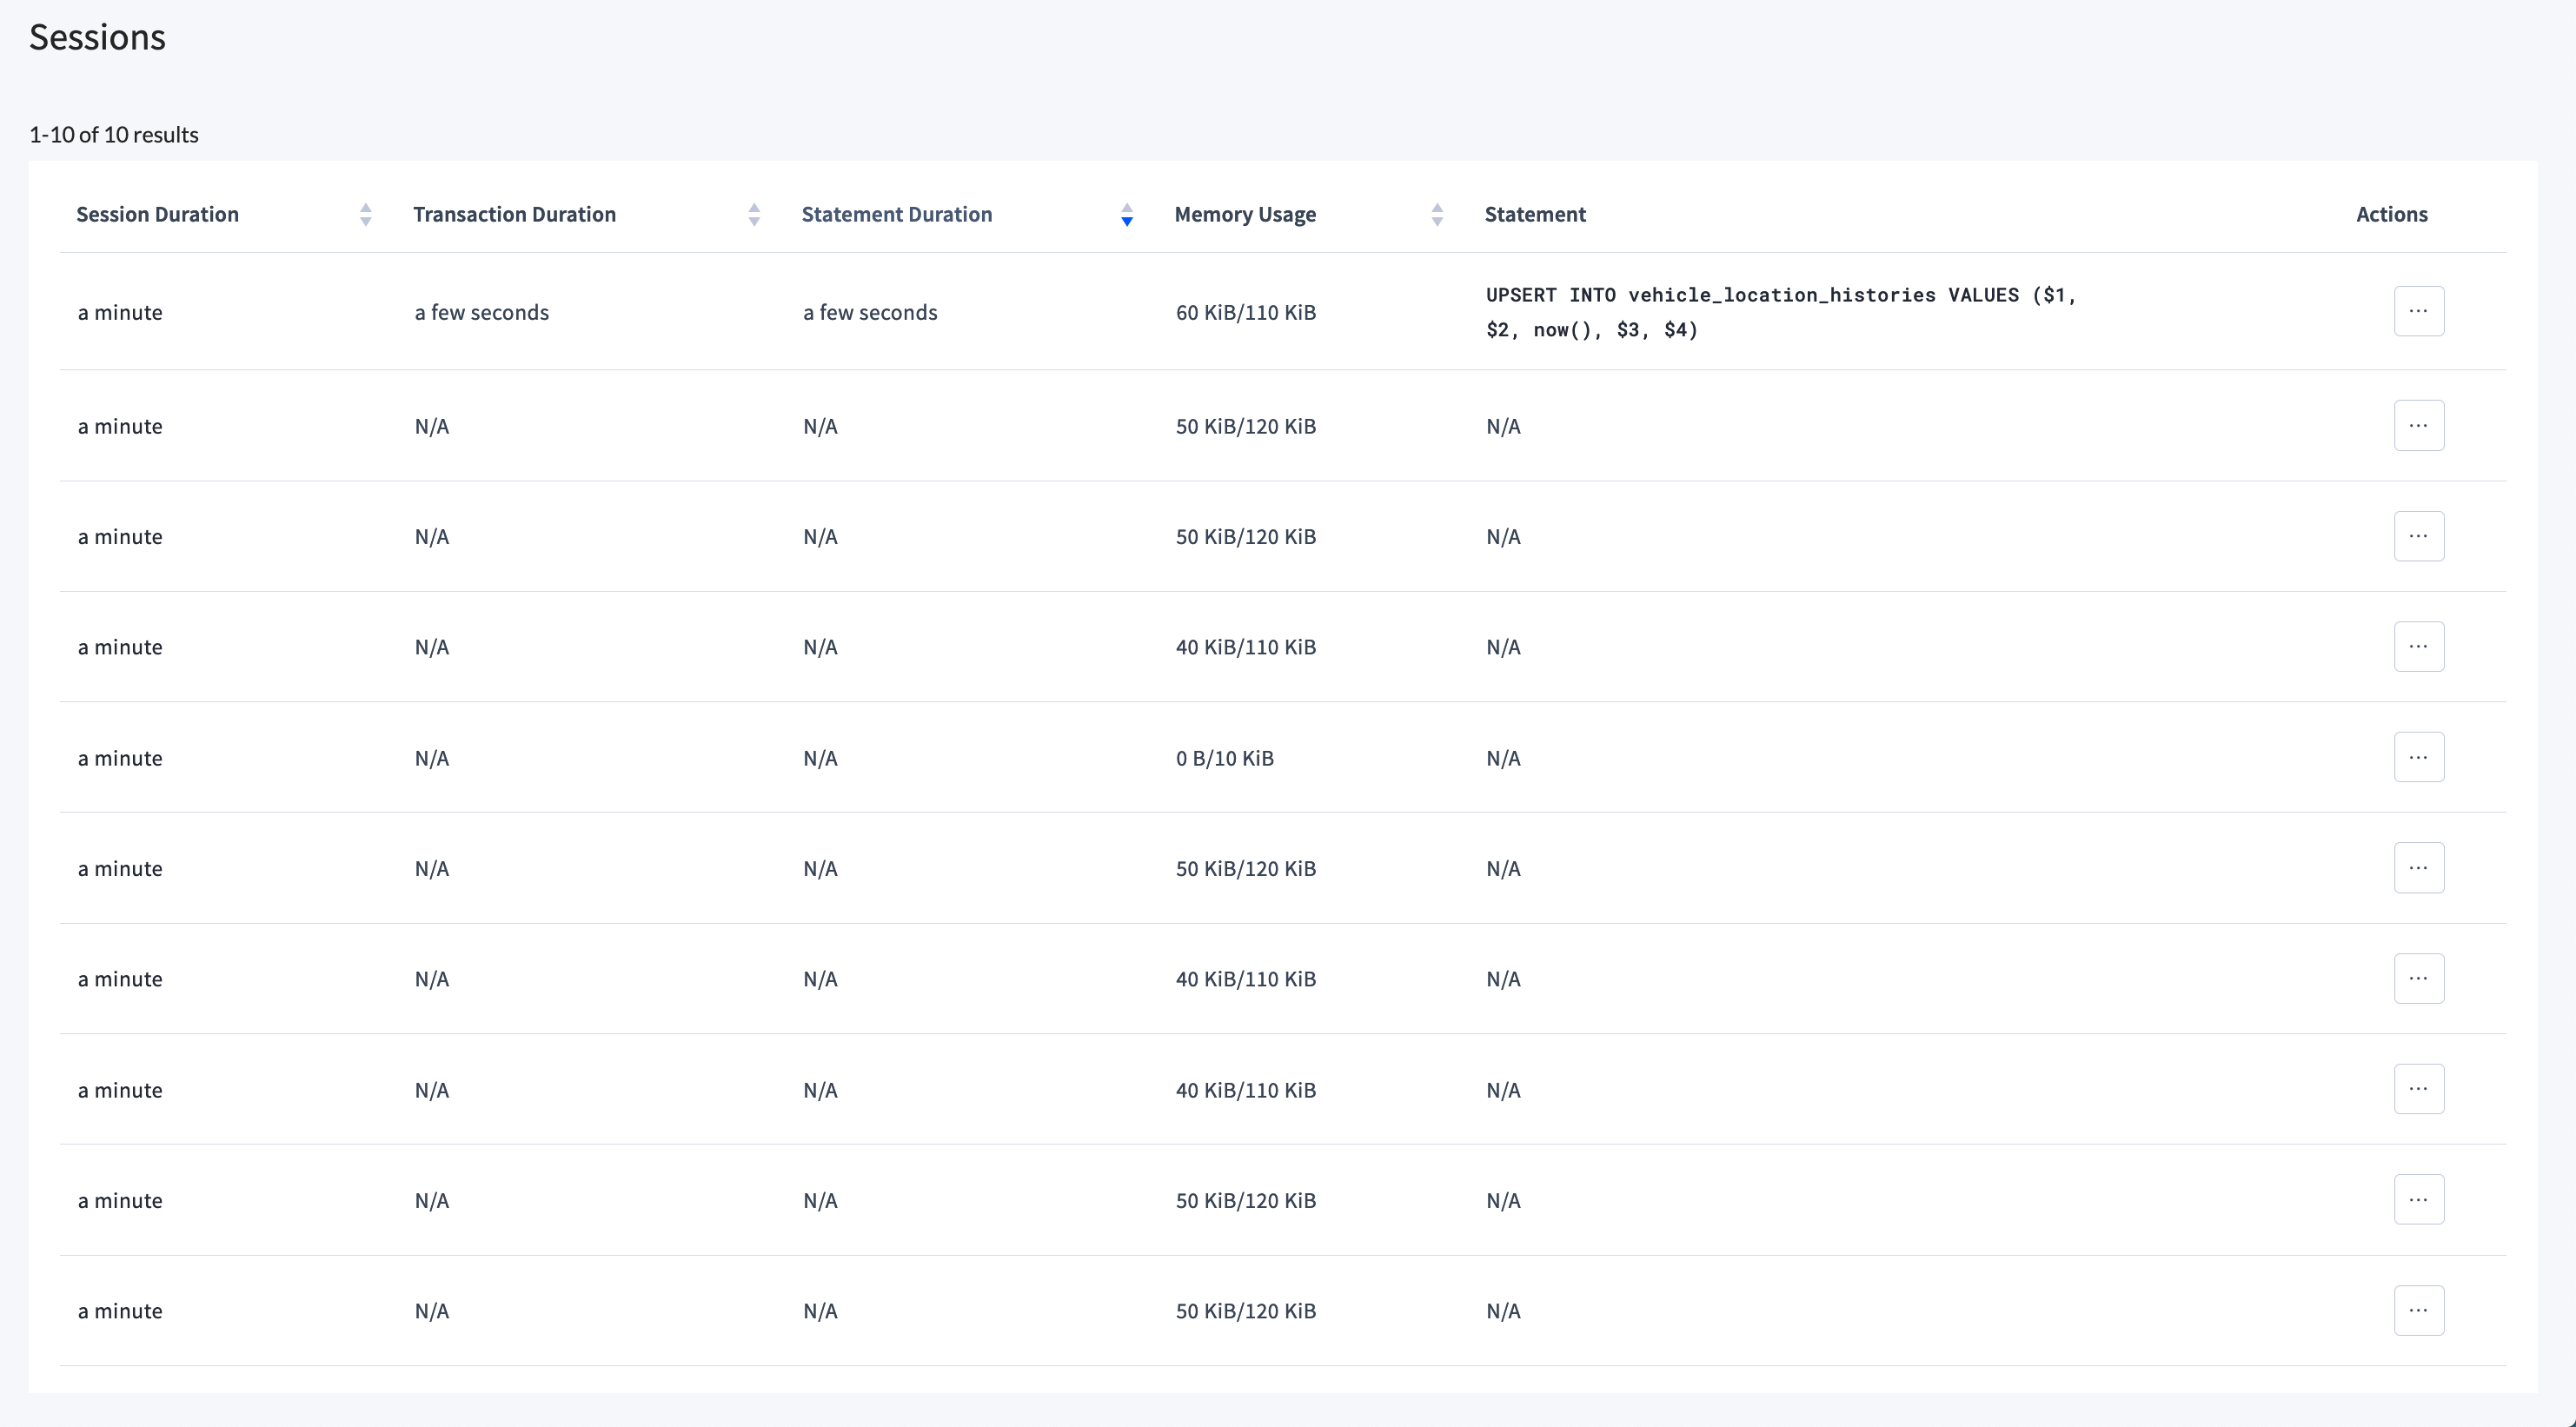
The following are displayed for each active session:
| Parameter | Description |
|---|---|
| Session Duration | Amount of time the session has been open. |
| Transaction Duration | Amount of time the transaction has been active, if there is an open transaction. |
| Statement Duration | Amount of time the SQL statement has been active, if there is an active statement. |
| Memory Usage | Amount of memory currently allocated to this session, followed by the maximum amount of memory this session has ever been allocated. |
| Statement | Active SQL statement. If more than one statement is active, the most recent statement is shown. |
| Actions | Options to terminate the active query and/or terminate the session. These require the CANCELQUERY role option.Terminate Statement: Ends the SQL statement. The session running this statement will receive an error. Terminate Session: Ends the session. The client that holds this session will receive a "connection terminated" event. |
Sort by Transaction Duration to display all active sessions at the top.
Session details
Click the Session Duration of any session to display details and possible actions for that session.
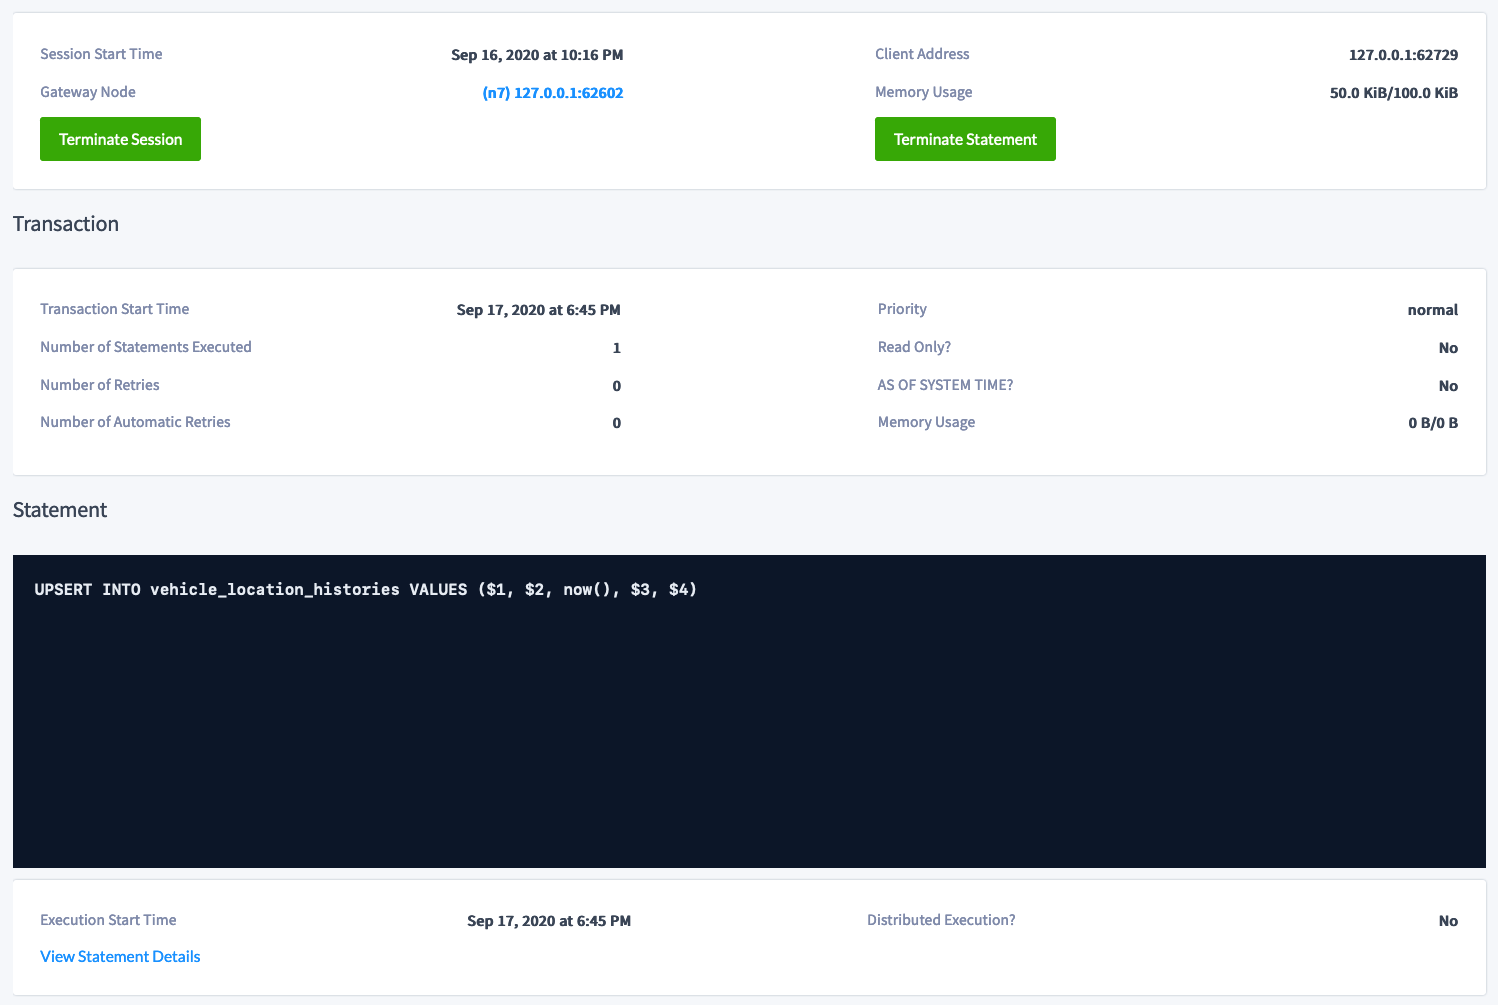
- Session shows the ID of the connected session.
- Session Start Time shows the timestamp at which the session started.
- Gateway Node shows the node ID and IP address/port of the gateway node handling the client connection.
- Client Address shows the IP address/port of the client that opened the session.
- Memory Usage shows the amount of memory currently allocated to this session, followed by the maximum amount of memory this session has ever allocated.
- The Terminate Session button ends the session. The client that holds this session will receive a "connection terminated" event.
- The Terminate Statement button ends the SQL statement. The session running this statement will receive an error.
- Transaction will display the following information for an open transaction.
- Transaction Start Time shows the timestamp at which the transaction started.
- Number of Statements Executed shows the total number of SQL statements executed by the transaction.
- Number of Retries shows the total number of retries for the transaction.
- Number of Automatic Retries shows the total number of automatic retries run by CockroachDB for the transaction.
- Priority shows the priority for the transaction.
- Read Only? shows whether the transaction is read-only.
- AS OF SYSTEM TIME? shows whether the transaction uses
AS OF SYSTEM TIMEto return historical data. - Memory Usage shows the amount of memory currently allocated to this transaction, followed by the maximum amount of memory this transaction has ever allocated.
- Statement will display the following information for an active statement.
- The SQL statement is shown.
- Execution Start Time shows the timestamp at which the statement was run.
- Distributed Execution? shows whether the statement uses Distributed SQL (DistSQL) optimization.
- View Statement Details opens the Statement Details page for the statement.
