Kibana is a platform that visualizes data on the Elastic Stack. Using the CockroachDB module for Metricbeat, metrics exposed by the CockroachDB Prometheus endpoint can be collected by Elasticsearch and visualized with Kibana.
In this tutorial, you will enable the CockroachDB module for Metricbeat and visualize the data in Kibana.
For more information about using the CockroachDB module for Metricbeat, see the Elastic documentation.
If you run into problems with this integration, please file an issue on the Beats issue tracker.
Prerequisites
Either of the following:
- Hosted Elasticsearch Service with Metricbeat configured
- Self-managed Elastic Stack with Metricbeat installed
This tutorial assumes that you have started a secure CockroachDB cluster. Note that CockroachDB Serverless does not currently expose a compatible monitoring endpoint.
Step 1. Enable CockroachDB module
From your Metricbeat installation directory, run:
./metricbeat modules enable cockroachdb
Configure security certificates
Open modules.d/cockroachdb.yml in your Metricbeat installation directory.
Follow the steps in the Elastic documentation to enable SSL on the CockroachDB module.
For example, if you used cockroach cert to secure your cluster, the YAML should look like:
- module: cockroachdb
  metricsets: ['status']
  period: 10s
  hosts: ['localhost:8080']
  enabled: true
  ssl.verification_mode: full
  ssl.certificate_authorities: "/custom/dir/path/ca.crt"
  ssl.certificate: "/custom/dir/path/client.root.crt"
  ssl.key: "/custom/dir/path/client.root.key"
ssl.certificate_authorities, ssl.certificate, and ssl.key should specify the full file paths to your CA certificate, client certificate, and client key, respectively.
Step 2. Start Metricbeat
Load the Kibana dashboards (this may take a few moments):
./metricbeat setup
Launch Metricbeat:
./metricbeat -e
Step 3. View CockroachDB dashboards on Kibana
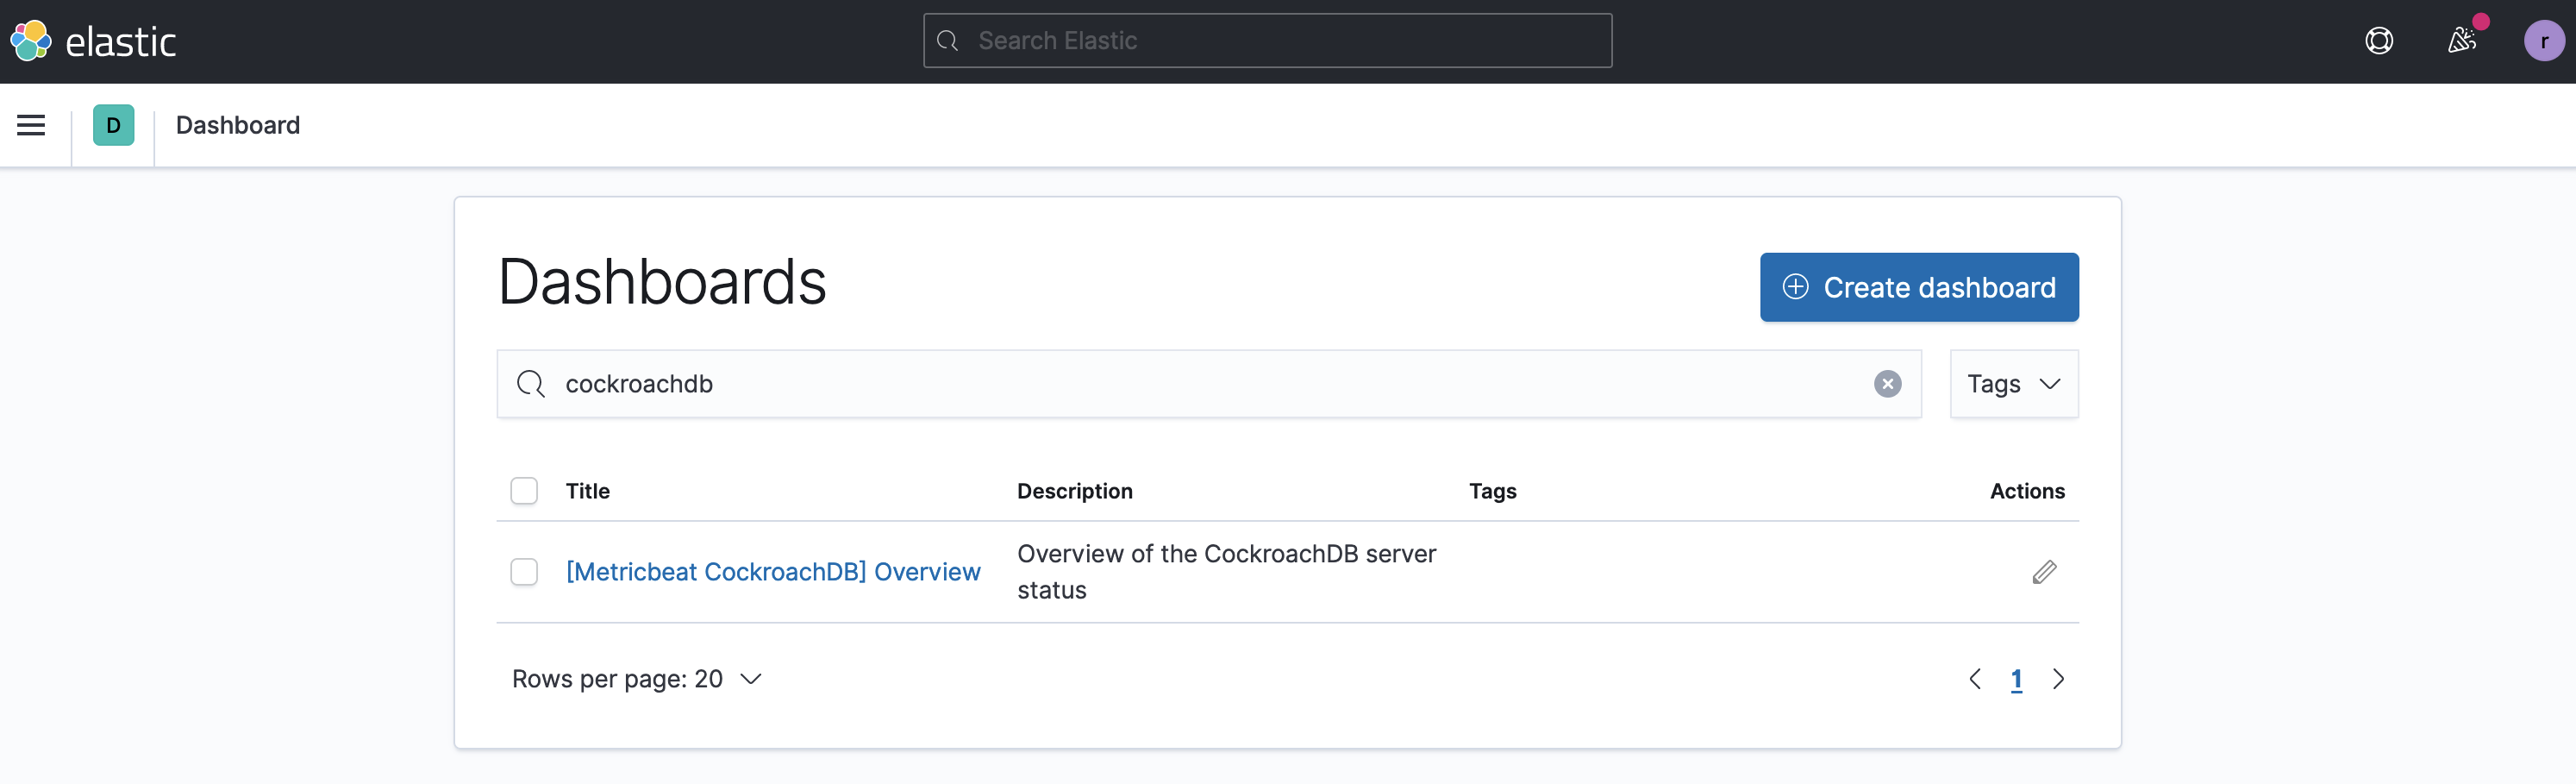
Open the Kibana web interface and click Dashboard.
Search for the CockroachDB dashboard:
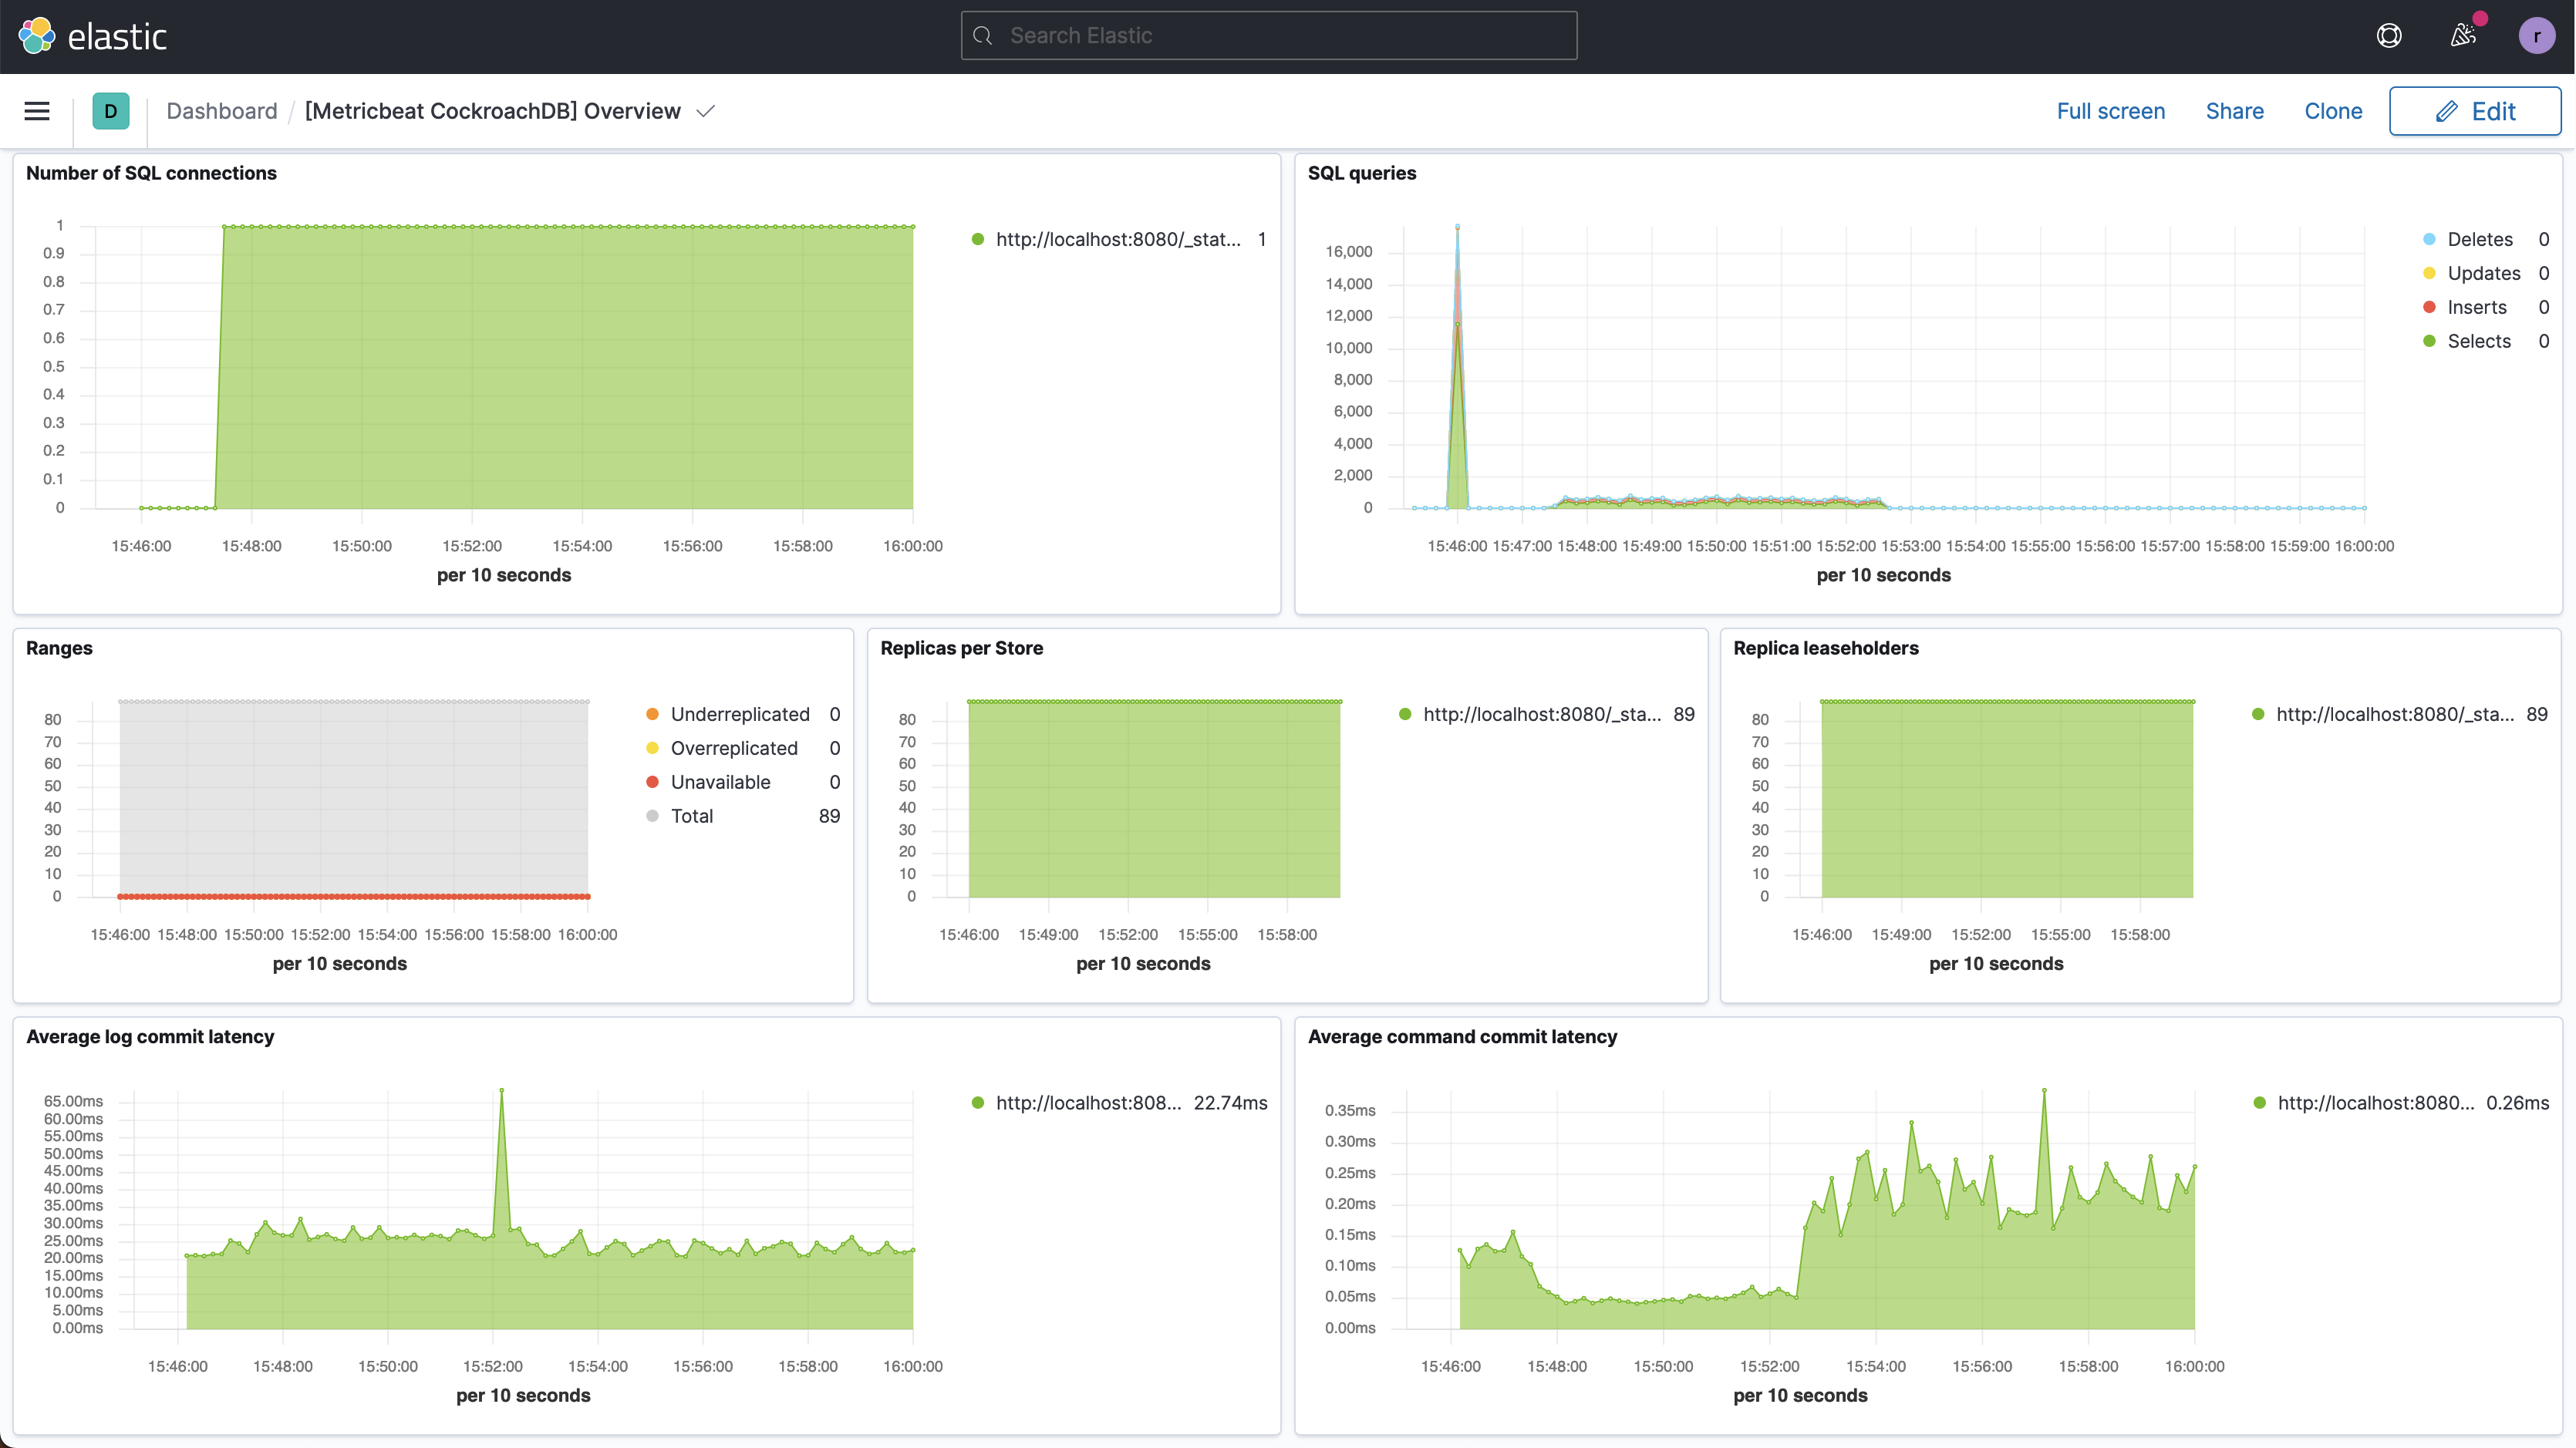
Click the dashboard title to open the dashboard, which presents metrics on replicas and query performance:
Step 4. Run a sample workload
To test the dashboard functionality, use cockroach workload to run a sample workload on the cluster.
Initialize the workload for MovR, a fictional vehicle-sharing company:
cockroach workload init movr 'postgresql://root@localhost:26257?sslcert=certs%2Fclient.root.crt&sslkey=certs%2Fclient.root.key&sslmode=verify-full&sslrootcert=certs%2Fca.crt'
Run the MovR workload for 5 minutes:
cockroach workload run movr --duration=5m 'postgresql://root@localhost:26257?sslcert=certs%2Fclient.root.crt&sslkey=certs%2Fclient.root.key&sslmode=verify-full&sslrootcert=certs%2Fca.crt'
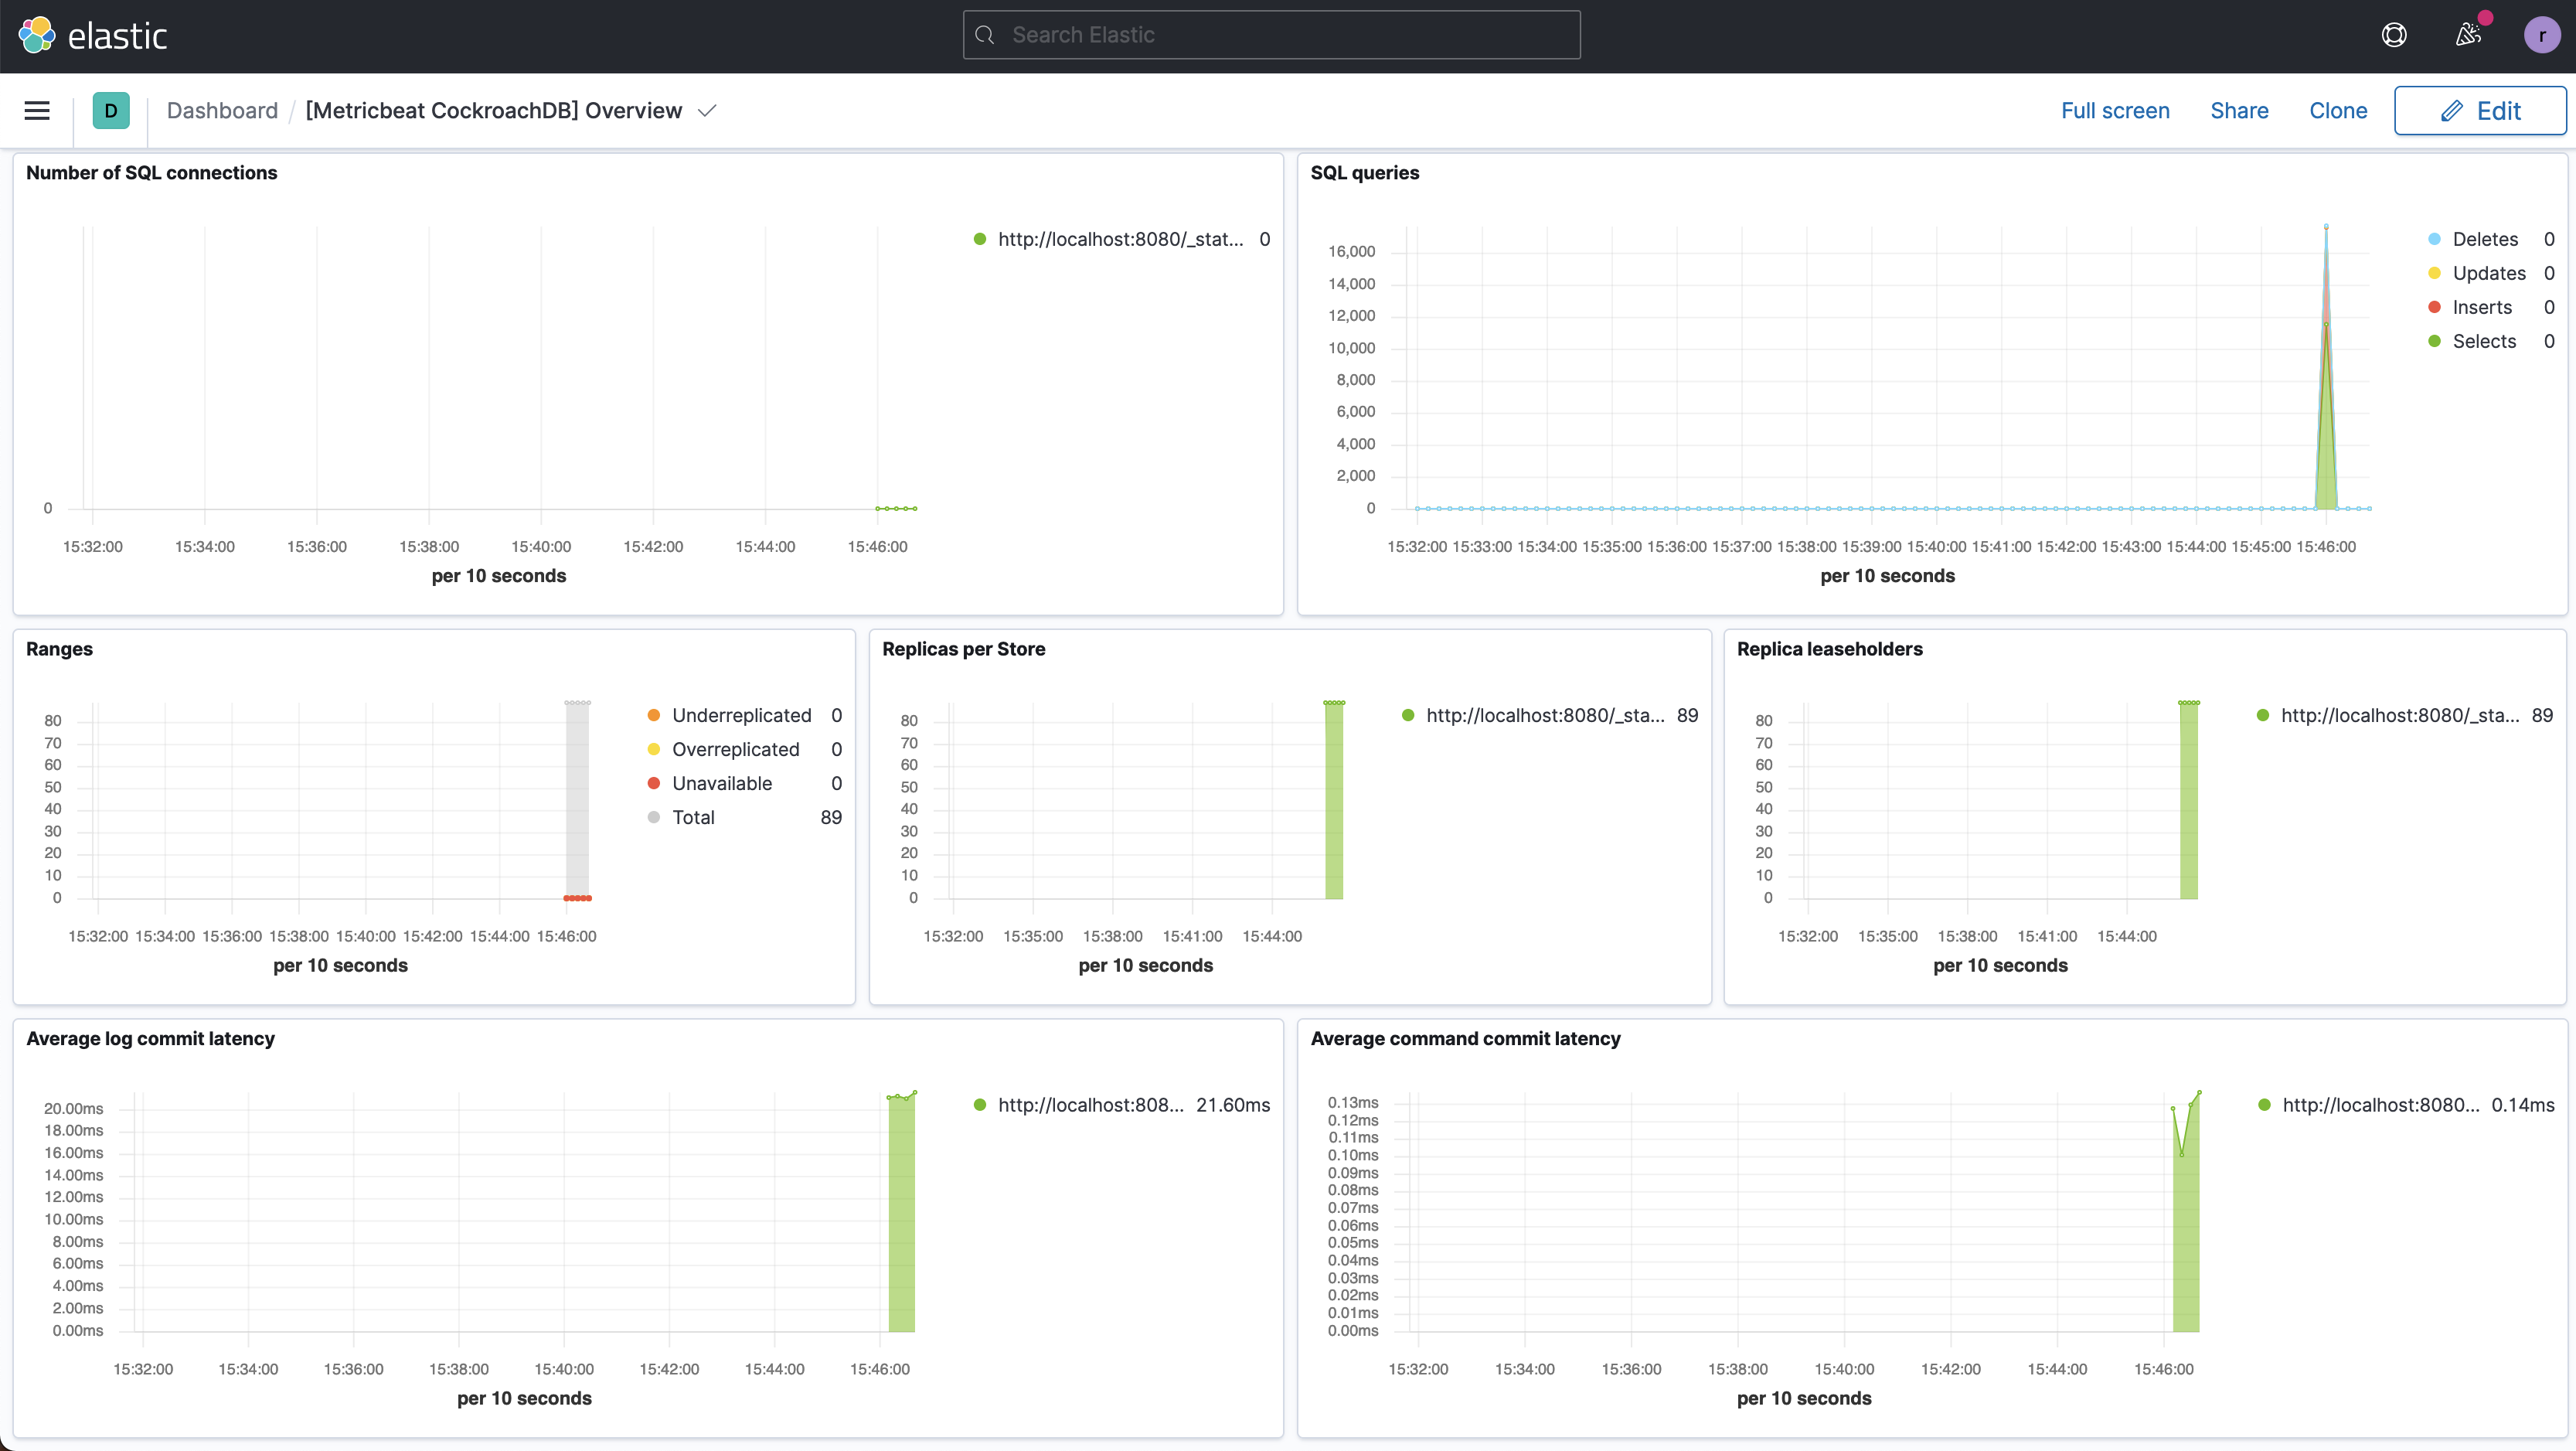
Click Refresh. The query metrics will appear on the dashboard: