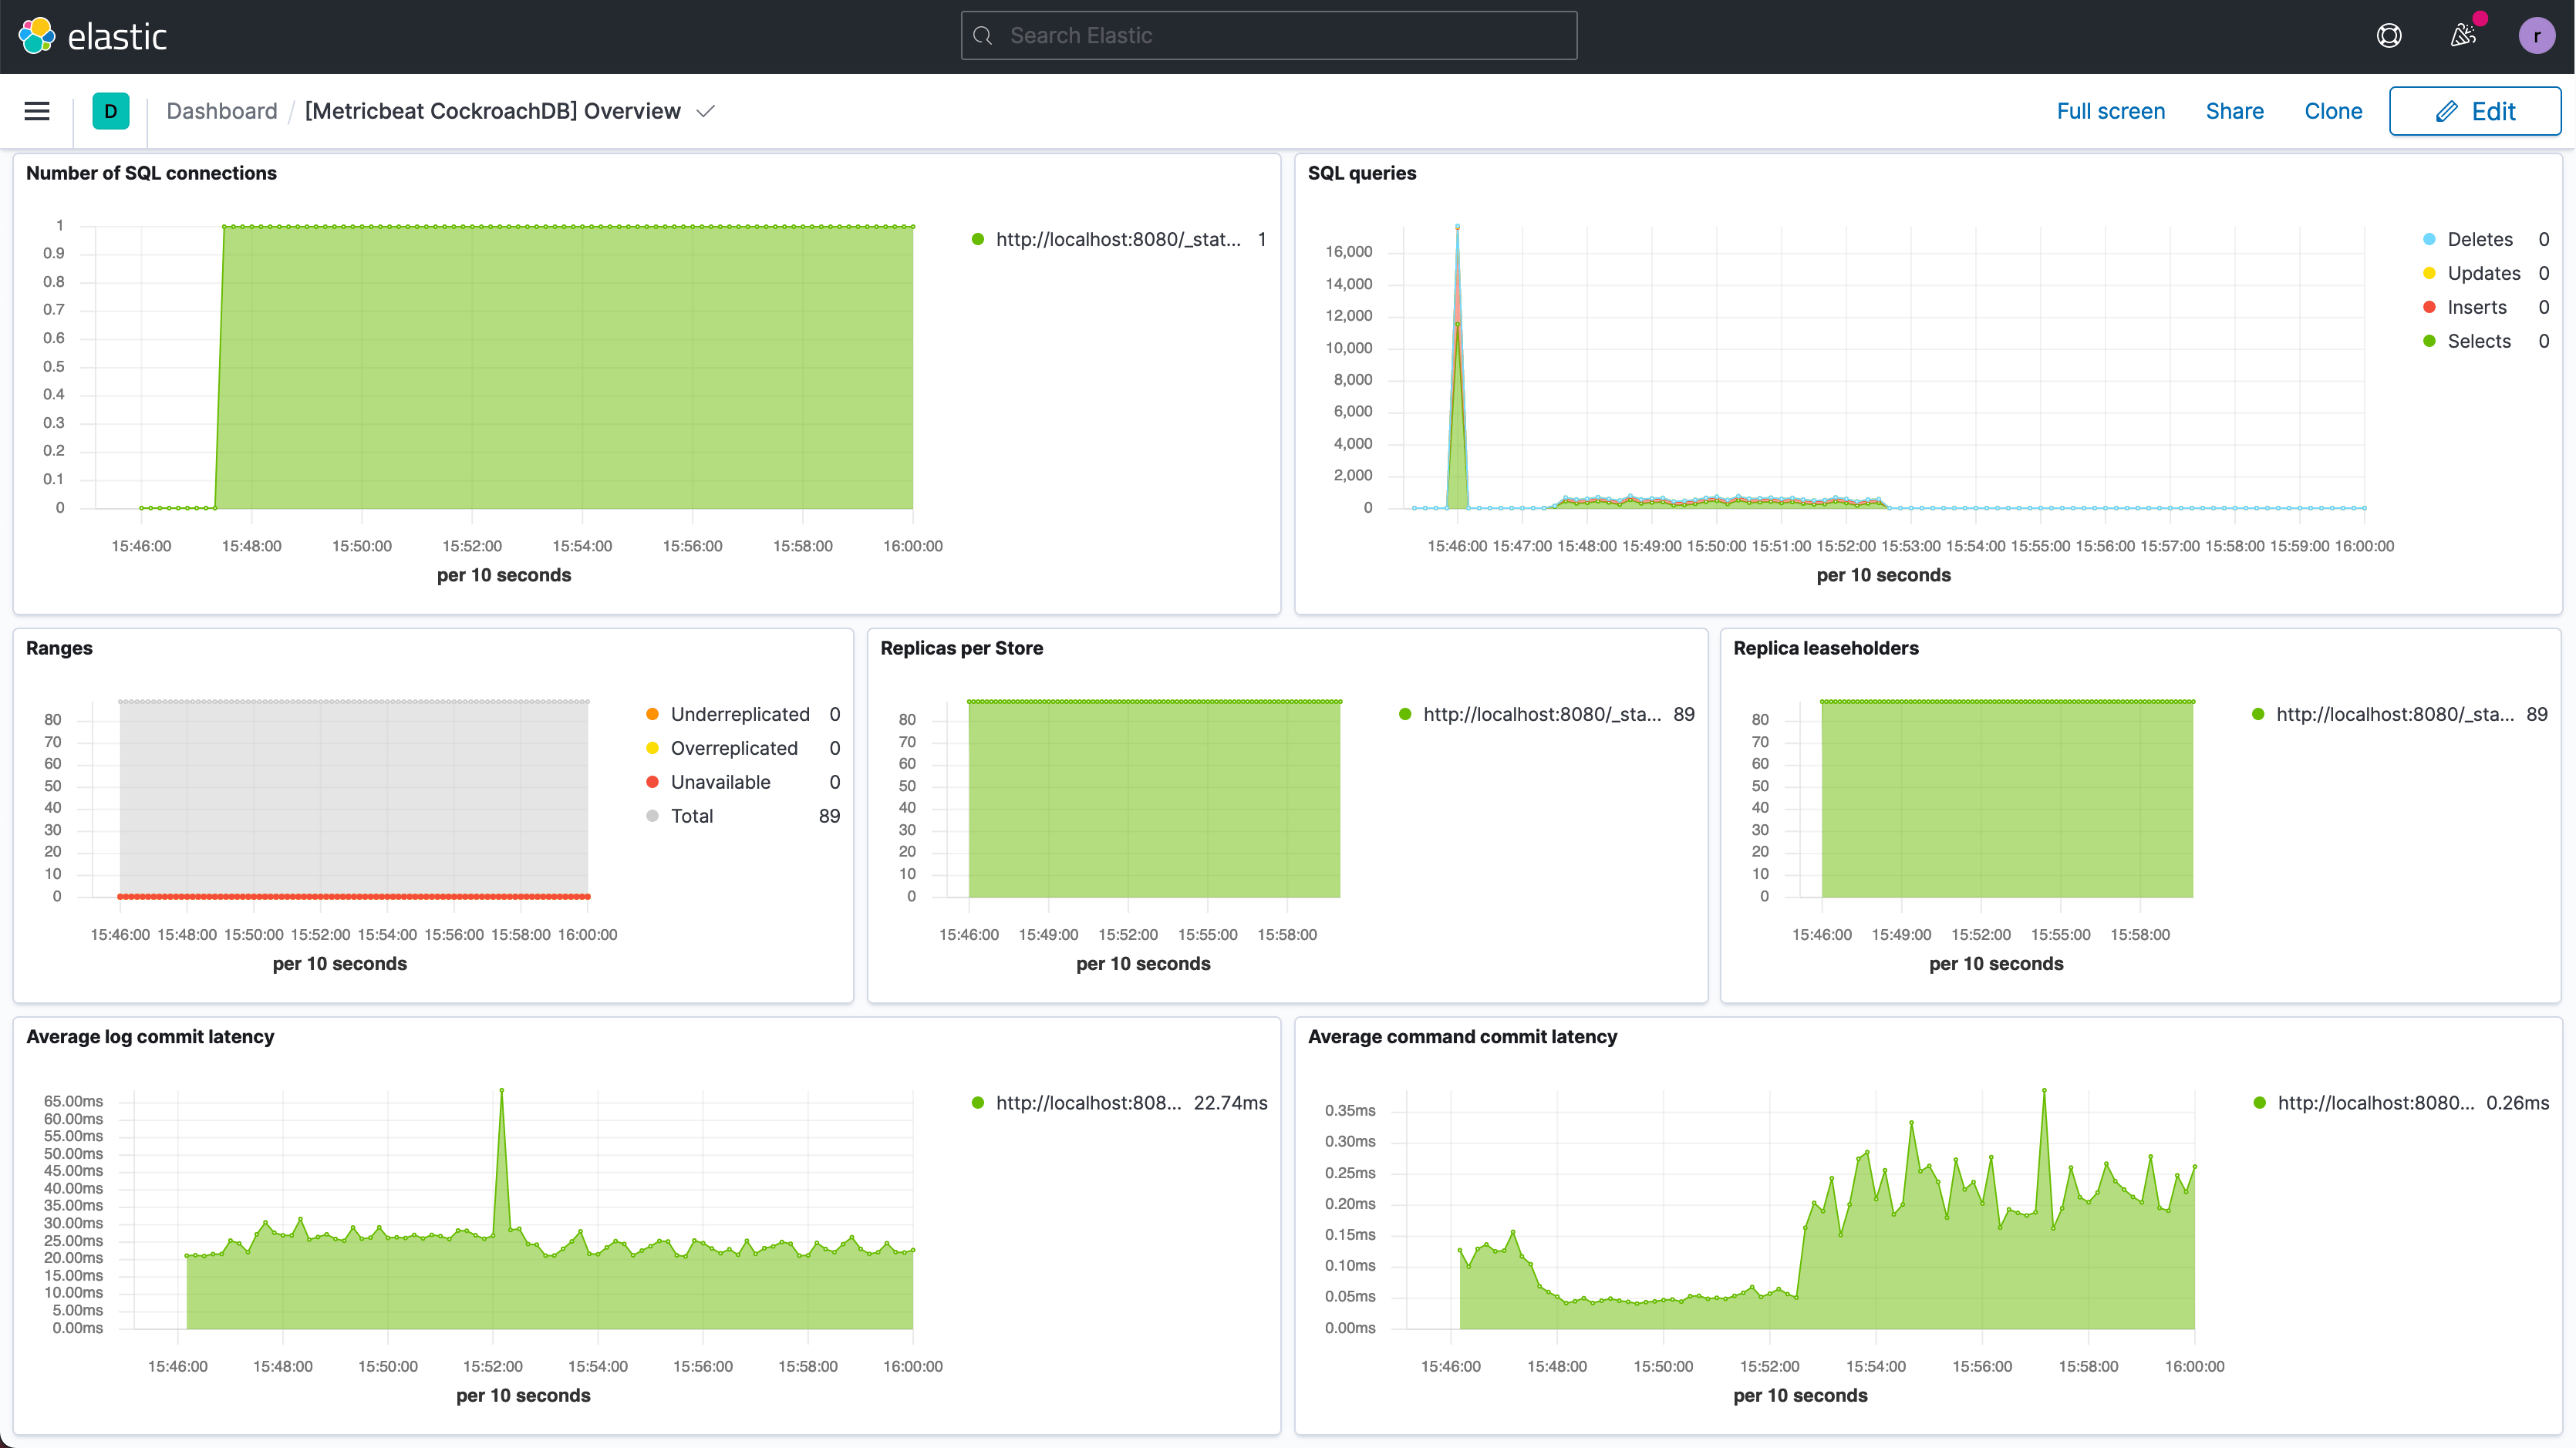
Before you begin
Either of the following:- Hosted Elasticsearch Service with Metricbeat configured
- Self-managed Elastic Stack with Metricbeat installed
This tutorial assumes that you have . does not expose a compatible monitoring endpoint.
Step 1. Enable CockroachDB module
From your Metricbeat installation directory, run:Configure security certificates
Openmodules.d/cockroachdb.yml in your Metricbeat installation directory.
Follow the steps in the Elastic documentation to enable SSL on the CockroachDB module.
For example, if you used to , the YAML should look like:
ssl.certificate_authorities, ssl.certificate, and ssl.key should specify the full file paths to your CA certificate, client certificate, and client key, respectively.
Step 2. Start Metricbeat
Load the Kibana dashboards (this may take a few moments):Step 3. View CockroachDB dashboards on Kibana
Open the Kibana web interface and click Dashboard. Search for the CockroachDB dashboard: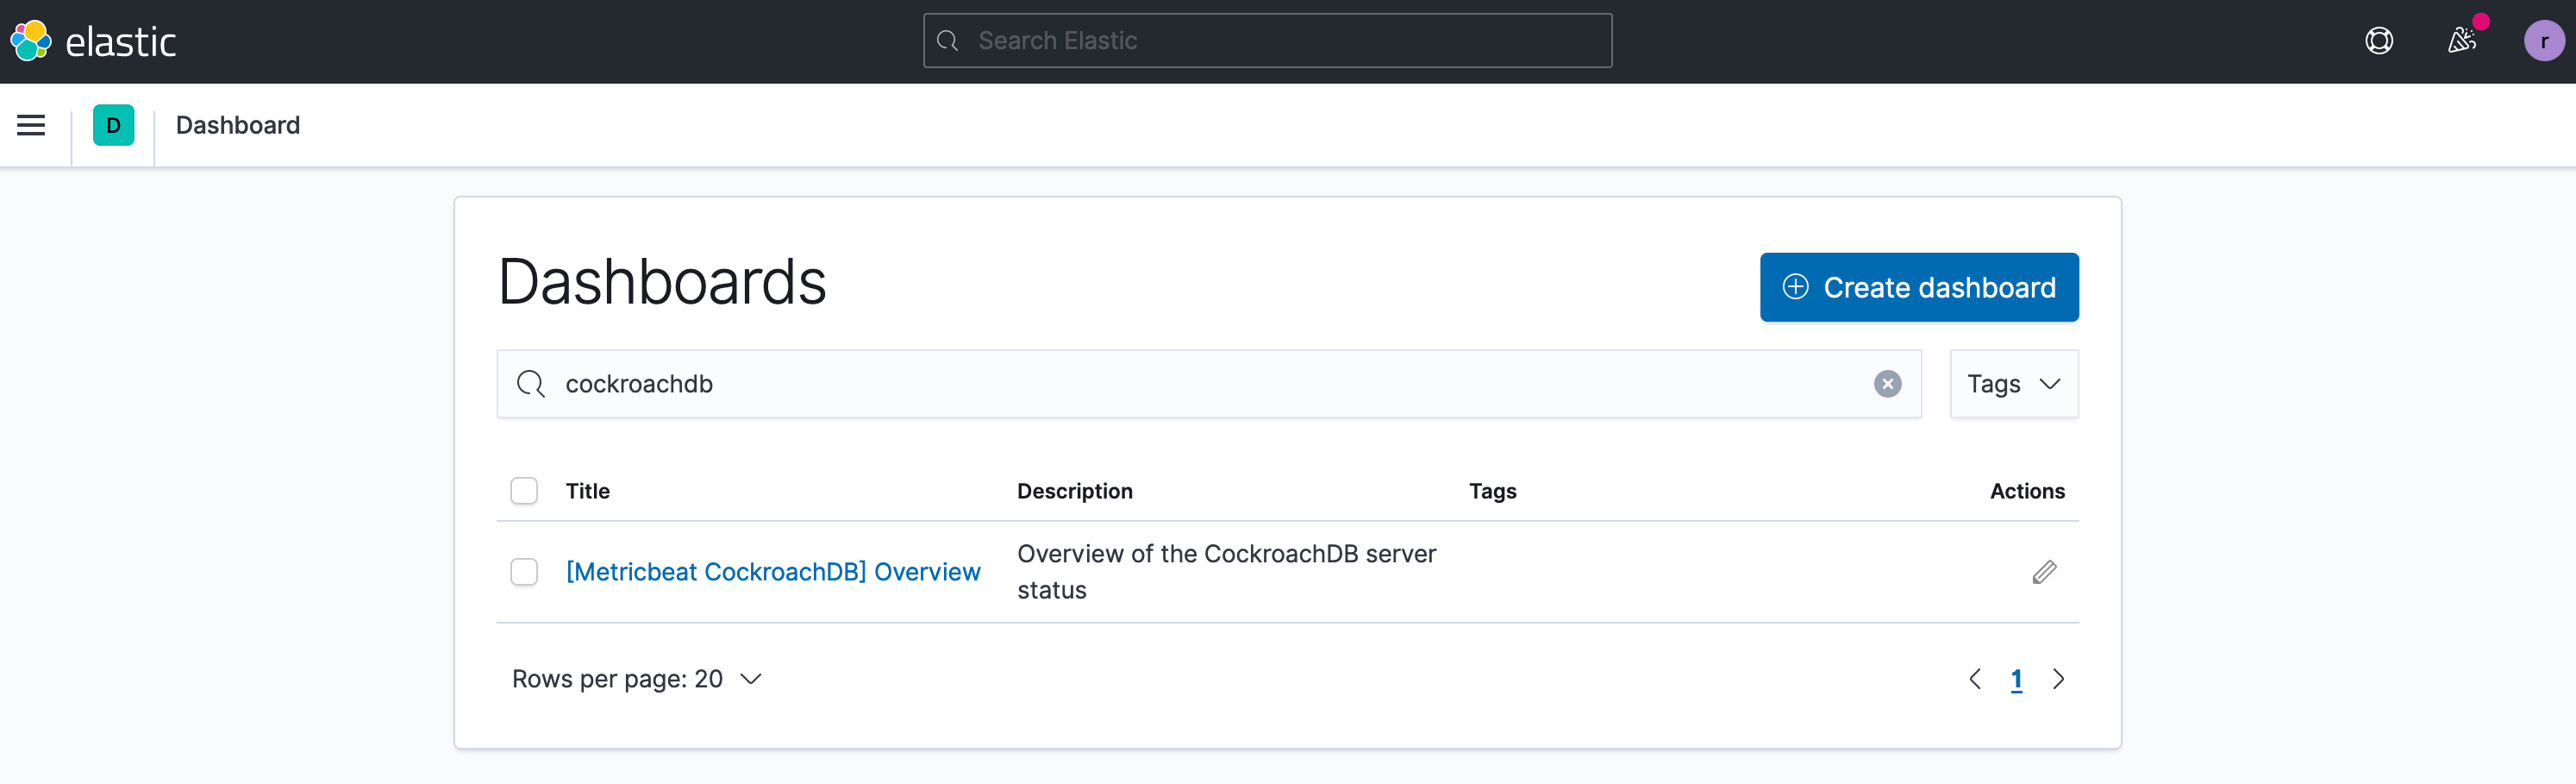
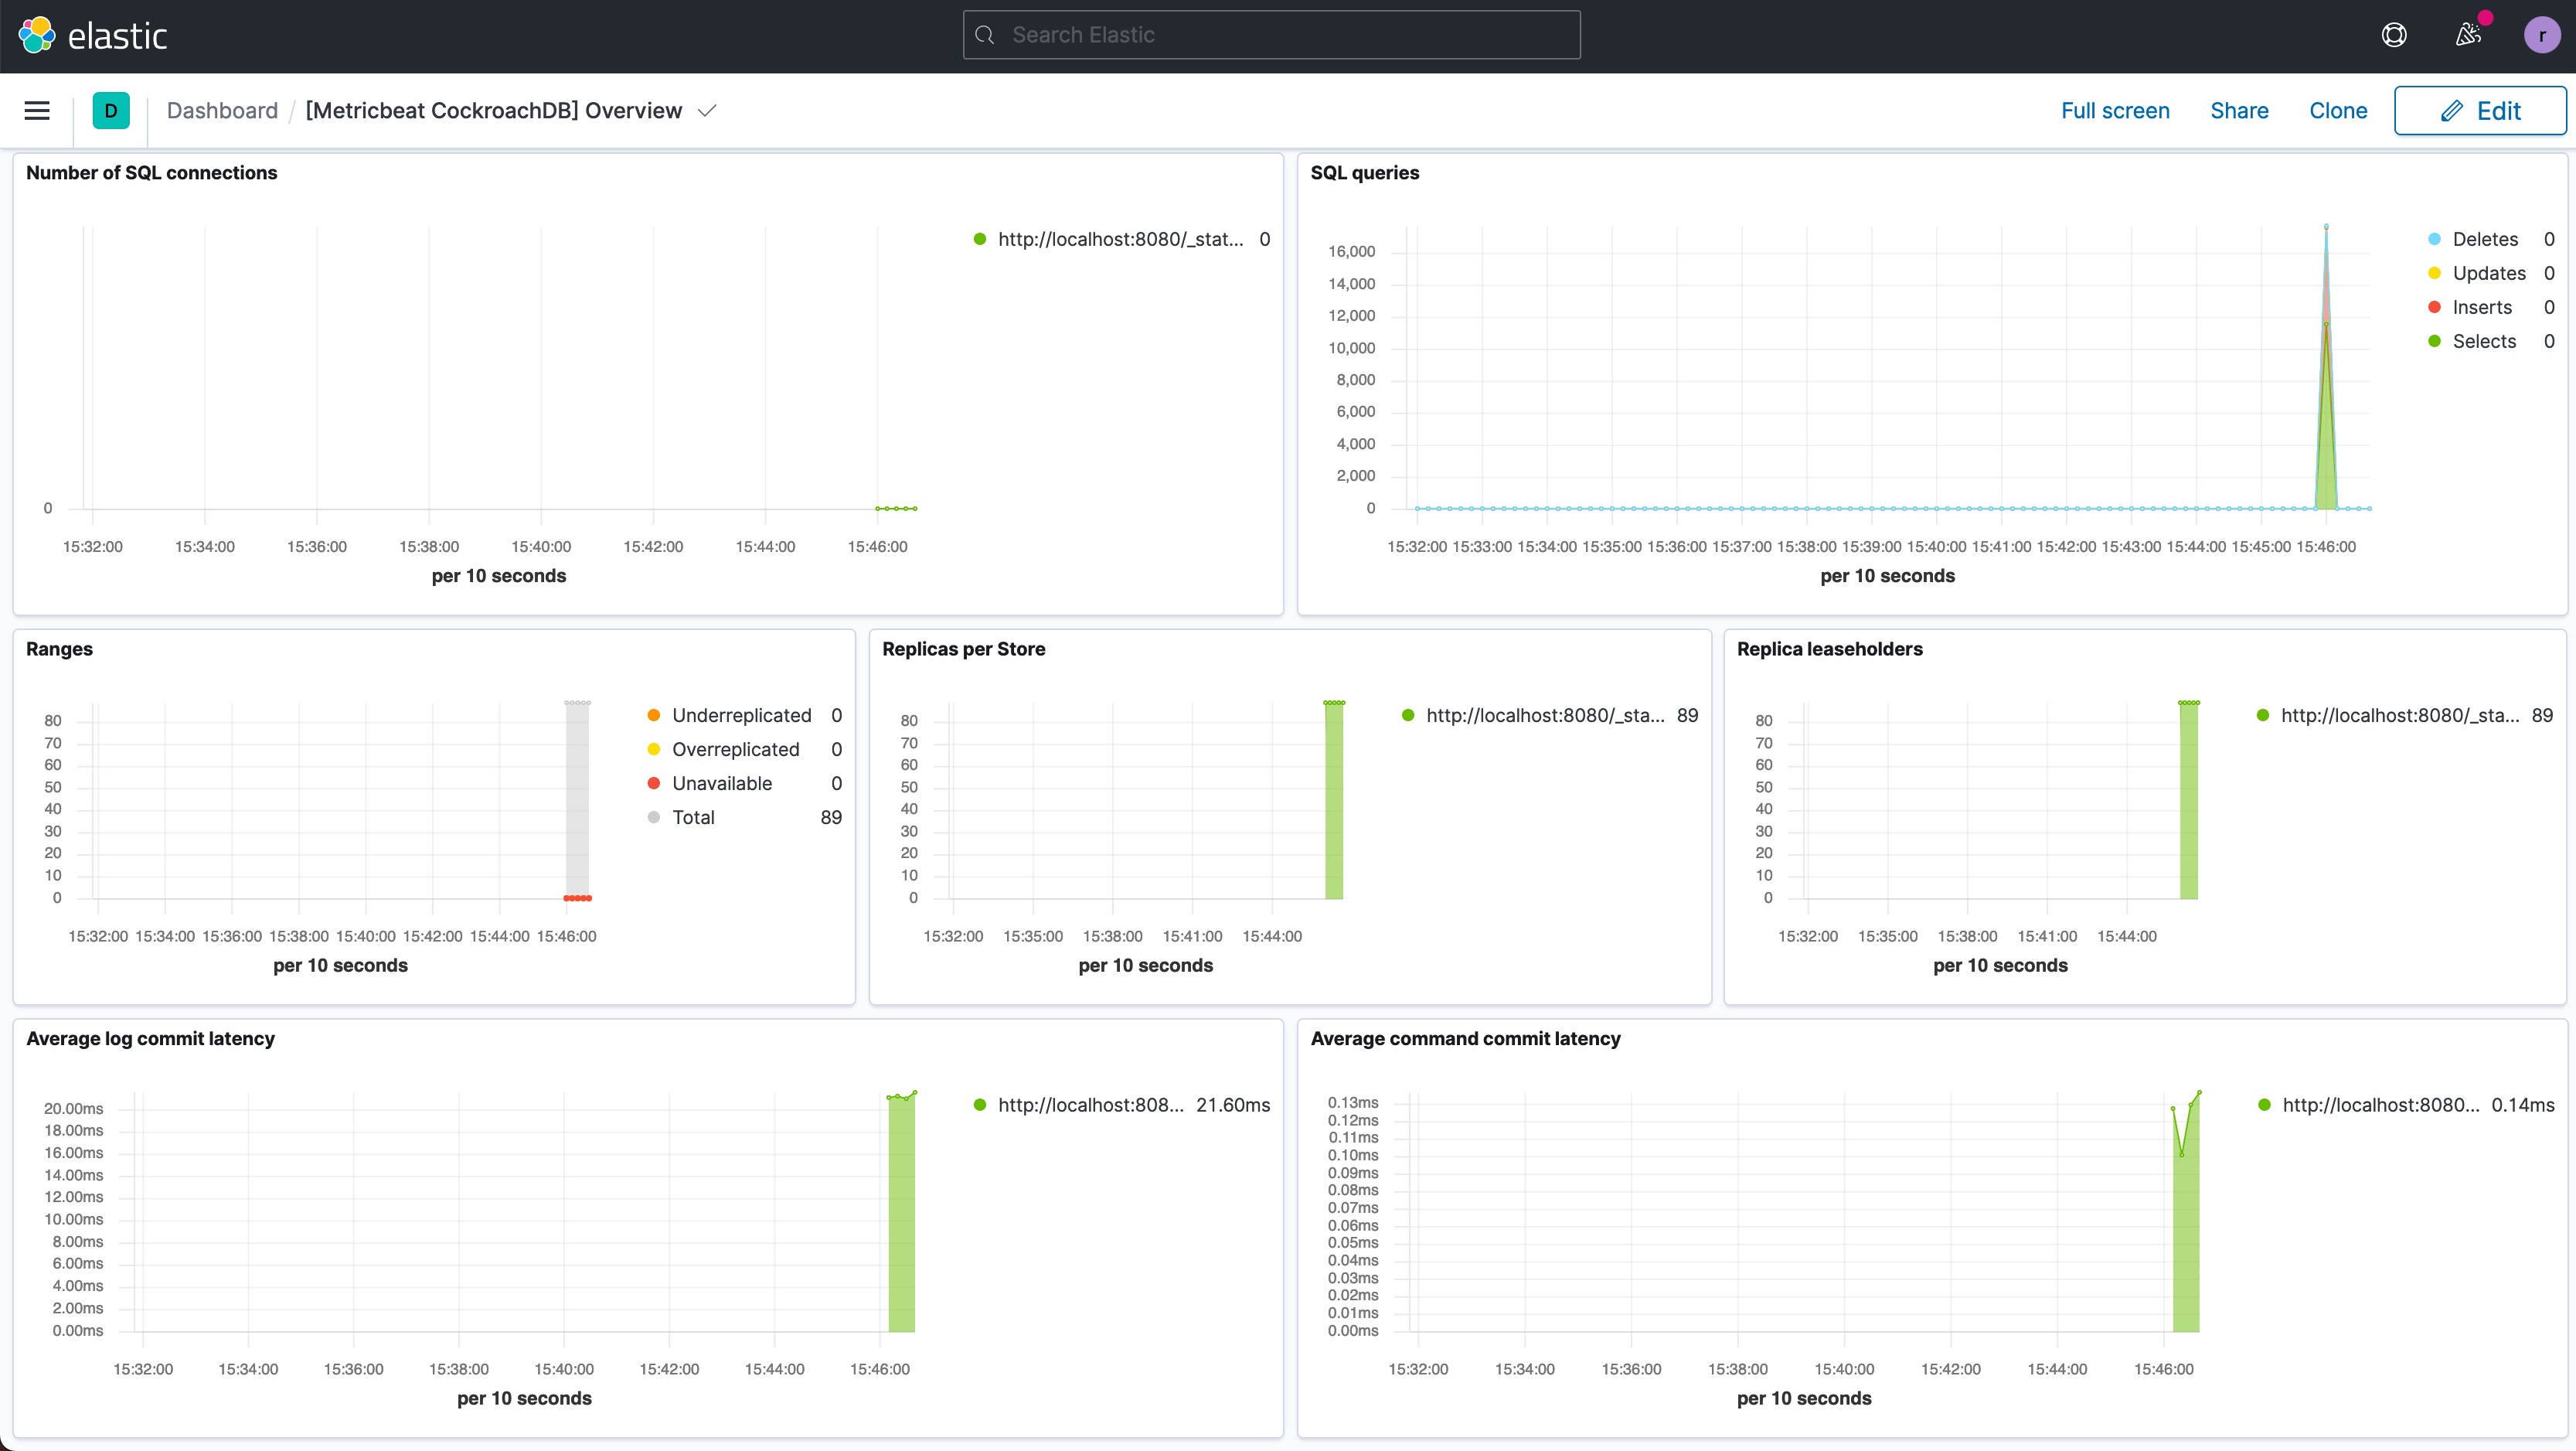
Step 4. Run a sample workload
To test the dashboard functionality, use to run a sample workload on the cluster. Initialize the workload for MovR, a fictional vehicle-sharing company: