
The Cluster Overview page of the Admin UI provides details of the cluster nodes and their liveness status, replication status, uptime, and key hardware metrics. Enterprise users can enable and switch to the Node Map view.
Cluster Overview Panel
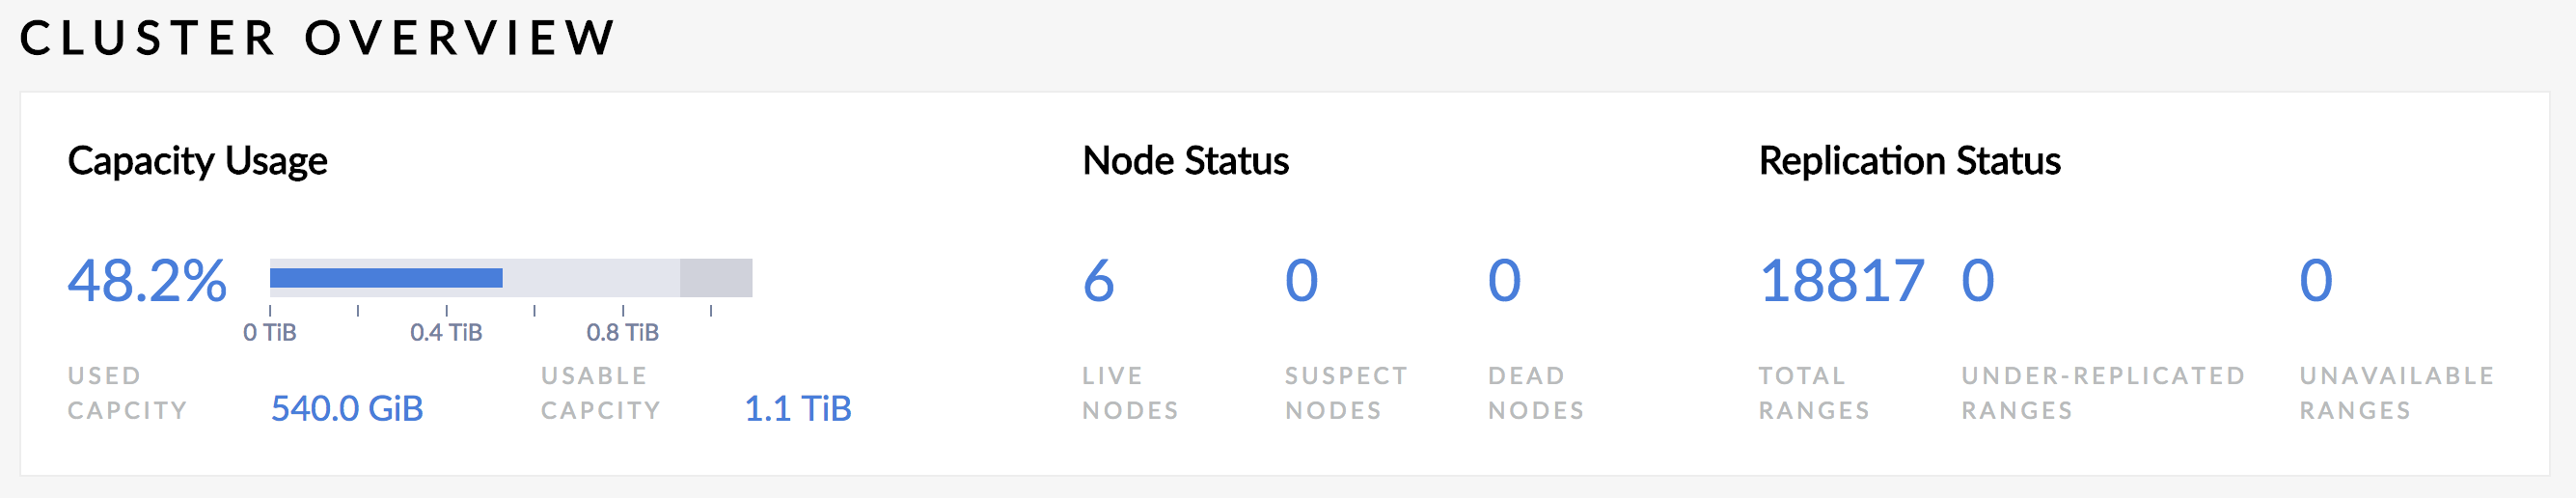
The Cluster Overview panel provides the following metrics:
| Metric | Description |
|---|---|
| Capacity Usage |
|
| Node Status |
|
| Replication Status |
|
Node List
The Node List is the default view on the Overview page.
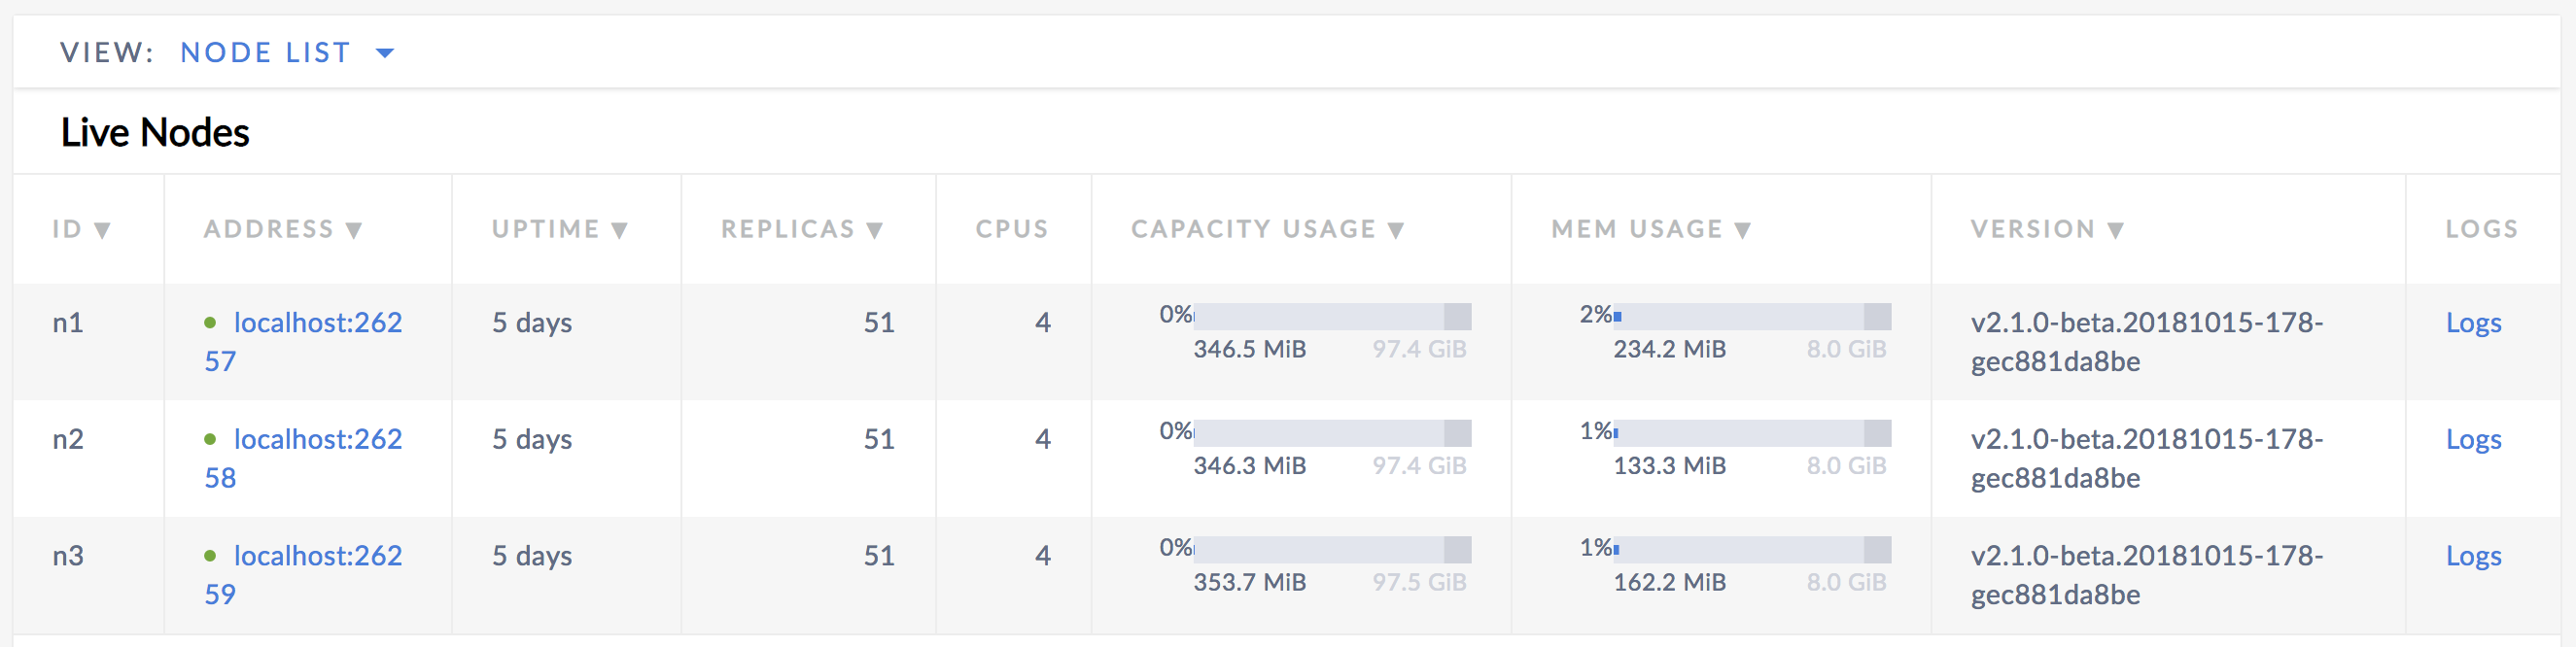
Live Nodes
Live nodes are nodes that are online and responding. They are marked with a green dot. If a node is removed or dies, the dot turns yellow to indicate that it is not responding. If the node remains unresponsive for a certain amount of time (5 minutes by default), the node turns red and is moved to the Dead Nodes section, indicating that it is no longer expected to come back.
The following details are shown for each live node:
| Column | Description |
|---|---|
| ID | The ID of the node. |
| Address | The address of the node. You can click on the address to view further details about the node. |
| Uptime | How long the node has been running. |
| Replicas | The number of replicas on the node. |
| CPUs | The number of CPU cores on the machine. |
| Capacity Usage | The storage capacity used by CockroachDB as a percentage of the total usable capacity on the node. The value is represented numerically and as a bar graph. |
| Mem Usage | The memory used by CockroachDB as a percentage of the total memory on the node. The value is represented numerically and as a bar graph. |
| Version | The build tag of the CockroachDB version installed on the node. |
| Logs | Click Logs to see detailed logs for the node. |
Dead Nodes
Nodes are considered dead once they have not responded for a certain amount of time (5 minutes by default). At this point, the automated repair process starts, wherein CockroachDB automatically rebalances replicas from the dead node, using the unaffected replicas as sources. See Stop a Node for more information.
The following details are shown for each dead node:
| Column | Description |
|---|---|
| ID | The ID of the node. |
| Address | The address of the node. You can click on the address to view further details about the node. |
| Down Since | How long the node has been down. |
Decommissioned Nodes
Nodes that have been decommissioned for permanent removal from the cluster are listed in the Decommissioned Nodes table.
When you decommission a node, CockroachDB lets the node finish in-flight requests, rejects any new requests, and transfers all range replicas and range leases off the node so that it can be safely shut down. See Remove Nodes for more information.
Node Map (Enterprise)
The Node Map is an enterprise-only feature that gives you a visual representation of the geographical configuration of your cluster.
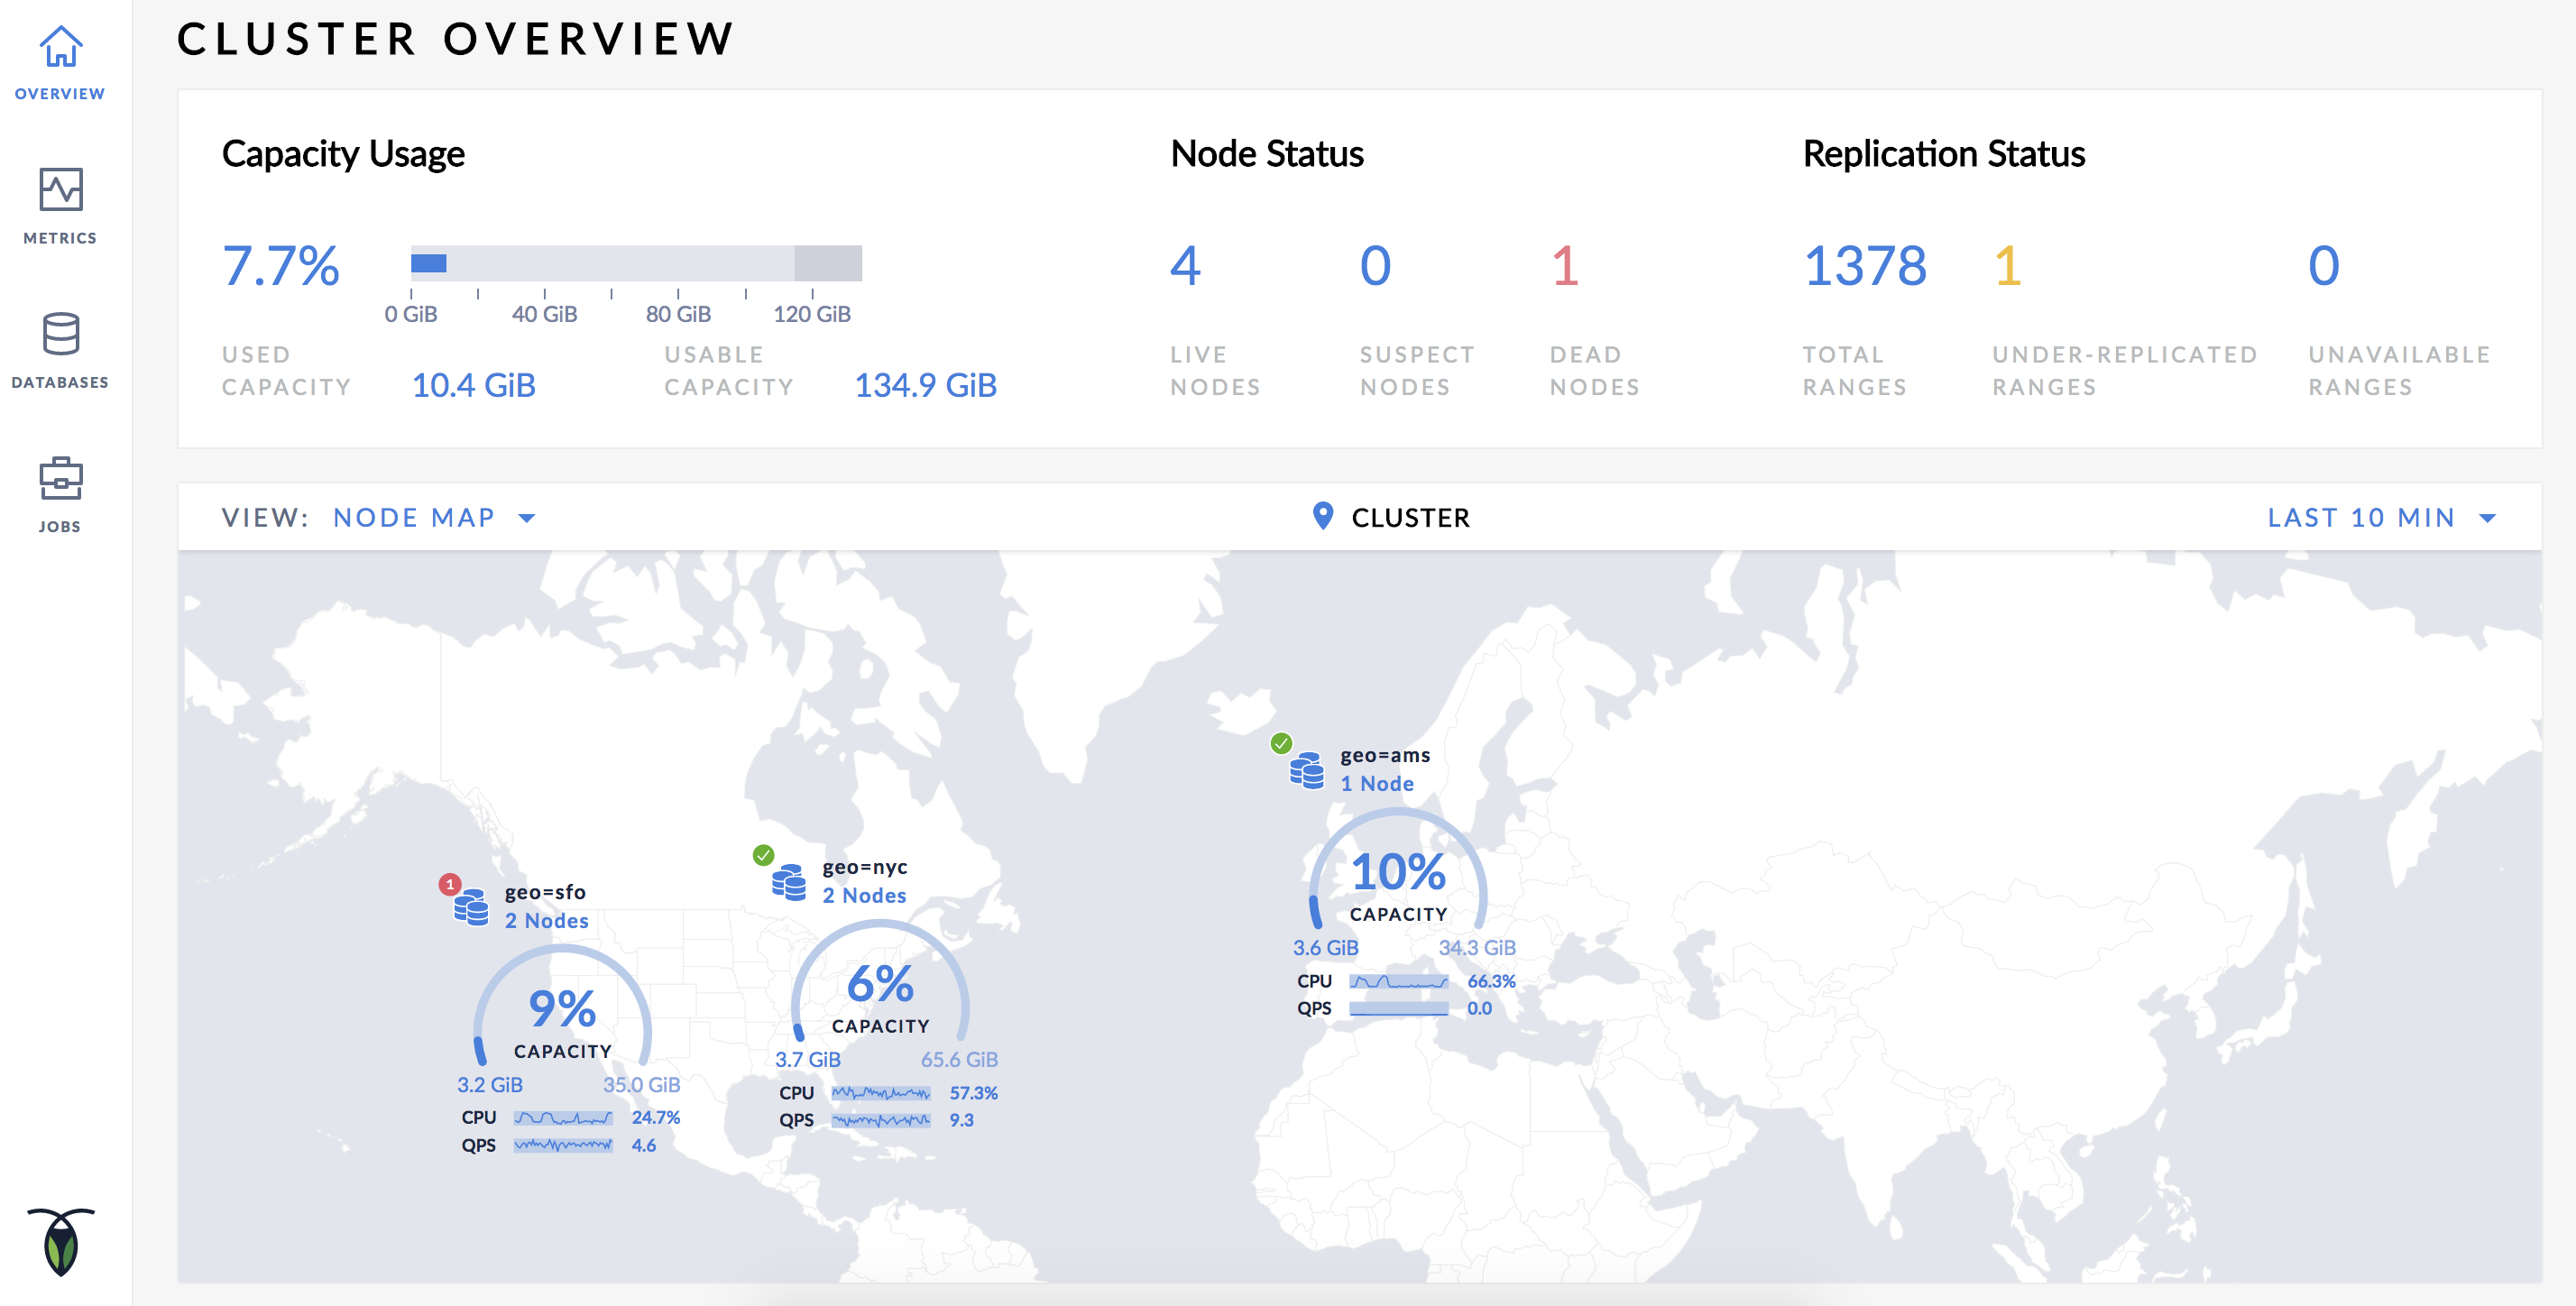
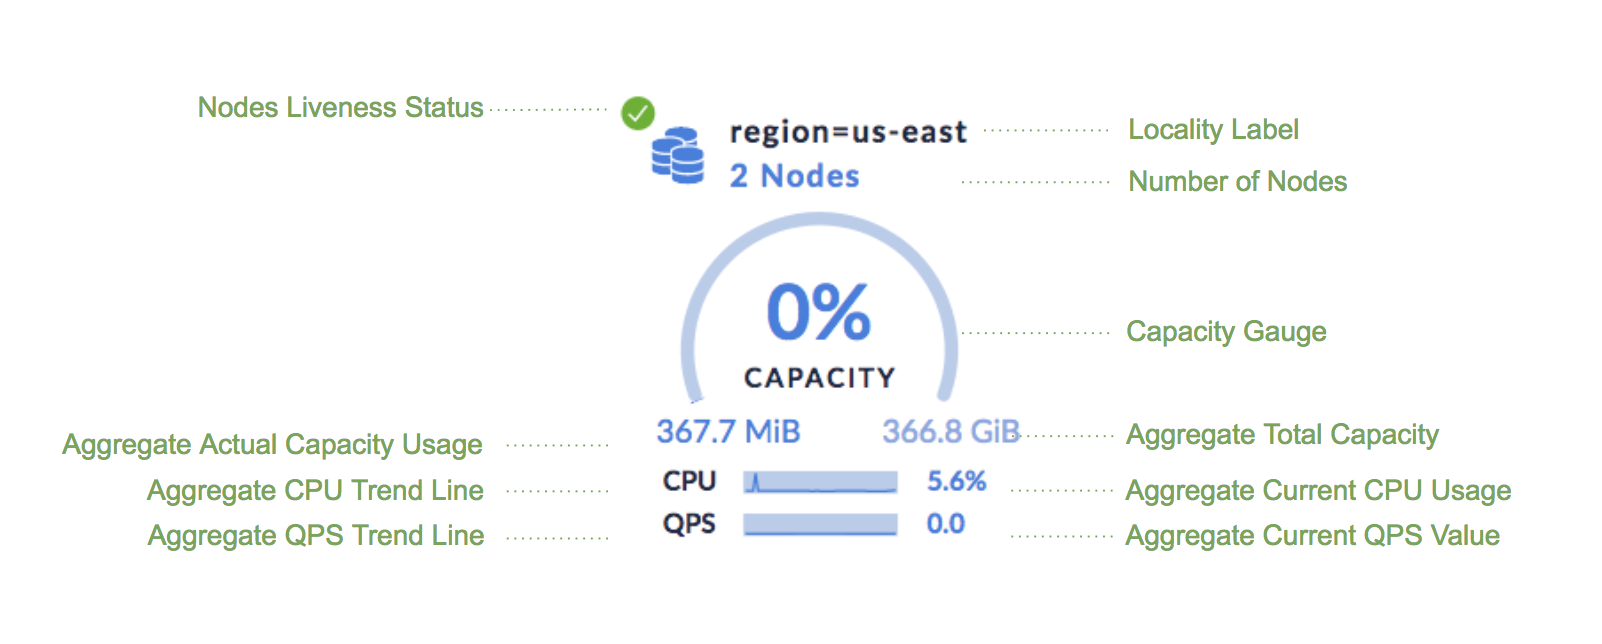
The Node Map consists of the following components:
Region component
For multi-core systems, the user CPU percent can be greater than 100%. Full utilization of one core is considered as 100% CPU usage. If you have n cores, then the user CPU percent can range from 0% (indicating an idle system) to (n*100)% (indicating full utilization).
Node component
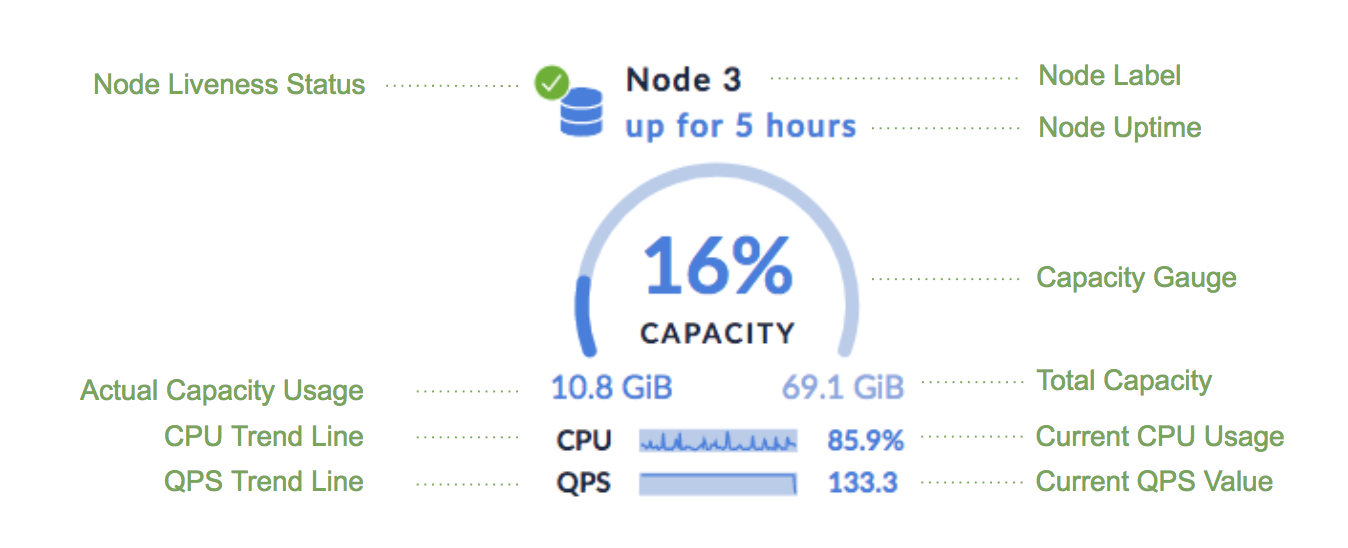
For multi-core systems, the user CPU percent can be greater than 100%. Full utilization of one core is considered as 100% CPU usage. If you have n cores, then the user CPU percent can range from 0% (indicating an idle system) to (n*100)% (indicating full utilization).
For guidance on enabling and using the node map, see Enable Node Map.
