
On a secure cluster you must be an admin user to access this area of the DB Console. See DB Console security.
The Transactions page helps you:
- Identify frequently retried transactions.
- Troubleshoot high latency transactions or execution failures.
- View transaction details.
In contrast to the Statements page, which displays SQL statement fingerprints, the Transactions page displays SQL statement fingerprints grouped by transaction.
To view this page, click SQL Activity in the left-hand navigation of the DB Console. Click the Transactions tab.
Search and filter
By default, this page shows transactions from all applications and databases running on the cluster.
You can search for transactions using the search field or the date range selector.
Search field
To search using the search field, type a string over Search Transactions and press Enter. The list of transactions is filtered by the string.
Date range
To search by date, click the date range selector and pick a date range that is within the time period. Click reset time to reset the date to the last hour.
It's possible to select a date range for which no transaction statistics exist. CockroachDB persists transaction statistics up to 1 million rows before the oldest row is deleted. The retention period of statistics is reduced the more active a workload is and the more distinct transaction fingerprints there are.
Filter
To filter the transactions by application_name, select App and choose one or more applications. When no application is selected internal transactions are not displayed.
- Internal transactions are displayed under the
$ internalapp. - Transactions from the SQL shell are displayed under the
$ cockroachapp. - If you haven't set
application_namein a client connection string, it appears asunset.
To filter transactions in which a SQL statement fingerprint exceeds a specified latency value, fill in the fields in Query fingerprint runs longer than.
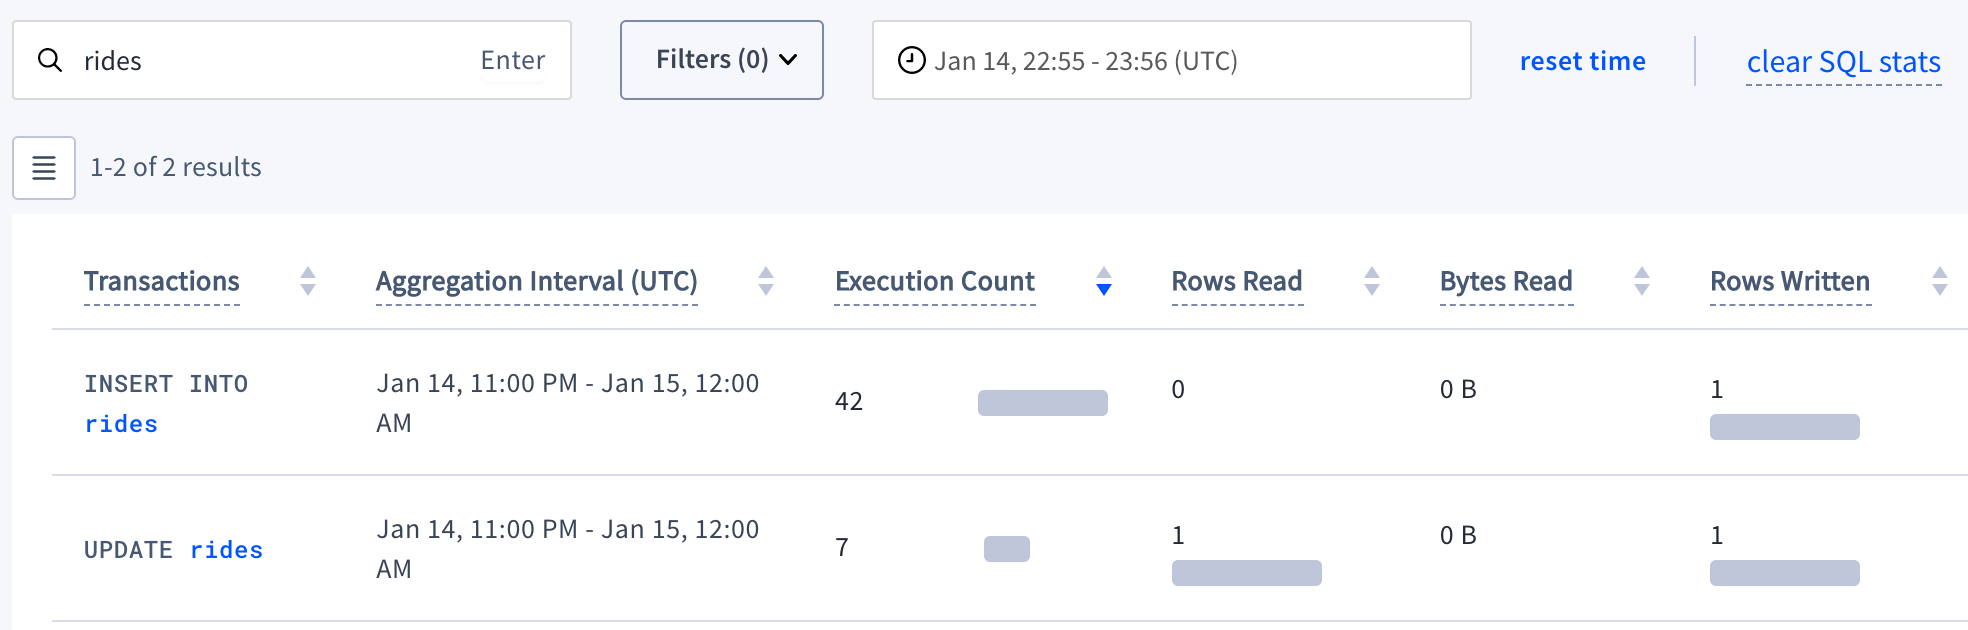
The following screenshot shows the transactions that contain the string rides for the movr application:
Transaction statistics
Statistics aggregation is controlled by the aggregation interval property, set to 1 hour. Statistics between two hourly intervals belong to the nearest hour rounded down. For example, a statement execution ending at 1:50 would have its statistics aggregated in the 1:00-2:00 interval.
Aggregated statistics are flushed from memory to statistics tables in the crdb_internal system catalog every 10 minutes. The default retention period of the statistics tables is based on the number of rows up to 1 million records. When this threshold is reached, the oldest records are deleted.
To reset SQL statistics in the DB Console UI and crdb_internal system catalog, click clear SQL stats.
The diagnostics.sql_stat_reset.interval cluster setting no longer controls the DB Console UI or the persisted statistics tables. diagnostics.sql_stat_reset.interval still resets the node_statement_statistics and node_transaction_statistics in-memory statistics.
For an example of querying the statistics table, see Example.
If you haven't yet executed any transactions in the cluster as a user, this page will be blank.
Transactions table
Click  to select the columns to display in the table.
The Transactions table gives details for each SQL statement fingerprint in the transaction:
| Column | Description |
|---|---|
| Transactions | The SQL statement fingerprints that make up the transaction. To view the transaction fingerprint and details, click to open the Transaction Details page. |
| Aggregation Interval (UTC) | The interval over which statistics are aggregated. For example, if a transaction is executed at 1:23PM it will fall in the 1:00PM - 2:00PM interval. |
| Execution Count | Cumulative number of executions of this transaction within the aggregation interval. The bar indicates the ratio of runtime success (gray) to retries (red) for the transaction. |
| Rows Read | Average number of rows read from disk while executing this transaction within the aggregation interval. The gray bar indicates the mean number of rows returned. The blue bar indicates one standard deviation from the mean. |
| Bytes Read | Aggregation of all bytes read from disk across all operators for this transaction within the aggregation interval. The gray bar indicates the mean number of bytes read from disk. The blue bar indicates one standard deviation from the mean. |
| Rows Written | Aggregation of all rows written to disk across all operators for transaction with this fingerprint within the specified aggregation interval. This column is not displayed by default. The gray bar indicates the mean number of rows written to disk. The blue bar indicates one standard deviation from the mean. |
| Transaction Time | Average planning and execution time of this transaction within the aggregation interval. The gray bar indicates the mean latency. The blue bar indicates one standard deviation from the mean. |
| Contention | Average time this transaction was in contention with other transactions within the aggregation interval. |
| Max Memory | Maximum memory used by this transaction at any time during its execution within the aggregation interval. The gray bar indicates the average max memory usage. The blue bar indicates one standard deviation from the mean. |
| Network | Amount of data transferred over the network for this transaction within the aggregation interval. If this value is 0, the transaction was executed on a single node. The gray bar indicates the mean number of bytes sent over the network. The blue bar indicates one standard deviation from the mean. |
| Retries | Cumulative number of retries of this transaction within the aggregation interval. |
| Regions/Nodes | The region and nodes in which the transaction was executed. Regions/Nodes are not visible for CockroachDB Serverless clusters. |
| Statements | Number of SQL statements in the transaction. |
Significant transactions on your database are likely to have a high execution count or number of rows read.
Transaction Details page
Click a transaction fingerprint to open Transaction Details.
- The transaction fingerprint is displayed as a list of the individual SQL statement fingerprints in the transaction.
- The Mean transaction time: the mean average time it took to execute the transaction within the aggregation interval.
- Transaction resource usage shows overall statistics about the transaction.
- Mean rows/bytes read: the mean average number of rows and bytes read from the storage layer during the execution of the transaction within the specified aggregation interval.
- Bytes read over network: the amount of data transferred over the network for this transaction within the aggregation interval.
If this value is 0, the statement was executed on a single node. - Mean rows written: the mean number of rows written by this transaction.
- Max memory usage: the maximum memory used by this transaction at any time during its execution within the aggregation interval.
- Max scratch disk usage: the maximum amount of data spilled to temporary storage on disk while executing this transaction within the aggregation interval.
The Statements page displays the statement fingerprints of all the statements in the transaction. To display the details of a statement, click a statement fingerprint.
