
This page has instructions for querying spatial data imported into CockroachDB. On this page, we use a sample Shapefile dataset from the National Oceanic and Atmospheric Administration.
Before you begin
Install a build of CockroachDB with support for spatial data by following the instructions at Install CockroachDB.
Start a local insecure cluster and connect to that cluster from a SQL client:
cockroach sql --insecure --host=localhost --port=26257Leave this shell open for use in the example below.
Import some sample spatial data into CockroachDB by following the instructions at Migrate from Shapefiles.
Query spatial data
After you have imported the sample tornado data into CockroachDB, you can query the spatial data from SQL.
For example, we may be interested in the 1999 Oklahoma tornado outbreak, which is described by Wikipedia as:
a significant tornado outbreak that affected much of the Central and parts of the Eastern United States, with the highest record-breaking wind speeds of 302 ± 22 mph (486 ± 35 km/h). During this week-long event, 154 tornadoes touched down (including one in Canada), more than half of them on May 3 and 4 when activity reached its peak over Oklahoma, Kansas, Nebraska, Texas, and Arkansas.
According to the wiki page linked above, there were 152 tornadoes confirmed between May 2-8, 1999 (one in Canada).
We can try to verify this number against the NWS's tornado data set with the following query:
SELECT COUNT(*) FROM "1950-2018-torn-initpoint" WHERE yr = 1999 AND mo = 5 AND dy >= 02 AND dy <= 08;
  count
---------
    150
(1 row)
It might be interesting to look into why these numbers are different!
Next, let's get a list of starting points for all of the tornadoes in the outbreak that started in Oklahoma:
SELECT ST_AsText(geom) FROM "1950-2018-torn-initpoint" WHERE yr = 1999 AND st = 'OK' AND mo = 5 AND dy > 02 AND dy <= 08;
                    st_astext
--------------------------------------------------
  POINT (-98.379999999999995 34.770000000000003)
  POINT (-98.329999999999998 34.780000000000001)
  POINT (-98.319999999999993 34.880000000000003)
  POINT (-98.230000000000004 34.920000000000002)
  POINT (-99.019999999999996 34.799999999999997)
  POINT (-98.25 35.030000000000001)
  POINT (-98.120000000000005 34.969999999999999)
  POINT (-98.030000000000001 35.049999999999997)
  POINT (-97.980000000000004 35.079999999999998)
  POINT (-98.569999999999993 34.950000000000003)
  POINT (-97.849999999999994 35.130000000000003)
  POINT (-98.430000000000007 34.979999999999997)
  POINT (-98.329999999999998 35.07)
  POINT (-98.019999999999996 35.719999999999999)
  POINT (-97.980000000000004 35.719999999999999)
  POINT (-97.599999999999994 35.299999999999997)
  POINT (-98.280000000000001 35.119999999999997)
  POINT (-98.200000000000003 35.170000000000002)
  POINT (-97.400000000000006 35.399999999999999)
  POINT (-98.099999999999994 35.18)
  POINT (-98.069999999999993 35.270000000000003)
  POINT (-98.129999999999995 35.270000000000003)
  POINT (-98.019999999999996 35.32)
  POINT (-97.299999999999997 35.469999999999999)
  POINT (-98 35.270000000000003)
  POINT (-97.969999999999999 35.399999999999999)
  POINT (-97.219999999999999 35.549999999999997)
  POINT (-97.920000000000002 35.420000000000002)
  POINT (-97.900000000000006 35.43)
  POINT (-97.230000000000004 35.579999999999998)
  POINT (-98.370000000000005 35.880000000000003)
  POINT (-97.920000000000002 35.520000000000003)
  POINT (-98.280000000000001 35.649999999999999)
  POINT (-97.849999999999994 35.530000000000001)
  POINT (-97.200000000000003 35.130000000000003)
  POINT (-97.780000000000001 35.649999999999999)
  POINT (-98.030000000000001 35.850000000000001)
  POINT (-97.719999999999999 35.700000000000003)
  POINT (-98.030000000000001 35.880000000000003)
  POINT (-97 35.369999999999997)
  POINT (-97.680000000000007 35.780000000000001)
  POINT (-97.950000000000003 35.93)
  POINT (-98.170000000000002 35.850000000000001)
  POINT (-97.680000000000007 35.880000000000003)
  POINT (-97.879999999999995 36.020000000000003)
  POINT (-97.950000000000003 36.020000000000003)
  POINT (-98 35.5)
  POINT (-97.879999999999995 36.100000000000001)
  POINT (-97.969999999999999 35.549999999999997)
  POINT (-96.799999999999997 35.649999999999999)
  POINT (-97.650000000000006 36.119999999999997)
  POINT (-98.25 36.299999999999997)
  POINT (-97.719999999999999 35.780000000000001)
  POINT (-97.780000000000001 35.850000000000001)
  POINT (-97.599999999999994 35.920000000000002)
  POINT (-97.420000000000002 36.030000000000001)
  POINT (-96.129999999999995 35.979999999999997)
  POINT (-96.069999999999993 36.020000000000003)
  POINT (-95.650000000000006 35.630000000000003)
  POINT (-95.180000000000007 35.950000000000003)
  POINT (-94.730000000000004 36)
  POINT (-97.400000000000006 35.32)
  POINT (-96.400000000000006 36.469999999999999)
  POINT (-95.579999999999998 34.579999999999998)
  POINT (-95.219999999999999 34.880000000000003)
  POINT (-95 35.130000000000003)
  POINT (-94.780000000000001 35.299999999999997)
  POINT (-94.700000000000003 35.43)
  POINT (-94.549999999999997 35.57)
(69 rows)
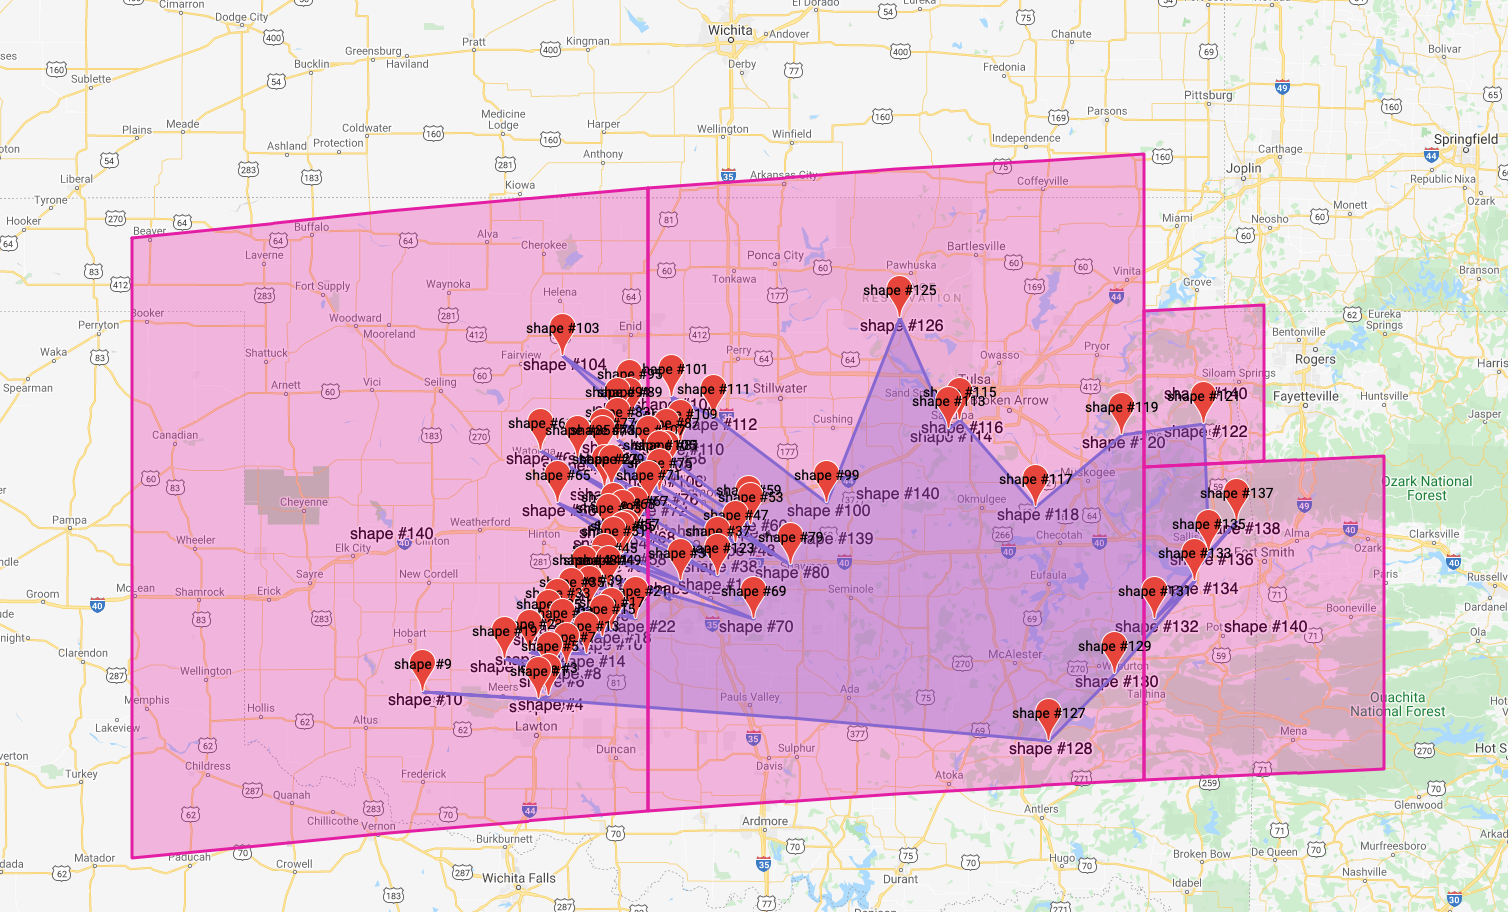
We can see that almost half of all of the tornadoes in this outbreak began in Oklahoma.
It might be interesting to draw these points on a map. The image below shows the points from the query above drawn as a simple polygon on a map of Oklahoma. The boxes around the polygon show the spatial index coverings for the polygon.
(Map data © 2020 Google)
