
The EXPLAIN ANALYZE statement executes a SQL query and generates a URL for a physical query plan with execution statistics, or a URL to download a bundle with more details about the query plan. Query plans provide information around SQL execution, which can be used to troubleshoot slow queries by figuring out where time is being spent, how long a processor (i.e., a component that takes streams of input rows and processes them according to a specification) is not doing work, etc. For more information about distributed SQL queries, see the DistSQL section of our SQL Layer Architecture docs.
The generated physical query plan is encoded into a byte string after the fragment identifier (#) in the generated URL. The fragment is not sent to the web server; instead, the browser waits for the web server to return a decode.html resource, and then JavaScript on the web page decodes the fragment into a physical query plan diagram. The query plan is, therefore, not logged by a server external to the CockroachDB cluster and not exposed to the public internet.
Aliases
In CockroachDB, the following are aliases for EXPLAIN ANALYZE:
EXPLAIN ANALYSE
Synopsis
Parameters
| Parameter | Description |
|---|---|
DISTSQL |
(Default) Generate a link to a distributed SQL physical query plan tree. For more information, see Default option. |
DEBUG |
Generate a ZIP file containing files with detailed information about the query and the database objects referenced in the query. For more information, see DEBUG option. |
preparable_stmt |
The statement you want to execute and analyze. All preparable statements are explainable. |
Required privileges
The user requires the appropriate privileges for the statement being explained.
Success responses
Successful EXPLAIN ANALYZE (and EXPLAIN ANALYZE (DISTSQL)) statements return a table with the following columns:
| Column | Description |
|---|---|
| automatic | If true, the query is distributed. For more information about distributed SQL queries, see the DistSQL section of our SQL Layer Architecture docs. |
| url | The URL generated for a physical query plan that provides high level information about how a query will be executed. For details about reading the physical query plan, see DistSQL Plan Viewer. The generated physical query plan is encoded into a byte string after the fragment identifier ( #) in the generated URL. The fragment is not sent to the web server; instead, the browser waits for the web server to return a decode.html resource, and then JavaScript on the web page decodes the fragment into a physical query plan diagram. The query plan is, therefore, not logged by a server external to the CockroachDB cluster and not exposed to the public internet. |
If you use the DEBUG option, the statement will return a single text column with a URL and instructions to download the DEBUG bundle, which includes the physical query plan.
Default option
By default, EXPLAIN ANALYZE uses the DISTQL option, which generates a physical query plan diagram in the DistSQL Plan Viewer. EXPLAIN ANALYZE and EXPLAIN ANALYZE (DISTSQL) produce the same output.
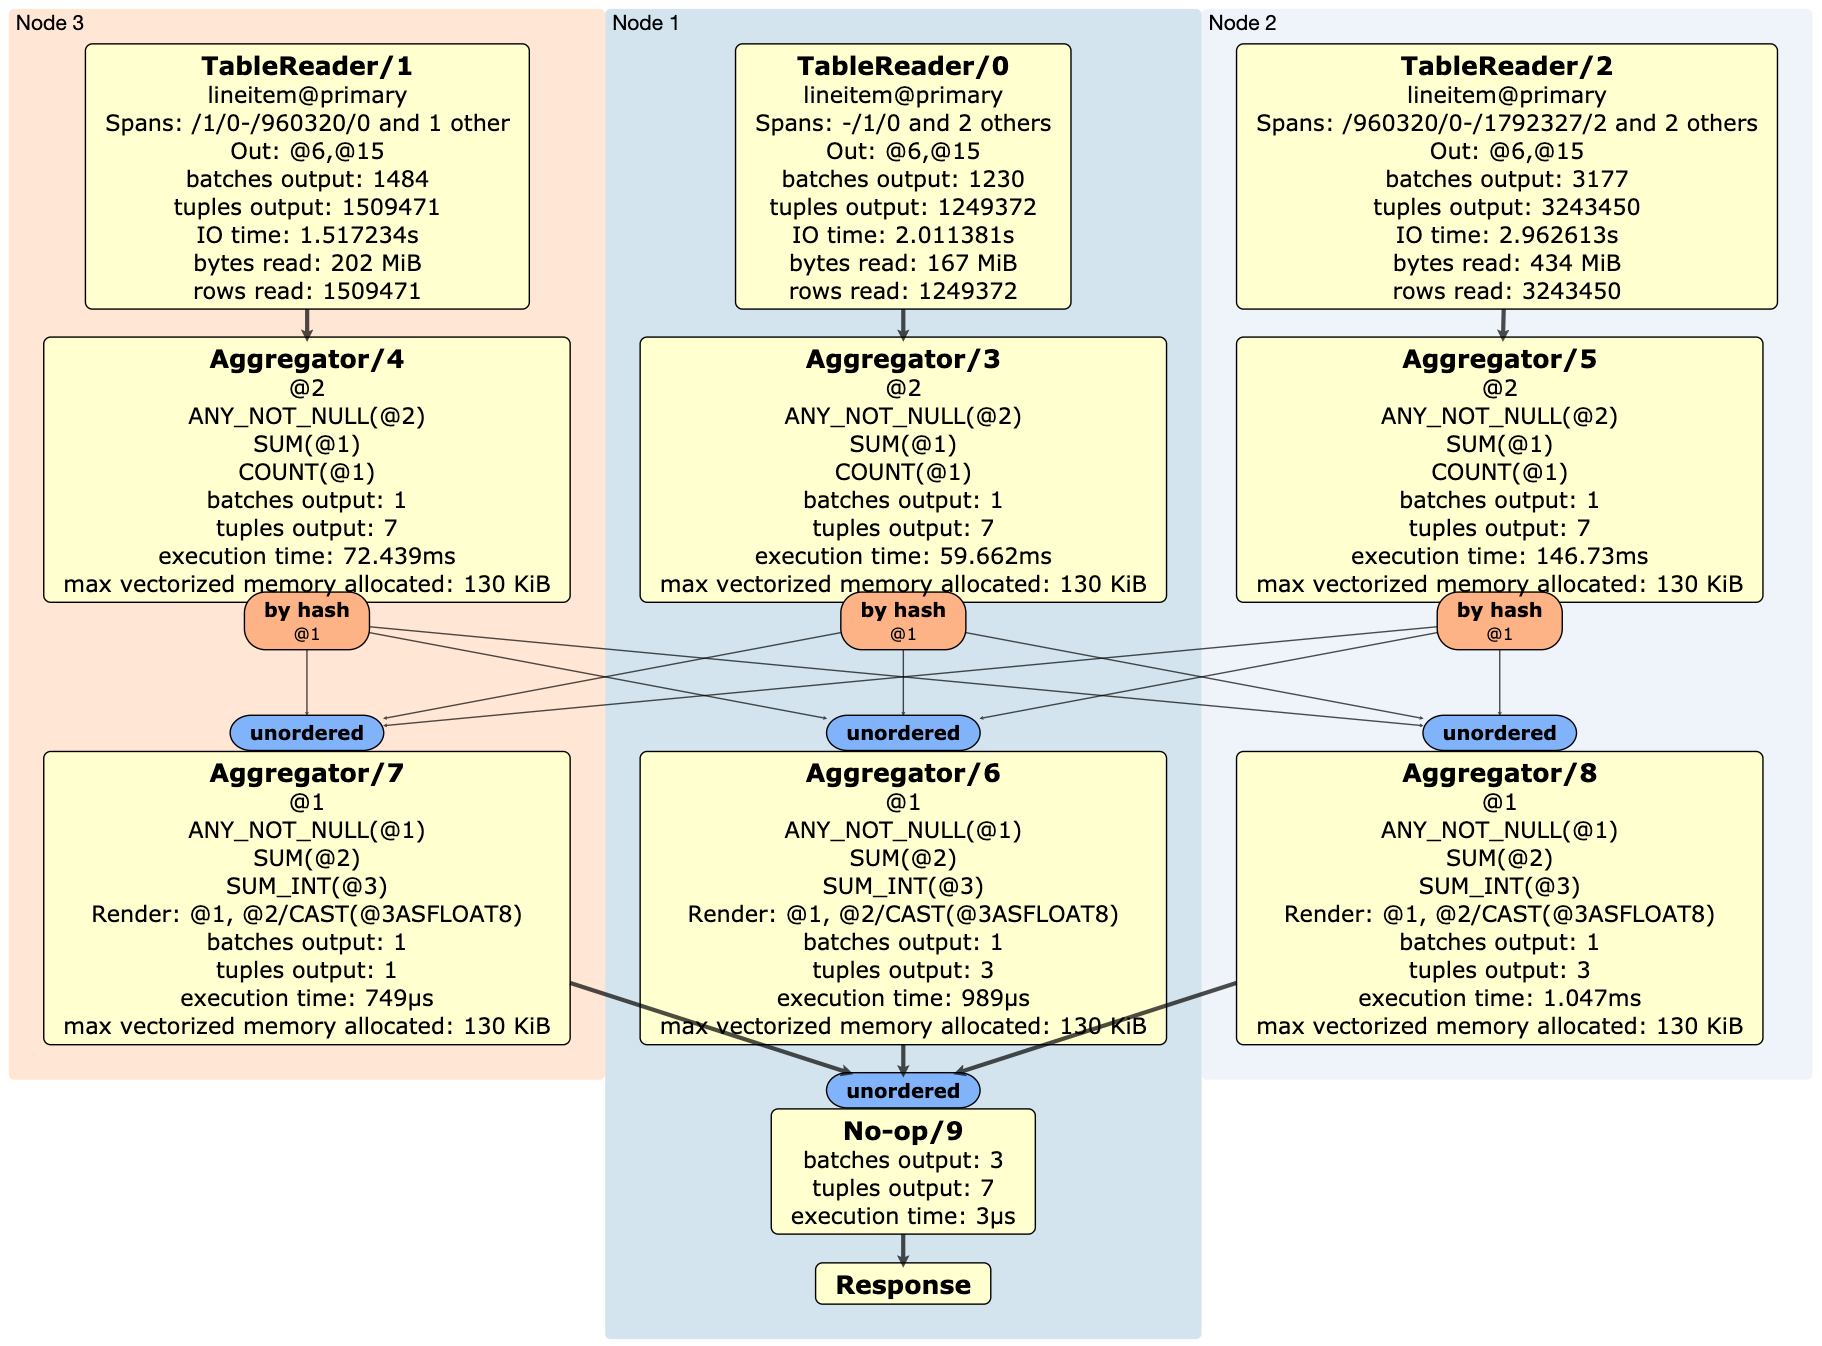
DistSQL Plan Viewer
The DistSQL Plan Viewer displays the physical query plan, as well as execution statistics. The statistics listed depend on the query type and the execution engine used.
| Field | Description | Execution engine |
|---|---|---|
| <Processor>/<id> | The processor and processor ID used to read data into the SQL execution engine. A processor is a component that takes streams of input rows, processes them according to a specification, and outputs one stream of rows. For example, a "TableReader" processor reads in data, and an "Aggregator" aggregates input rows. |
Both |
| <table>@<index> | The index used by the processor. | Both |
| Spans | The interval of the key space read by the processor. For example, [/1 - /1] indicates that only the key with value 1 is read by the processor. |
Both |
| Out | The output columns. | Both |
| batches output | The number of batches of columnar data output. | Vectorized engine only |
| tuples output | The number of rows output. | Vectorized engine only |
| IO time | How long the TableReader processor spent reading data from disk. | Vectorized engine only |
| stall time | How long the processor spent not doing work. This is aggregated into the stall time numbers as the query progresses down the tree (i.e., stall time is added up and overlaps with previous time). | Row-oriented engine only |
| bytes read | The size of the data read by the processor. | Both |
| rows read | The number of rows read by the processor. | Both |
| @<n> | The index of the column relative to the input. | Both |
| max memory used | How much memory (if any) is used to buffer rows. | Row-oriented engine only |
| max disk used | How much disk (if any) is used to buffer data. Routers and processors will spill to disk buffering if there is not enough memory to buffer the data. | Row-oriented engine only |
| execution time | How long the engine spent executing the processor. | Vectorized engine only |
| max vectorized memory allocated | How much memory is allocated to the processor to buffer batches of columnar data. | Vectorized engine only |
| max vectorized disk used | How much disk (if any) is used to buffer columnar data. Processors will spill to disk buffering if there is not enough memory to buffer the data. | Vectorized engine only |
| left(@<n>)=right(@<n>) | The equality columns used in the join. | Both |
| stored side | The smaller table that was stored as an in-memory hash table. | Both |
| rows routed | How many rows were sent by routers, which can be used to understand network usage. | Row-oriented engine only |
| bytes sent | The number of actual bytes sent (i.e., encoding of the rows). This is only relevant when doing network communication. | Both |
| Render | The stage that renders the output. | Both |
| by hash | (Orange box) The router, which is a component that takes one stream of input rows and sends them to a node according to a routing algorithm. For example, a hash router hashes columns of a row and sends the results to the node that is aggregating the result rows. |
Both |
| unordered / ordered | (Blue box) A synchronizer that takes one or more output streams and merges them to be consumable by a processor. An ordered synchronizer is used to merge ordered streams and keeps the rows in sorted order. | Both |
| <data type> | If EXPLAIN(DISTSQL, TYPES) is specified, lists the data types of the input columns. |
Both |
| Response | The response back to the client. | Both |
DEBUG option
EXPLAIN ANALYZE (DEBUG) executes a query and generates a link to a ZIP file that contains the physical query plan, execution statistics, statement tracing, and other information about the query.
| File | Description |
|---|---|
stats-<table>.sql |
Contains statistics for a table in the query. |
schema.sql |
Contains CREATE statements for objects in the query. |
env.sql |
Contains information about the CockroachDB environment. |
trace.txt |
Contains statement traces in plaintext format. |
trace.json |
Contains statement traces in JSON format. |
trace-jaeger.json |
Contains statement traces in JSON format that can be imported to Jaeger. |
distsql.html |
The query's physical query plan. This diagram is identical to the one generated by EXPLAIN(DISTSQL) |
plan.txt |
The query execution plan. This is identical to the output of EXPLAIN (VERBOSE). |
opt-vv.txt |
The query plan tree generated by the cost-based optimizer, with cost details and input column data types. This is identical to the output of EXPLAIN (OPT, TYPES). |
opt-v.txt |
The query plan tree generated by the cost-based optimizer, with cost details. This is identical to the output of EXPLAIN (OPT, VERBOSE). |
opt.txt |
The query plan tree generated by the cost-based optimizer. This is identical to the output of EXPLAIN (OPT). |
statement.txt |
The SQL statement for the query. |
You can obtain this ZIP file by following the link provided in the EXPLAIN ANALYZE (DEBUG) output, or by activating statement diagnostics in the DB Console.
Examples
EXPLAIN ANALYZE
Use EXPLAIN ANALYZE without an option, or equivalently with the DISTSQL option, to execute a query and generate a link to a physical query plan with execution statistics.
For example, the following EXPLAIN ANALYZE statement executes a simple query against the TPC-H database loaded to a 3-node CockroachDB cluster, and then generates a link to a physical query plan with execution statistics:
> EXPLAIN ANALYZE SELECT l_shipmode, AVG(l_extendedprice) FROM lineitem GROUP BY l_shipmode;
  automatic |                      url
------------+-----------------------------------------------
    true    | https://cockroachdb.github.io/distsqlplan...
To view the DistSQL Plan Viewer, point your browser to the URL provided:
EXPLAIN ANALYZE (DEBUG)
Use the DEBUG option to generate a ZIP file containing files with information about the query and the database objects referenced in the query. For example:
> EXPLAIN ANALYZE (DEBUG) SELECT l_shipmode, AVG(l_extendedprice) FROM lineitem GROUP BY l_shipmode;
                                      text
--------------------------------------------------------------------------------
  Statement diagnostics bundle generated. Download from the Admin UI (Advanced
  Debug -> Statement Diagnostics History), via the direct link below, or using
  the command line.
  Admin UI: http://127.0.0.1:26258
  Direct link: http://127.0.0.1:26258/_admin/v1/stmtbundle/...
  Command line: cockroach statement-diag list / download
(6 rows)
Navigating to the URL will automatically download the ZIP file. You can also obtain the bundle by activating statement diagnostics in the DB Console.
