
On a secure cluster, this area of the Admin UI can only be accessed by an admin user. See Admin UI access.
The Statements page helps you:
- Identify frequently executed or high latency SQL statements.
- View SQL statement details.
- Download SQL statement diagnostics for troubleshooting.
To view this page, access the Admin UI and click Statements in the left-hand navigation.
Search and filter by application
By default, this page shows SQL statements from all applications running on the cluster, and hides internal CockroachDB queries.
To filter the statements by application_name, use the App menu. If you haven't set application_name in the client connection string, it appears as unset.
CockroachDB's internal queries are only displayed under the (internal) app. Queries from the SQL shell are displayed under the $ cockroach sql app.
You can also search for statements using the search bar.
Understand the Statements page
Use this page to identify SQL statements that you may want to troubleshoot. This might include statements that are experiencing high latencies, multiple retries, or execution failures. You can optionally create and retrieve diagnostics for these statements.
If you haven't yet executed any queries in the cluster as a user, this page will initially be blank.
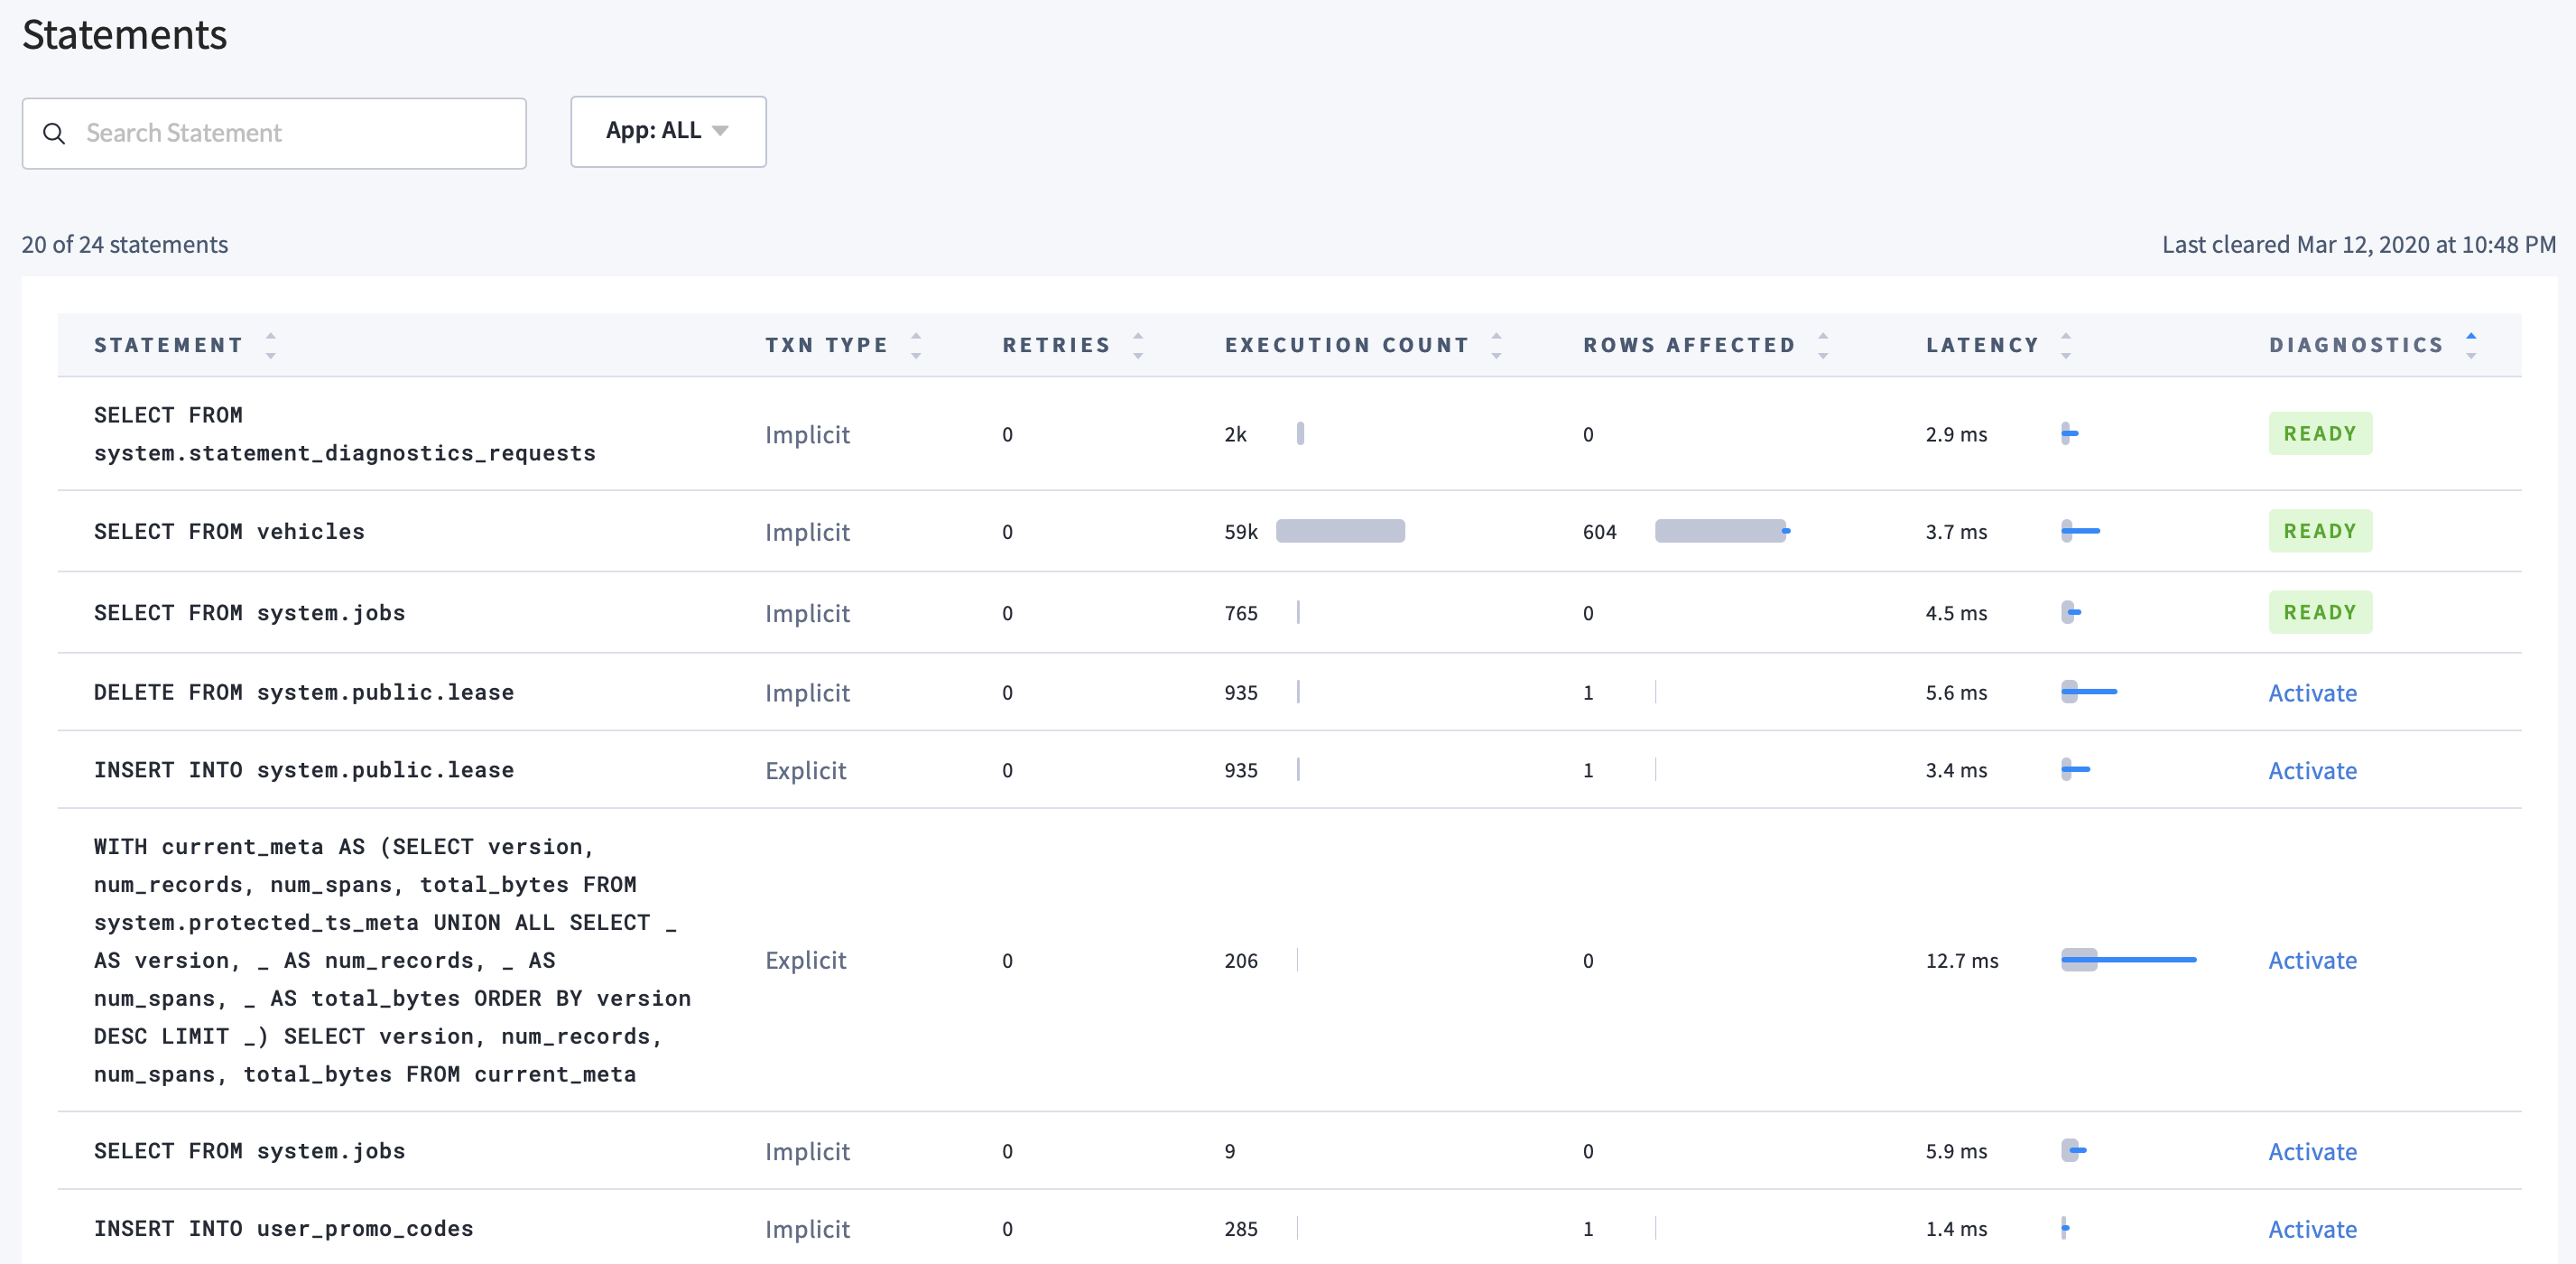
| Parameter | Description |
|---|---|
| Statement | SQL statement fingerprint. To view additional details of a SQL statement fingerprint, click this to open the Statement Details page. |
| Txn Type | Type of transaction (implicit or explicit). Explicit transactions refer to statements that are wrapped by BEGIN and COMMIT statements by the client. Explicit transactions employ transactional pipelining and therefore report latencies that do not account for replication.For statements not in explicit transactions, CockroachDB wraps each statement in individual implicit transactions. |
| Retries | Cumulative number of retries of statements with this fingerprint within the last hour or specified time interval. |
| Execution Count | Cumulative number of executions of statements with this fingerprint within the last hour or specified time interval. The bar indicates the ratio of runtime success (gray) to retries (red) for the SQL statement fingerprint. |
| Rows Affected | Average number of rows returned while executing statements with this fingerprint within the last hour or specified time interval. The gray bar indicates the mean number of rows returned. The blue bar indicates one standard deviation from the mean. |
| Latency | Average service latency of statements with this fingerprint within the last hour or specified time interval. Service latency is the time taken to execute a query once it is received by the cluster. It does not include the time taken to send the query to the cluster or return the result to the client. The gray bar indicates the mean latency. The blue bar indicates one standard deviation from the mean. |
| Diagnostics | New in v20.1: Option to activate diagnostics for this fingerprint. If activated, this displays the status of diagnostics collection (WAITING FOR QUERY, READY, OR ERROR). When READY, the most recent diagnostics bundle can be downloaded here. Access the full history of diagnostics for the fingerprint in the Statement Details page. |
Time interval
By default, the Statements page displays all SQL statements executed within a one-hour time interval. The display is cleared at the end of each interval. You can change the interval with the diagnostics.reporting.interval cluster setting.
SQL statement fingerprints
The Statements page displays SQL statement fingerprints.
A statement fingerprint represents one or more SQL statements by replacing literal values (e.g., numbers and strings) with underscores (_). This can help you quickly identify frequently executed SQL statements and their latencies.
For multiple SQL statements to be represented by a fingerprint, they must be identical aside from their literal values:
INSERT INTO new_order(product_id, customer_id, transaction_id) VALUES (380, 11, 11098)INSERT INTO new_order(product_id, customer_id, transaction_id) VALUES (192, 891, 20)INSERT INTO new_order(product_id, customer_id, transaction_id) VALUES (784, 452, 78)
The above SQL statements have the fingerprint:
INSERT INTO new_order(product_id, customer_id, no_w_id) VALUES (_, _, _)
The following statements cannot be represented by the same fingerprint:
INSERT INTO orders(product_id, customer_id, transaction_id) VALUES (380, 11, 11098)INSERT INTO new_order(product_id, customer_id, transaction_id) VALUES (380, 11, 11098)INSERT INTO new_order(product_id, customer_id, transaction_id) VALUES ($1, 11, 11098)INSERT INTO new_order(product_id, customer_id, transaction_id) VALUES ($1, $2, 11098)INSERT INTO new_order(product_id, customer_id, transaction_id) VALUES ($1, $2, $3)
It is possible to see the same fingerprint listed multiple times in the following scenarios:
- Statements with this fingerprint were executed by more than one
application_name. - Statements with this fingerprint were executed both successfully and unsuccessfully.
Statement Details page
Click on a SQL statement fingerprint to open Statement Details. For each statement fingerprint, the details include:
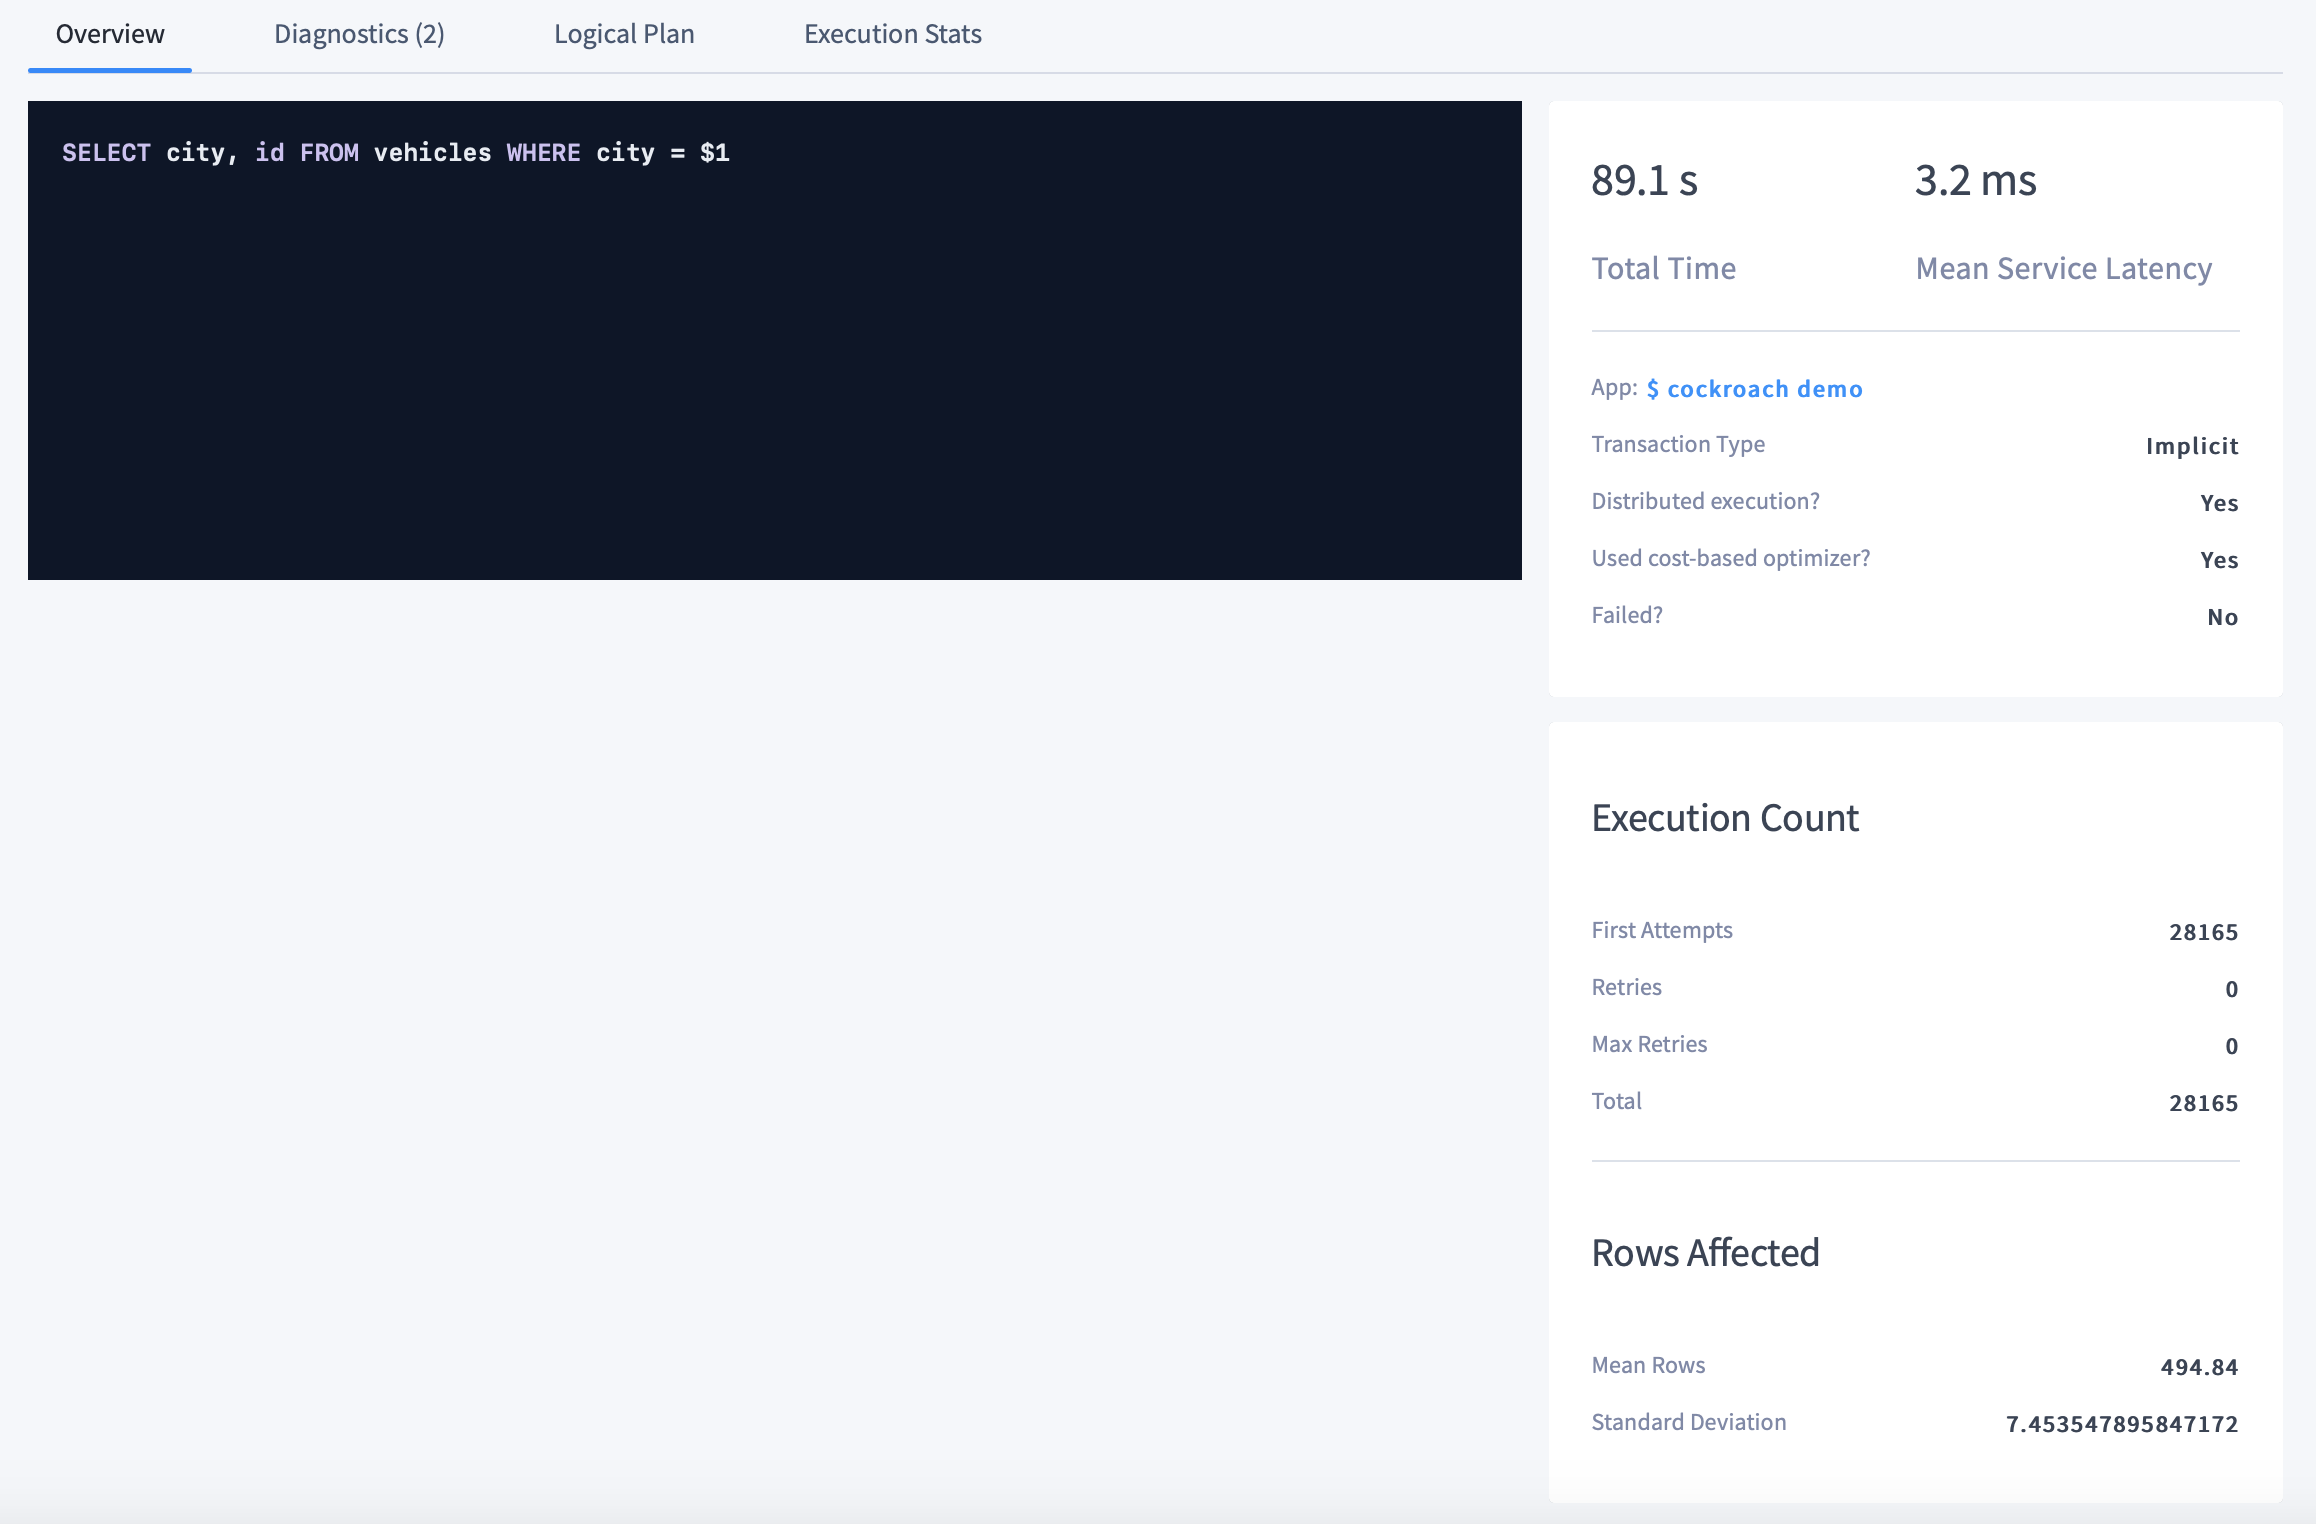
Overview
The Overview section displays the SQL statement fingerprint and essential statistics on the right-hand side of the page:
- Total Time is the cumulative time taken to execute statements with this fingerprint within the specified time interval.
- Mean Service Latency is the average service latency of statements with this fingerprint within the specified time interval.
- App displays the name specified by the
application_namesession setting. - Transaction Type displays the type of transaction (implicit or explicit).
- Distributed execution? indicates whether the execution was distributed.
- Used cost-based optimizer? indicates whether the execution used the cost-based optimizer.
- Failed? indicates whether the execution was successful.
Execution Count displays execution statistics for the SQL statement fingerprint.
- First Attempts is the cumulative number of first attempts at executing statements with this fingerprint within the specified time interval.
- Retries is the cumulative number of retries of statements with this fingerprint within the specified time interval.
- Max Retries is the highest number of retries of a single statement with this fingerprint within the specified time interval. For example, if three statements with the same fingerprint had to be retried 0, 1, and 5 times, then the Max Retries value for the fingerprint is 5.
- Total is the total number of executions of statements with this fingerprint. It is calculated as the sum of first attempts and retries.
Rows Affected displays statistics on rows returned for the SQL statement fingerprint.
- Mean Rows is the average number of rows returned while executing statements with this fingerprint within the specified time interval.
- Standard Deviation is the value of one standard deviation of the mean.
Diagnostics
The Diagnostics section of the Statement Details page allows you to activate and view diagnostics for the SQL statement fingerprint.
When you activate diagnostics for a fingerprint, CockroachDB waits for the next SQL query that matches this fingerprint to be run on any node. On the next match, information about the SQL statement is written to a diagnostics bundle that you can download. This bundle consists of statement traces in various formats (including a JSON file that can be imported to Jaeger), a physical query plan, execution statistics, and other information about the query. The bundle contents are identical to those produced by EXPLAIN ANALYZE (DEBUG).
Diagnostics will be collected a maximum of N times for a given activated fingerprint where N is the number of nodes in your cluster.
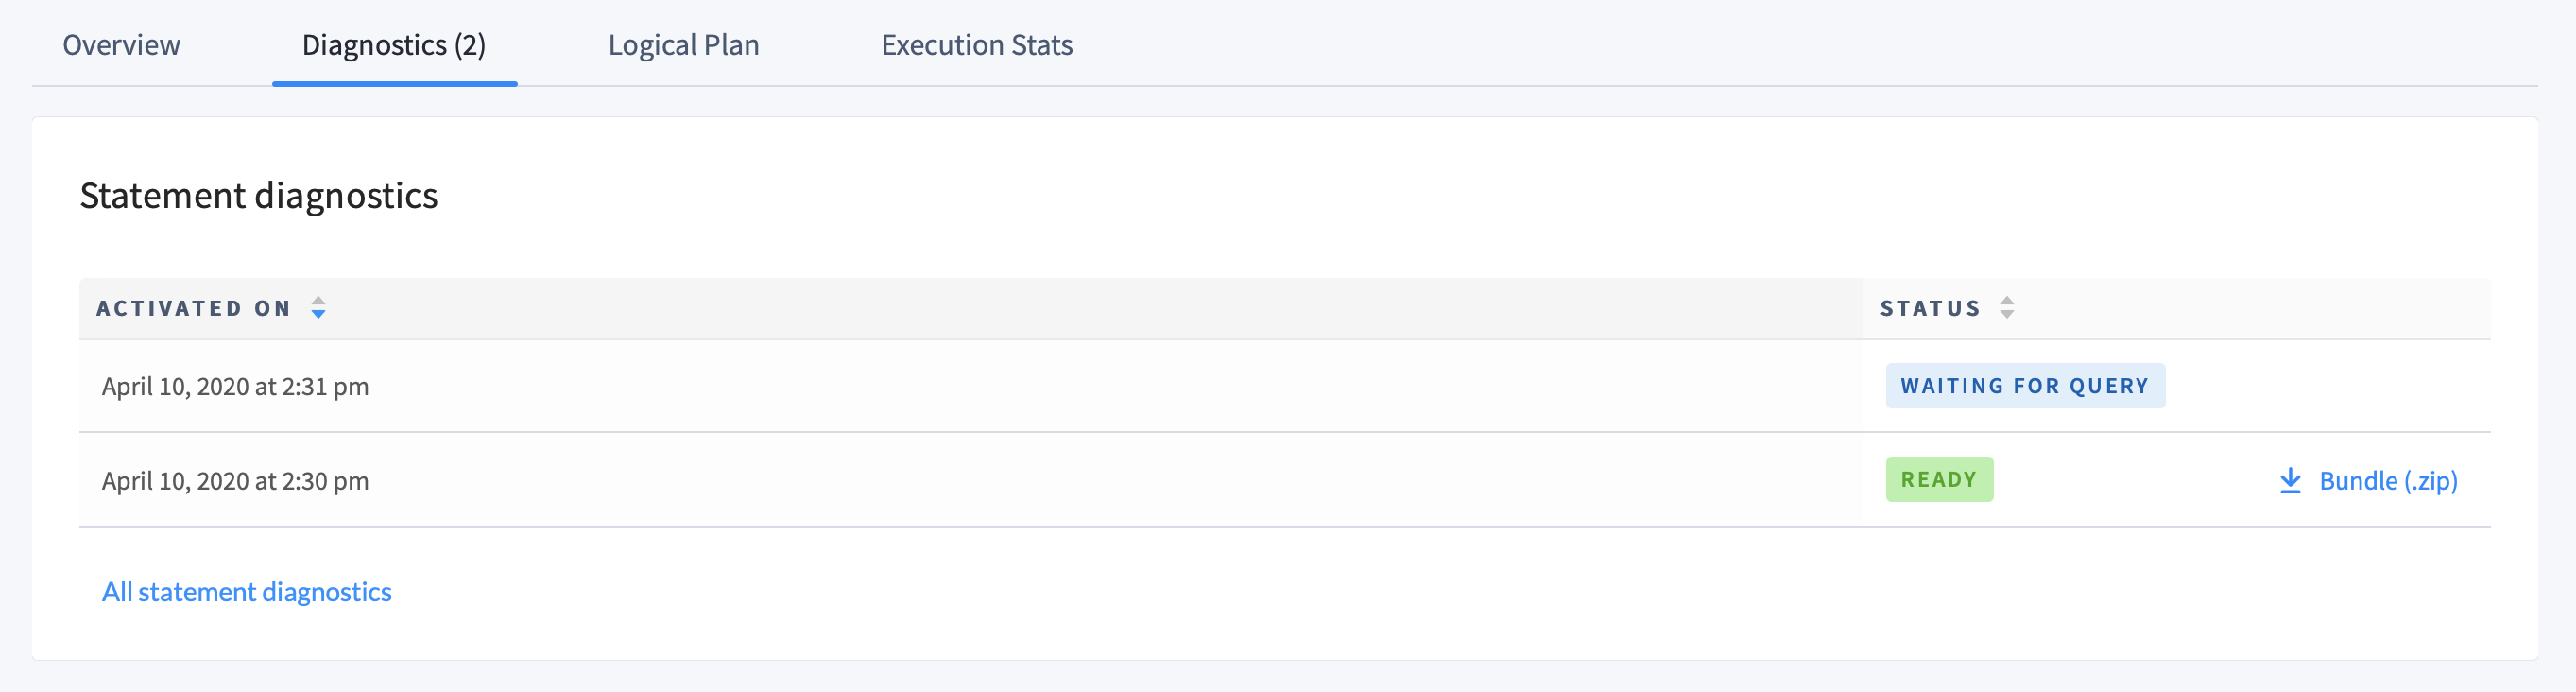
- Click the Activate button to begin collecting diagnostics for the fingerprint. This will open the list of Statement diagnostics with a status next to each activated diagnostic.
WAITING FOR QUERYindicates that a SQL statement matching the fingerprint has not yet been recorded.ERRORindicates that the attempt at diagnostics collection failed.READYindicates that the diagnostics have run and can be downloaded. A download link will appear beside the status.
- For any row with a
READYstatus, click Bundle (.zip) to retrieve the diagnostics.
The information collected in the bundle can be used to diagnose problematic SQL statements, such as slow queries. We recommend that you share the diagnostics bundle with our support team, which can help you interpret the results. You can also import trace-jaeger.json into Jaeger to visualize the statement traces.
Click All statement diagnostics to view a complete history of your collected diagnostics, each of which can be downloaded. Although fingerprints are periodically cleared from the Statements page, all diagnostics bundles are preserved. If you need to access diagnostics that were collected for a fingerprint not present in the past interval, you can find the bundle here.
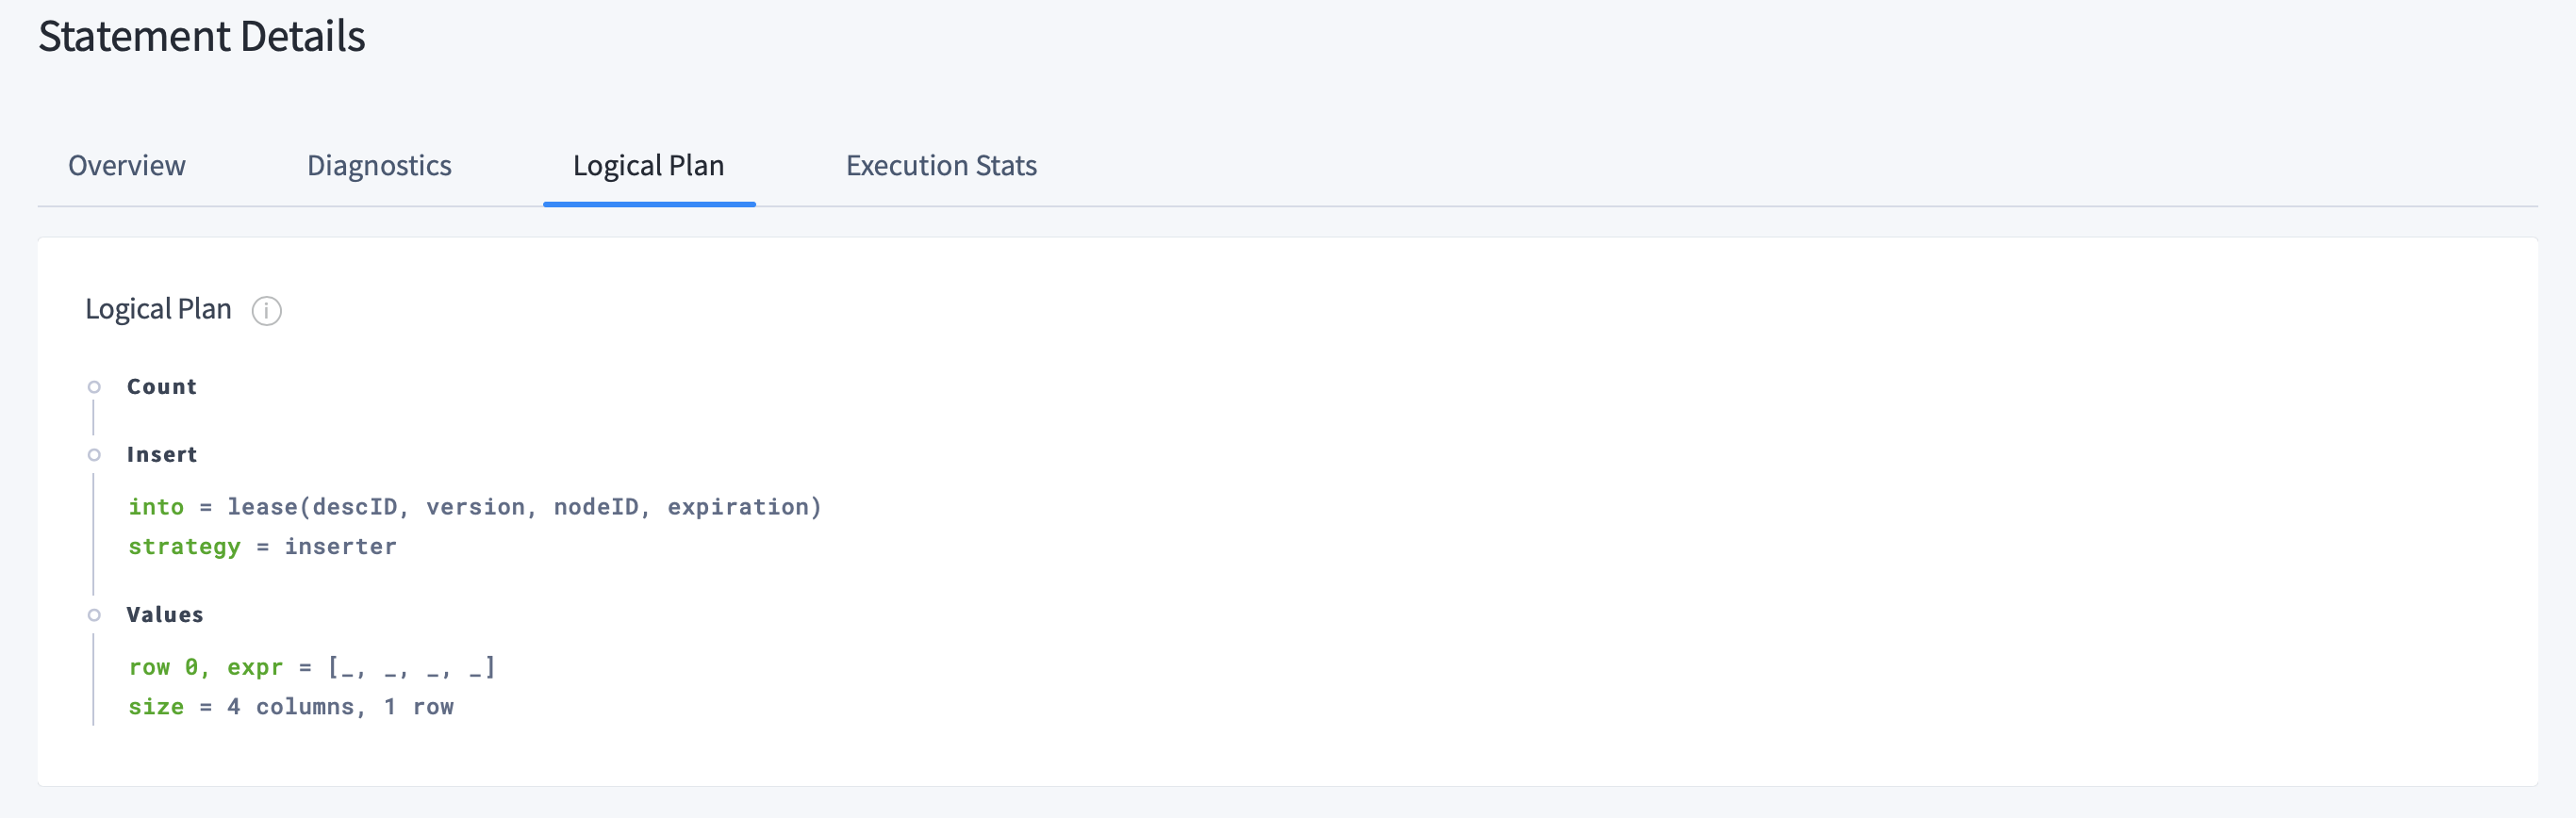
Logical Plan
The Logical Plan section displays CockroachDB's query plan for an explainable statement. You can use this information to optimize the query. For more information about logical plans, see EXPLAIN.
By default, the logical plan for each fingerprint is sampled every 5 minutes. You can change the interval with the sql.metrics.statement_details.plan_collection.period cluster setting. For example, to change the interval to 2 minutes, run the following SET CLUSTER SETTING command:
> SET CLUSTER SETTING sql.metrics.statement_details.plan_collection.period = '2m0s';
Execution Stats
Execution Latency by Phase displays the service latency of statements matching this fingerprint, broken down by phase (parse, plan, run, overhead), as well as the overall service latency. The gray bar indicates the mean latency. The blue bar indicates one standard deviation from the mean.
"Overhead" comprises the statements that remain after subtracting parse, plan, and run latencies from the overall latency. These might include fetching table descriptors that were not cached, or other background tasks required to execute the query.
Service latency can be affected by network latency, which is displayed for your cluster on the Network Latency page.
The Statistics by Node table provides a breakdown of the number of statements of the selected fingerprint per gateway node. You can use this table to determine whether, for example, you are executing queries on a node that is far from the data you are requesting (see Optimize Query Performance).
| Parameter | Description |
|---|---|
| Node | ID of the gateway node. |
| Retries | Cumulative number of retries of statements with this fingerprint within the last hour or specified time interval. |
| Execution Count | Cumulative number of executions of statements with this fingerprint within the last hour or specified time interval. |
| Rows Affected | Average number of rows returned while executing statements with this fingerprint within the last hour or specified time interval. The gray bar indicates the mean number of rows returned. The blue bar indicates one standard deviation from the mean. |
| Latency | Average service latency of statements with this fingerprint within the last hour or specified time interval. Service latency is the time taken to execute a query once it is received by the cluster. It does not include the time taken to return the result to the client. The gray bar indicates the mean latency. The blue bar indicates one standard deviation from the mean. |
