
Access the Admin UI
You can access the Admin UI from any node in the cluster.
By default, you can access it via HTTP on port 8080 of the hostname or IP address you configured using the --host flag while starting the node. For example, http://<any node host>:8080. If you are running a secure cluster, use https://<any node host>:8080.
You can also set the CockroachDB Admin UI to a custom port using --http-port or a custom hostname using --http-host when starting each node. For example, if you set both a custom port and hostname, http://<http-host value>:<http-port value>. For a secure cluster, https://<http-host value>:<http-port value>.
For additional guidance on accessing the Admin UI in the context of cluster deployment, see Start a Local Cluster and Manual Deployment.
Navigate the Admin UI
The left-hand navigation bar allows you to navigate to the Cluster Overview page, Cluster metrics dashboards, Databases page, and Jobs page.
The main panel displays changes for each page:
| Page | Main Panel Component |
|---|---|
| Cluster Overview |
|
| Cluster Metrics | |
| Databases | Information about the tables and grants in your databases. |
| Jobs | Information about all currently active schema changes and backup/restore jobs. |
Cluster Overview Panel
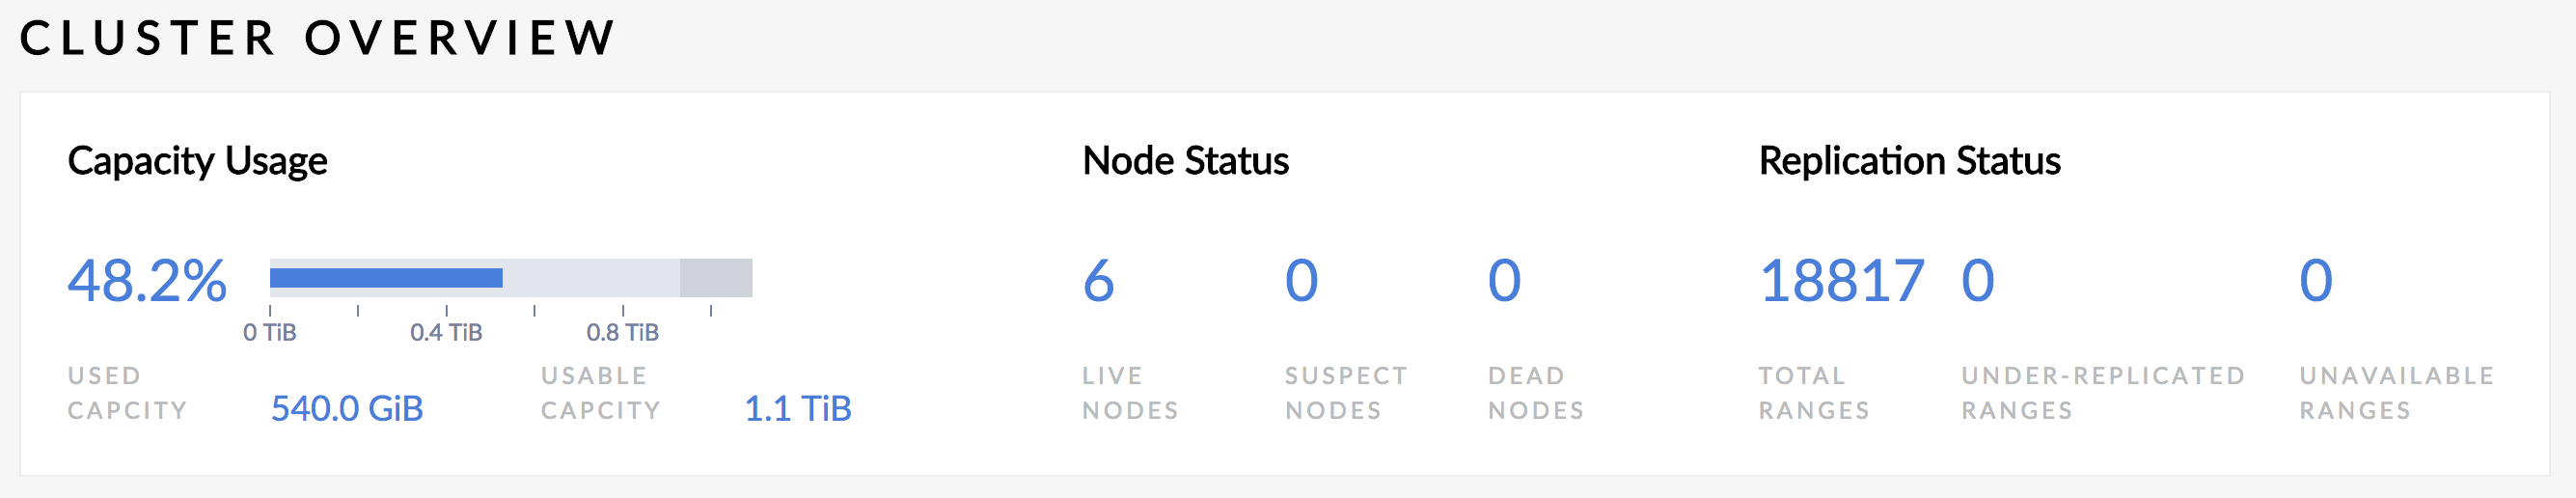
The Cluster Overview panel provides the following metrics:
| Metric | Description |
|---|---|
| Capacity Usage |
|
| Node Status |
|
| Replication Status |
|
Node List
The Node List is the default view on the Overview page.
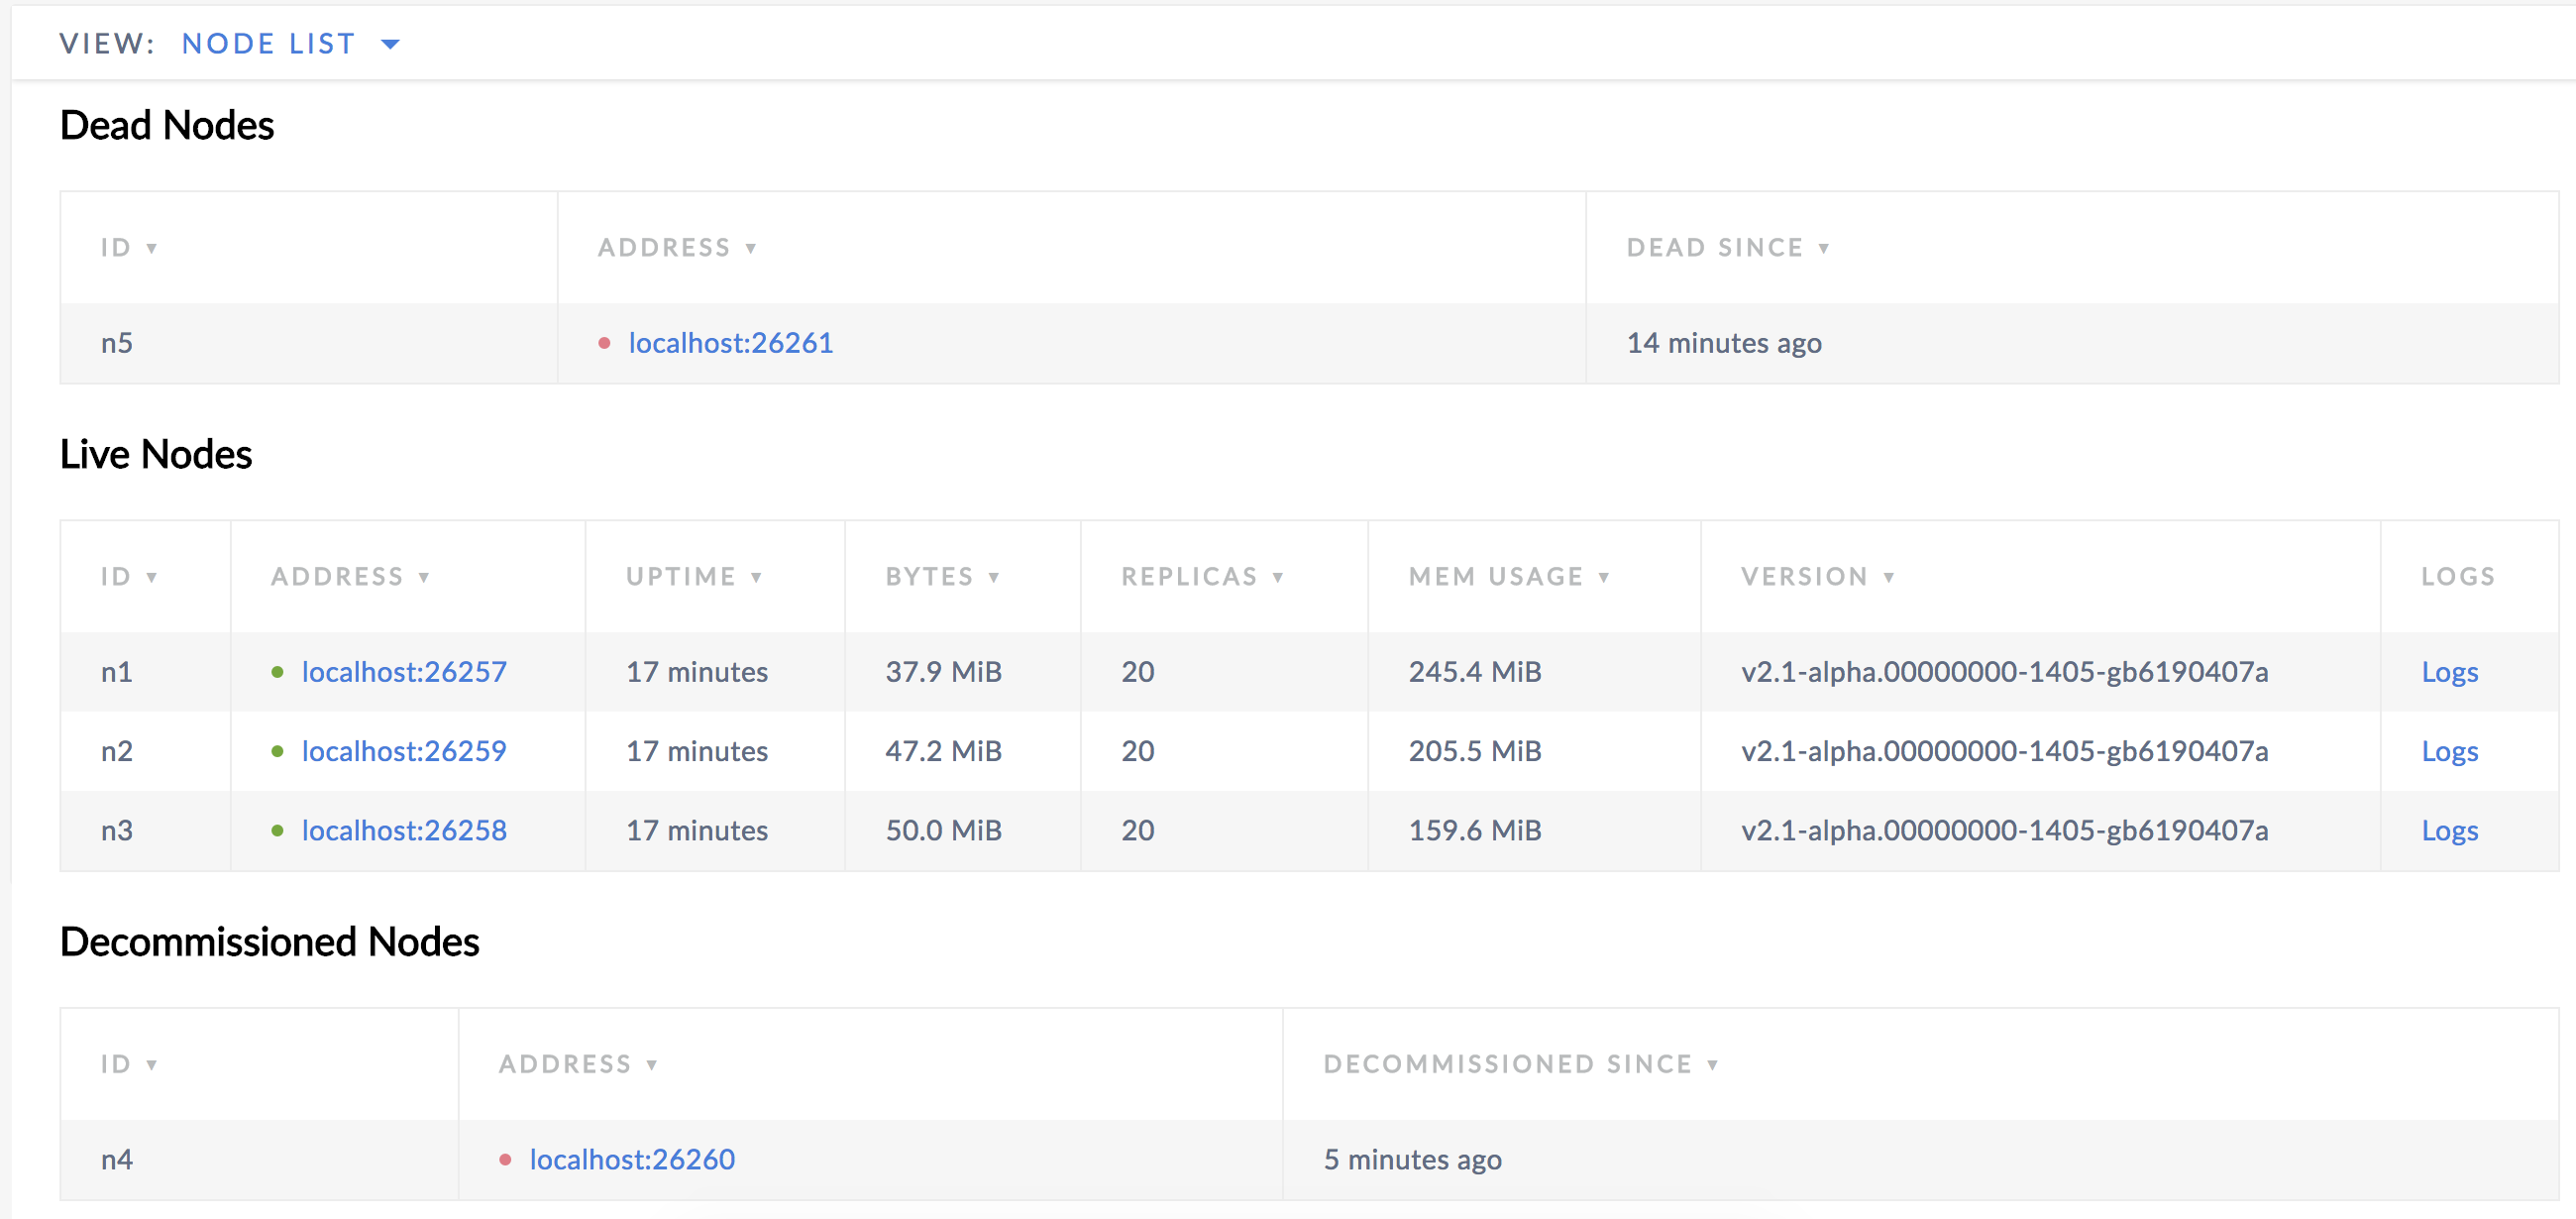
Live Nodes
Live nodes are nodes that are online and responding. They are marked with a green dot. If a node is removed or dies, the dot turns yellow to indicate that it is not responding. If the node remains unresponsive for a certain amount of time (5 minutes by default), the node turns red and is moved to the Dead Nodes section, indicating that it is no longer expected to come back.
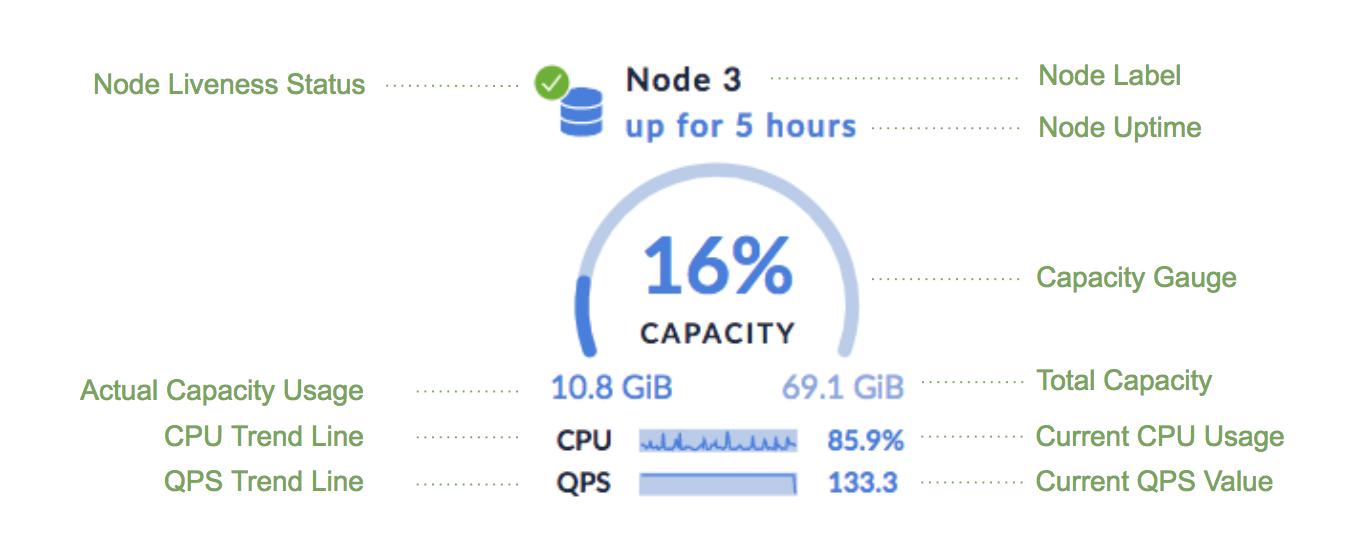
The following details are shown for each live node:
| Column | Description |
|---|---|
| ID | The ID of the node. |
| Address | The address of the node. You can click on the address to view further details about the node. |
| Uptime | How long the node has been running. |
| Bytes | The used capacity for the node. |
| Replicas | The number of replicas on the node. |
| Mem Usage | The memory usage for the node. |
| Version | The build tag of the CockroachDB version installed on the node. |
| Logs | Click Logs to see the logs for the node. |
Dead Nodes
Nodes are considered dead once they have not responded for a certain amount of time (5 minutes by default). At this point, the automated repair process starts, wherein CockroachDB automatically rebalances replicas from the dead node, using the unaffected replicas as sources. See Stop a Node for more information.
The following details are shown for each dead node:
| Column | Description |
|---|---|
| ID | The ID of the node. |
| Address | The address of the node. You can click on the address to view further details about the node. |
| Down Since | How long the node has been down. |
Decommissioned Nodes
New in v1.1: Nodes that have been decommissioned for permanent removal from the cluster are listed in the Decommissioned Nodes table.
When you decommission a node, CockroachDB lets the node finish in-flight requests, rejects any new requests, and transfers all range replicas and range leases off the node so that it can be safely shut down. See Remove Nodes for more information.
Node Map (Enterprise)
New in v2.0: The Node Map is an enterprise-only feature that gives you a visual representation of the geographical configuration of your cluster.
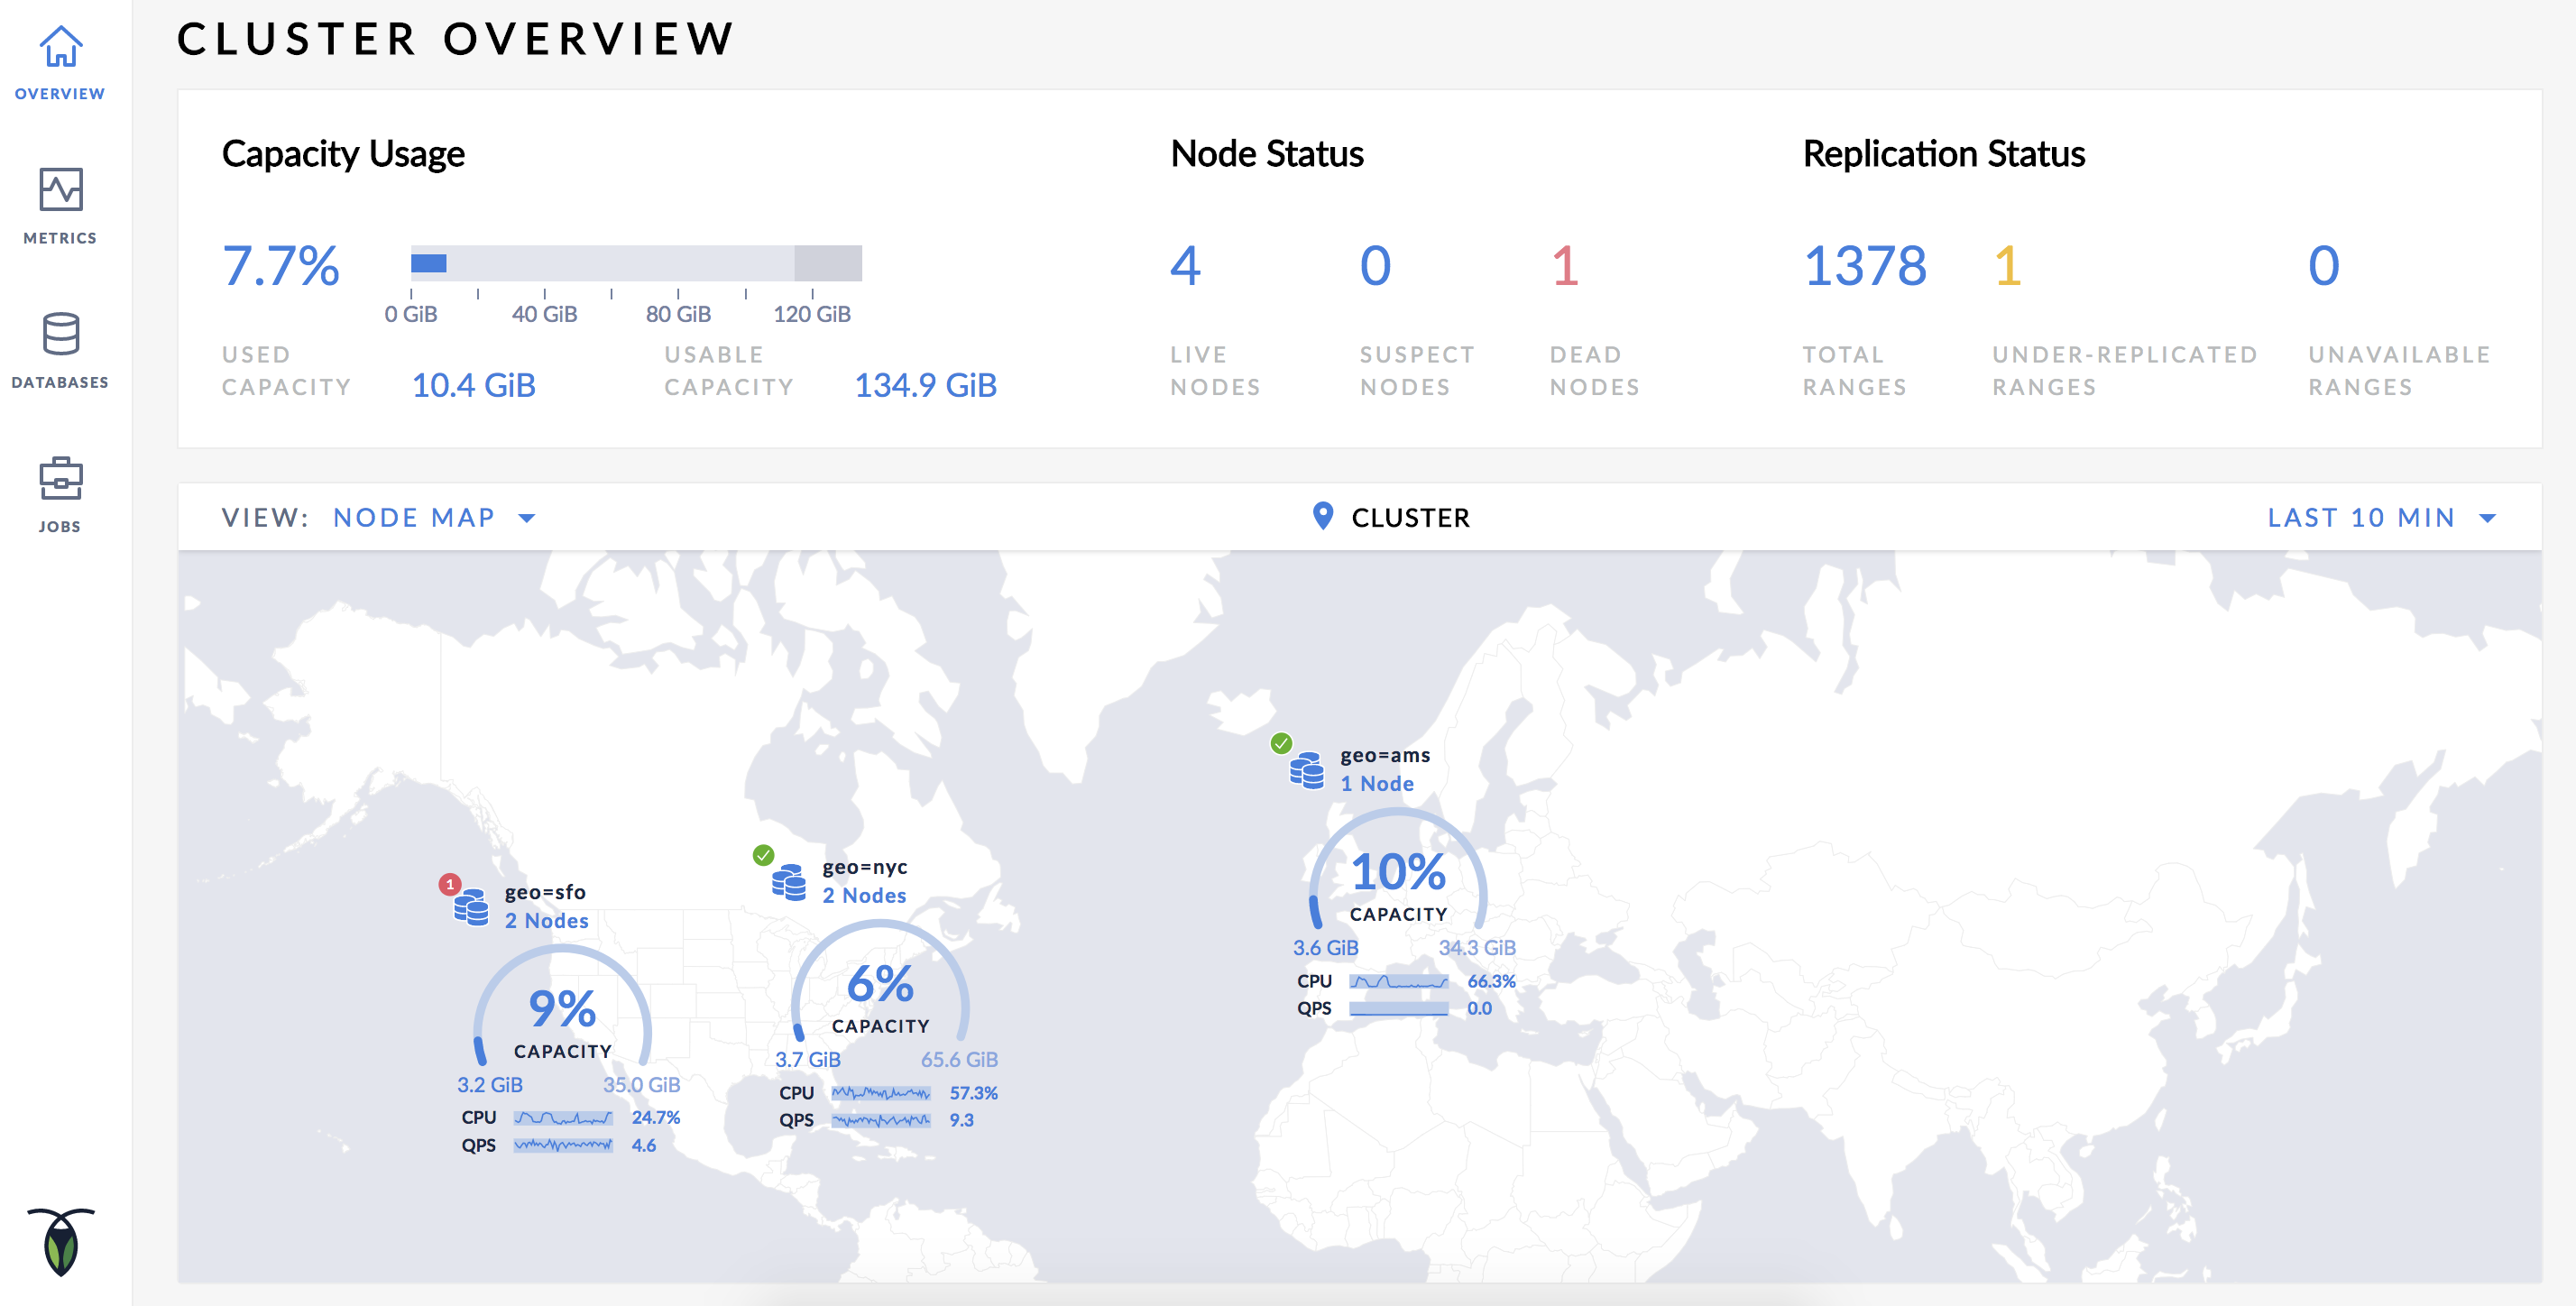
The Node Map consists of the following components:
Region component
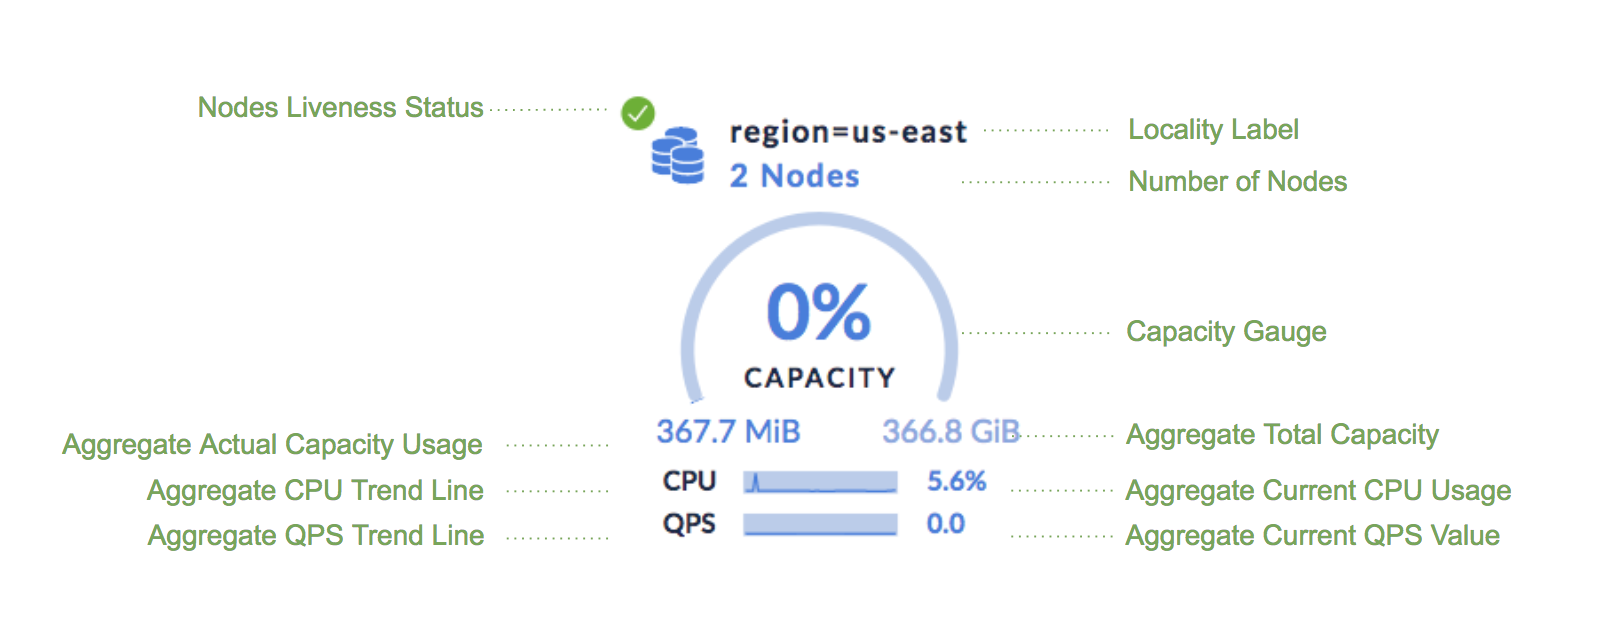
Node component
For guidance on enabling and using the node map, see Enable Node Map.
Time Series Graphs
The Cluster Metrics dashboards display the time series graphs that are useful to visualize and monitor data trends. To access the time series graphs, click Metrics on the left-hand navigation bar.
You can hover over each graph to see actual point-in-time values.
Change time range
You can change the time range by clicking on the time window.
View metrics for a single node
By default, the time series panel displays the metrics for the entire cluster. To view the metrics for an individual node, select the node from the Graph drop-down list.
Summary Panel
The Cluster Metrics dashboards display the Summary panel of key metrics. To view the Summary panel, click Metrics on the left-hand navigation bar.
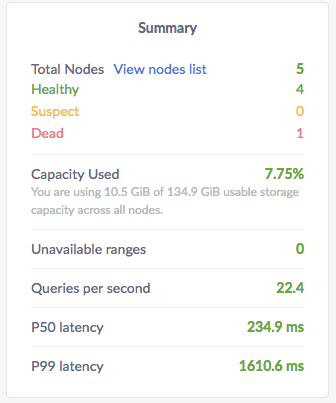
The Summary panel provides the following metrics:
| Metric | Description |
|---|---|
| Total Nodes | The total number of nodes in the cluster. Decommissioned nodes are not included in the Total Nodes count. You can further drill down into the nodes details by clicking on View nodes list. |
| Dead Nodes | The number of dead nodes in the cluster. |
| Capacity Used | The storage capacity used as a percentage of total storage capacity allocated across all nodes. |
| Unavailable Ranges | The number of unavailable ranges in the cluster. A non-zero number indicates an unstable cluster. |
| Queries per second | The number of SQL queries executed per second. |
| P50 Latency | The 50th percentile of service latency. Service latency is calculated as the time between when the cluster receives a query and finishes executing the query. This time does not include returning results to the client. |
| P99 Latency | The 99th percentile of service latency. |
If you are running multiple nodes on a single machine (not recommended in production) and didn't specify the maximum allocated storage capacity for each node using the --store flag, the capacity metrics in the Admin UI are incorrect. This is because when multiple nodes are running on a single machine, the machine's hard disk is treated as an available store for each node, while in reality, only one hard disk is available for all nodes. The total available capacity is then calculated as the hard disk size multiplied by the number of nodes on the machine.
Events Panel
The Cluster Metrics dashboards display the Events panel that lists the 10 most recent events logged for the all nodes across the cluster. To view the Events panel, click Metrics on the left-hand navigation bar. To see the list of all events, click View all events in the Events panel.
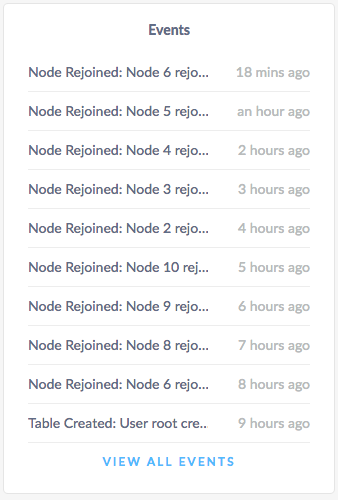
The following types of events are listed:
- Database created
- Database dropped
- Table created
- Table dropped
- Table altered
- Index created
- Index dropped
- View created
- View dropped
- Schema change reversed
- Schema change finished
- Node joined
- Node decommissioned
- Node restarted
- Cluster setting changed
