
The Runtime dashboard in the CockroachDB Admin UI lets you monitor runtime metrics for you cluster, such as node count, memory usage, and CPU time. To view this dashboard, access the Admin UI, click Metrics on the left-hand navigation bar, and then select Dashboard > Runtime.
The Runtime dashboard displays the following time series graphs:
Live Node Count
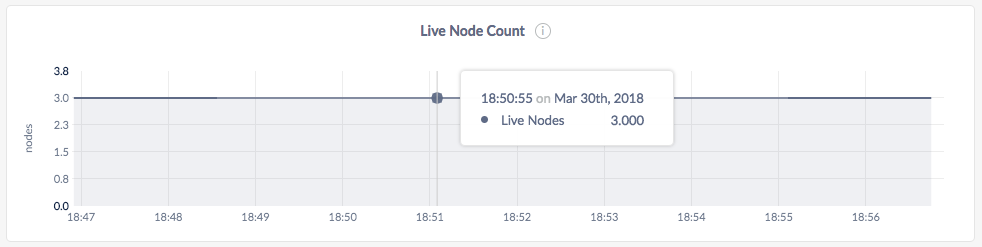
In the node view as well as the cluster view, the graph shows the number of live nodes in the cluster.
A dip in the graph indicates decommissioned nodes, dead nodes, or nodes that are not responding. To troubleshoot the dip in the graph, refer to the Summary panel.
Memory Usage
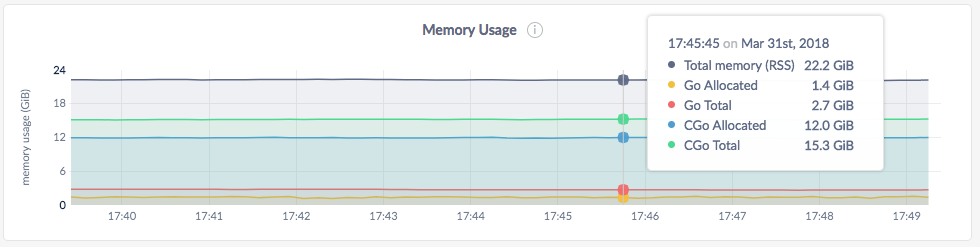
In the node view, the graph shows the memory in use for the selected node.
In the cluster view, the graph shows the memory in use across all nodes in the cluster.
On hovering over the graph, the values for the following metrics are displayed:
| Metric | Description |
|---|---|
| RSS | Total memory in use by CockroachDB. |
| Go Allocated | Memory allocated by the Go layer. |
| Go Total | Total memory managed by the Go layer. |
| CGo Allocated | Memory allocated by the C layer. |
| CGo Total | Total memory managed by the C layer. |
CPU Time
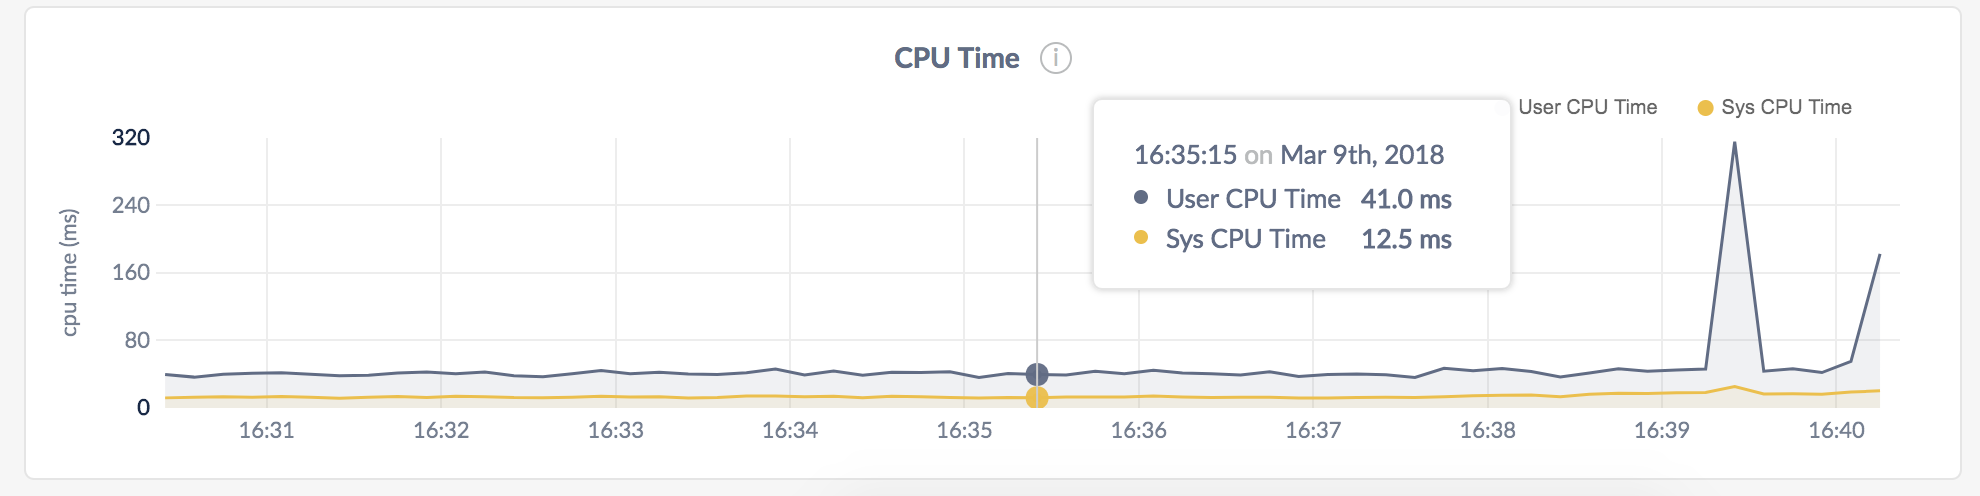
- In the node view, the graph shows the CPU time used by CockroachDB user and system-level operations for the selected node.
- In the cluster view, the graph shows the CPU time used by CockroachDB user and system-level operations across all nodes in the cluster.
On hovering over the CPU Time graph, the values for the following metrics are displayed:
| Metric | Description |
|---|---|
| User CPU Time | Total CPU seconds per second used by the CockroachDB process across all nodes. |
| Sys CPU Time | Total CPU seconds per second used for CockroachDB system-level operations across all nodes. |
Clock Offset
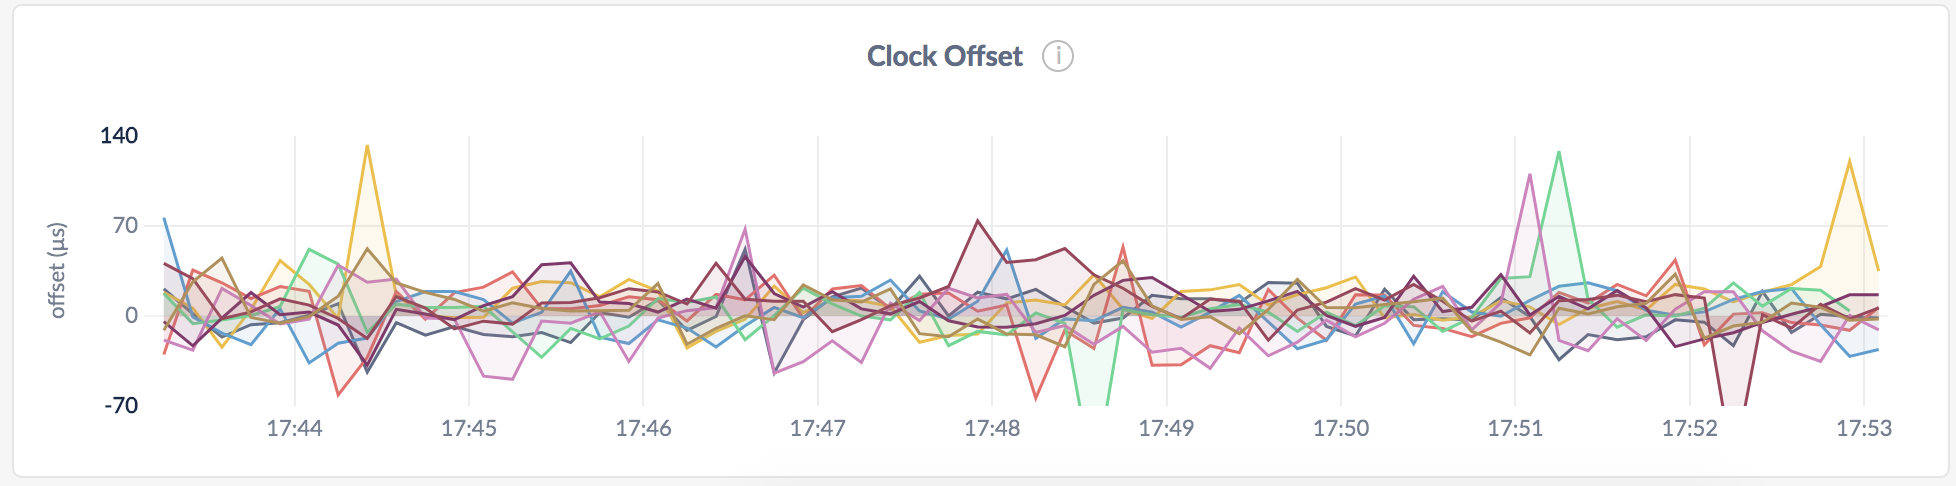
- In the node view, the graph shows the mean clock offset of the node against the rest of the cluster.
- In the cluster view, the graph shows the mean clock offset of each node against the rest of the cluster.
Other graphs
The Runtime dashboard shows other time series graphs that are important for CockroachDB developers:
- Goroutine Count
- GC Runs
- GC Pause Time
For monitoring CockroachDB, it is sufficient to use the Live Node Count, Memory Usage, CPU Time, and Clock Offset graphs.
