
The Replication dashboard in the CockroachDB Admin UI enables you to monitor the replication metrics for your cluster. To view this dashboard, access the Admin UI, click Metrics on the left-hand navigation bar, and then select Dashboard > Replication.
Review of CockroachDB terminology
- Range: CockroachDB stores all user data and almost all system data in a giant sorted map of key-value pairs. This keyspace is divided into "ranges", contiguous chunks of the keyspace, so that every key can always be found in a single range.
- Range Replica: CockroachDB replicates each range (3 times by default) and stores each replica on a different node.
- Range Lease: For each range, one of the replicas holds the "range lease". This replica, referred to as the "leaseholder", is the one that receives and coordinates all read and write requests for the range.
- Under-replicated Ranges: When a cluster is first initialized, the few default starting ranges will only have a single replica, but as soon as other nodes are available, they will replicate to them until they've reached their desired replication factor, the default being 3. If a range does not have enough replicas, the range is said to be "under-replicated".
- Unavailable Ranges: If a majority of a range's replicas are on nodes that are unavailable, then the entire range is unavailable and will be unable to process queries.
For more details, see Scalable SQL Made Easy: How CockroachDB Automates Operations
Replication dashboard
The Replication dashboard displays the following time series graphs:
Ranges
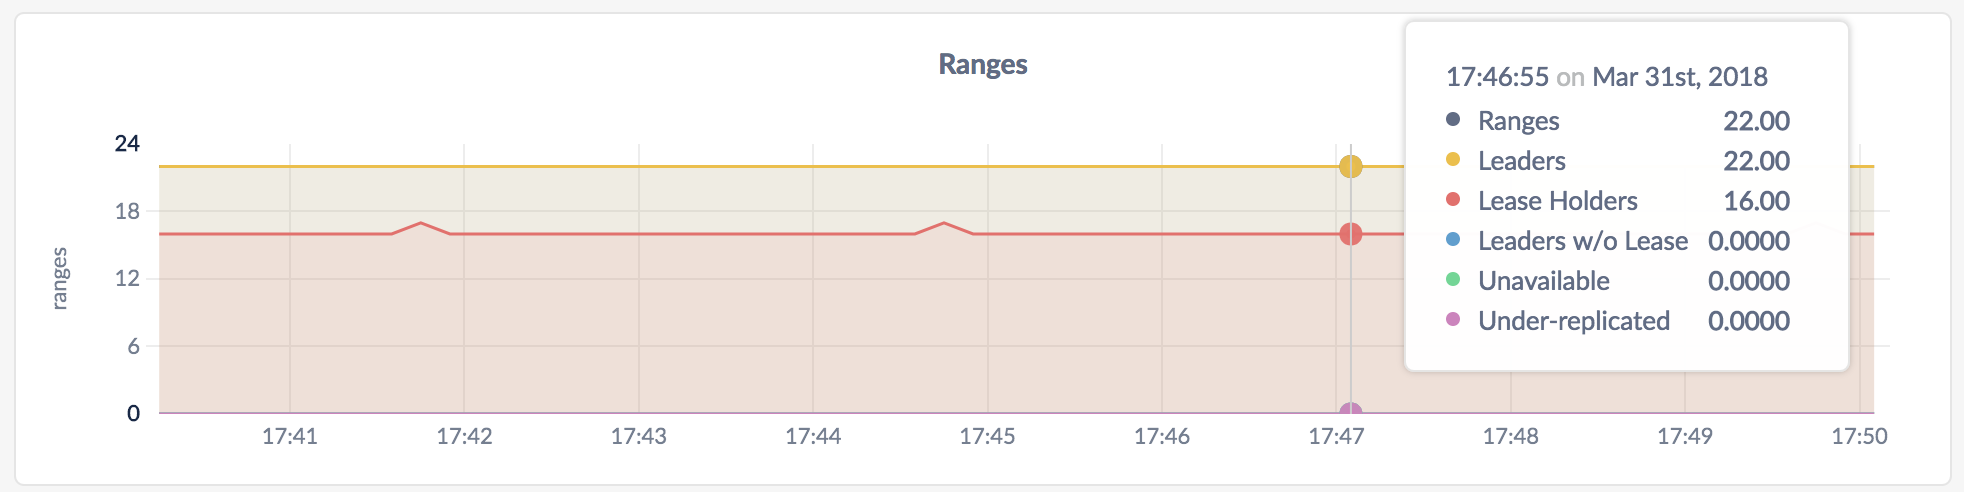
The Ranges graph shows you various details about the status of ranges.
In the node view, the graph shows details about ranges on the node.
In the cluster view, the graph shows details about ranges across all nodes in the cluster.
On hovering over the graph, the values for the following metrics are displayed:
| Metric | Description |
|---|---|
| Ranges | The number of ranges. |
| Leaders | The number of ranges with leaders. If the number does not match the number of ranges for a long time, troubleshoot your cluster. |
| Lease Holders | The number of ranges that have leases. |
| Leaders w/o Leases | The number of Raft leaders without leases. If the number if non-zero for a long time, troubleshoot your cluster. |
| Unavailable | The number of unavailable ranges. If the number if non-zero for a long time, troubleshoot your cluster. |
| Under-replicated | The number of under-replicated ranges. |
Replicas Per Store
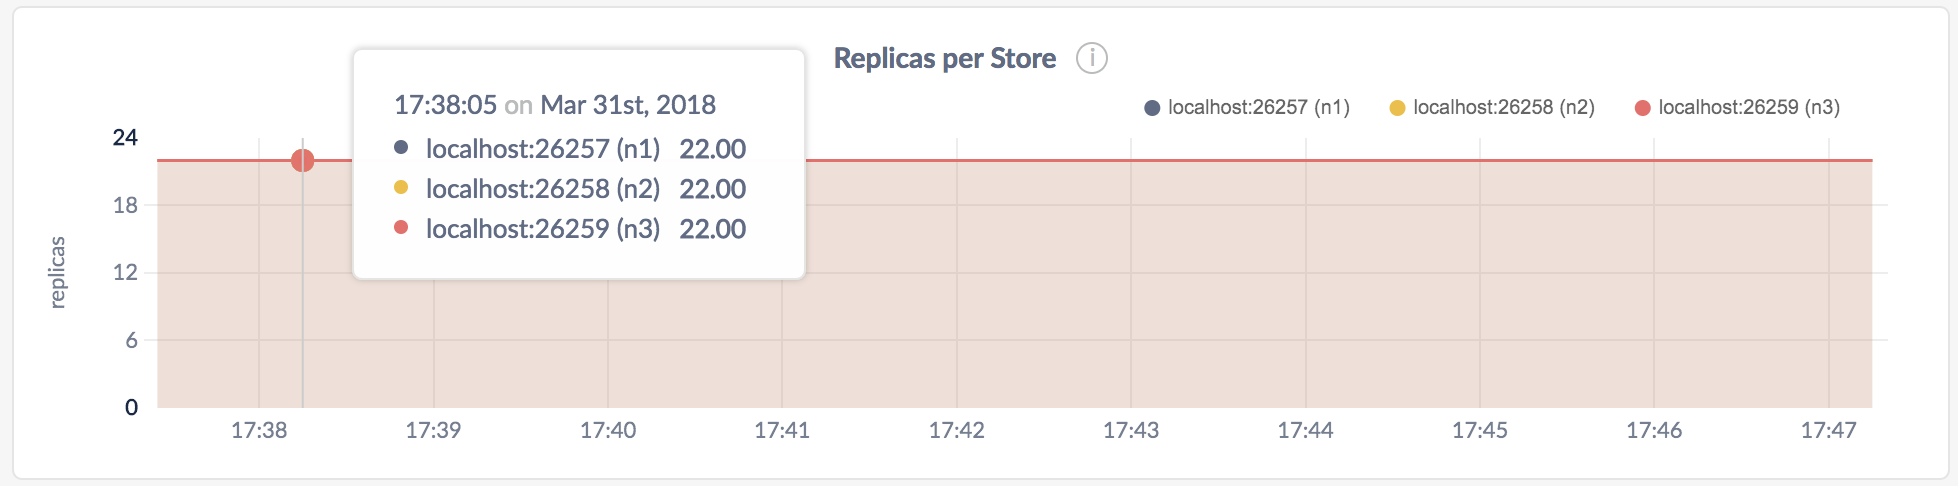
In the node view, the graph shows the number of range replicas on the store.
In the cluster view, the graph shows the number of range replicas on each store.
You can Configure replication zones to set the number and location of replicas. You can monitor the configuration changes using the Admin UI, as described in Fault tolerance and recovery.
Replica Quiescence
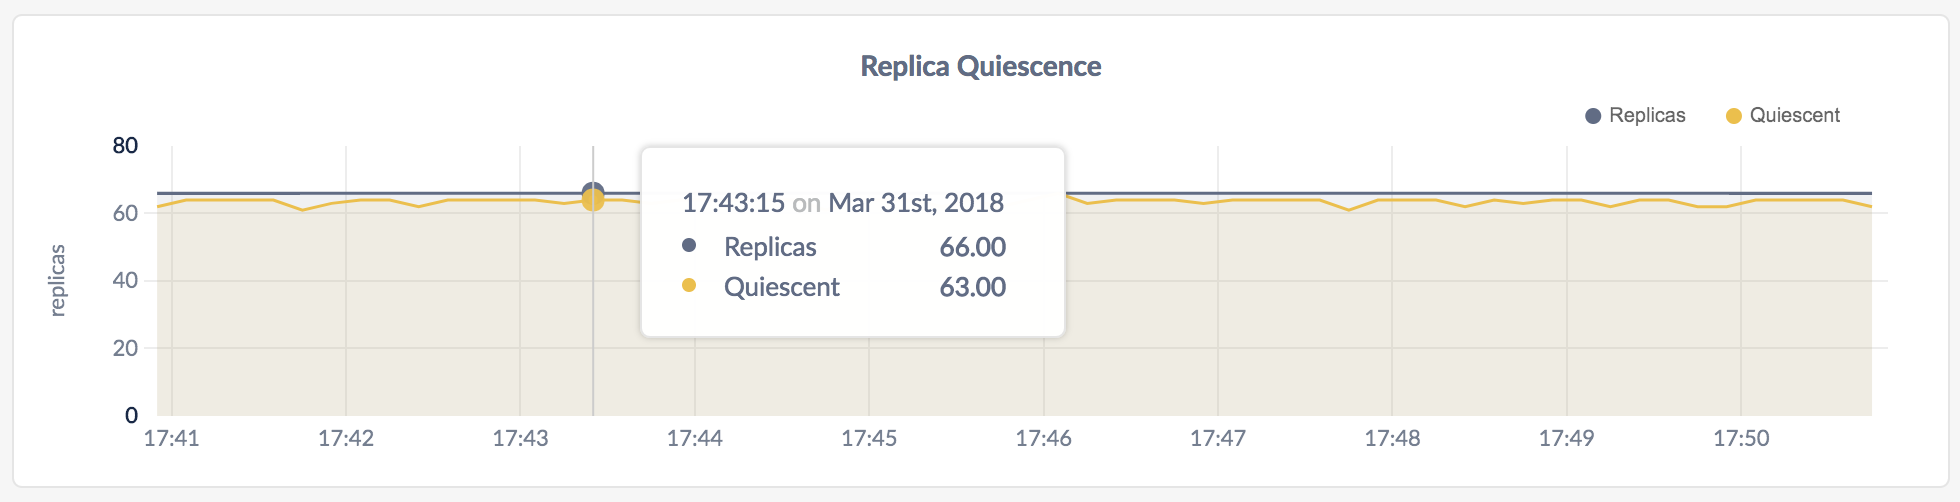
In the node view, the graph shows the number of replicas on the node.
In the cluster view, the graph shows the number of replicas across all nodes.
On hovering over the graph, the values for the following metrics are displayed:
| Metric | Description |
|---|---|
| Replicas | The number of replicas. |
| Quiescent | The number of replicas that haven't been accessed for a while. |
Snapshots
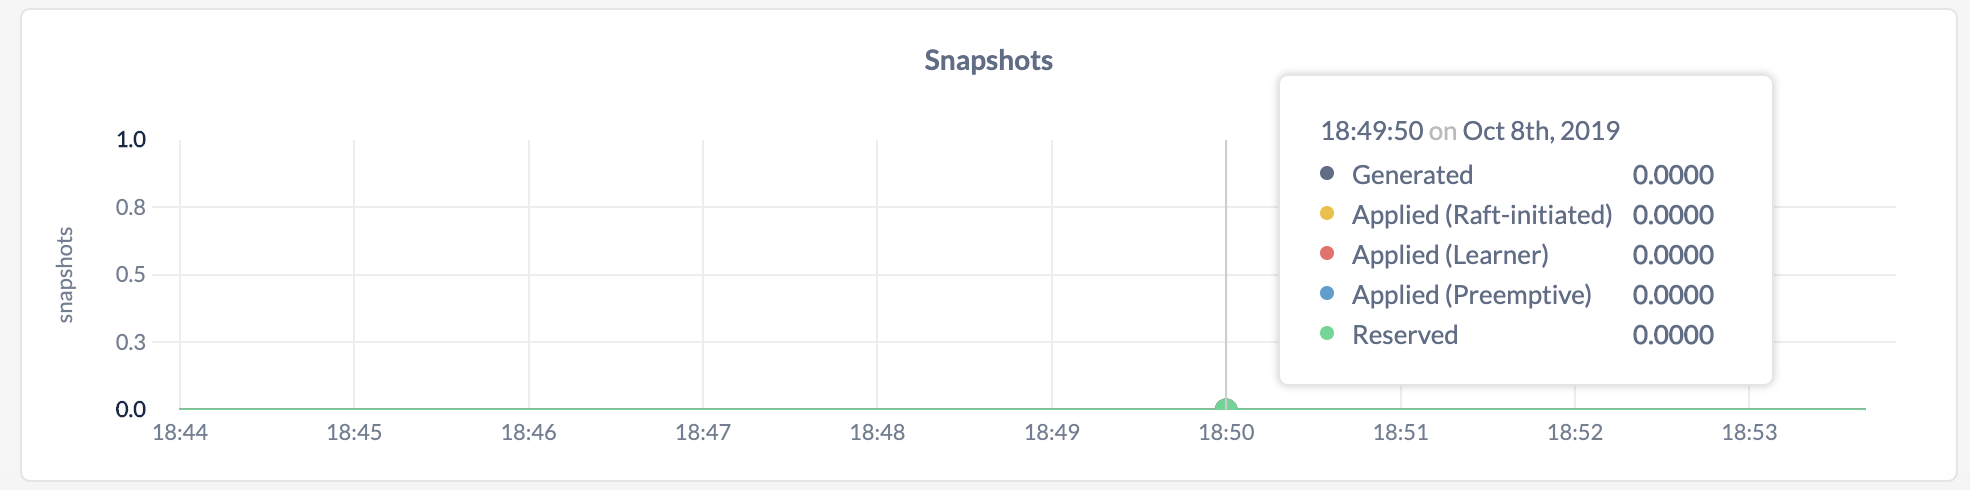
Usually the nodes in a Raft group stay synchronized by following along the log message by message. However, if a node is far enough behind the log (e.g., if it was offline or is a new node getting up to speed), rather than send all the individual messages that changed the range, the cluster can send it a snapshot of the range and it can start following along from there. Commonly this is done preemptively, when the cluster can predict that a node will need to catch up, but occasionally the Raft protocol itself will request the snapshot.
| Metric | Description |
|---|---|
| Generated | The number of snapshots created per second. |
| Applied (Raft-initiated) | The number of snapshots applied to nodes per second that were initiated within Raft. |
| Applied (Learner) | New in v19.2: The number of snapshots applied to nodes per second that were anticipated ahead of time (e.g., because a node was about to be added to a Raft group). This metric replaces the Applied (Preemptive) metric in 19.2 and onwards. |
| Applied (Preemptive) | The number of snapshots applied to nodes per second that were anticipated ahead of time (e.g., because a node was about to be added to a Raft group). This metric was used in pre-v19.2 releases and will be removed in future releases. |
| Reserved | The number of slots reserved per second for incoming snapshots that will be sent to a node. |
Other graphs
The Replication dashboard shows other time series graphs that are important for CockroachDB developers:
- Leaseholders per Store
- Average Queries per Store
- Logical Bytes per Store
- Range Operations
For monitoring CockroachDB, it is sufficient to use the Ranges, Replicas per Store, and Replica Quiescence graphs.
