
The built-in Admin UI helps you monitor and troubleshoot CockroachDB by providing information about the cluster's health, configuration, and operations.
Access the Admin UI
For insecure clusters, anyone can access and view the Admin UI. For secure clusters, only authorized users can access and view the Admin UI. In addition, certain areas of the Admin UI can only be accessed by admin users.
You can access the Admin UI from any node in the cluster.
The Admin UI is reachable at the IP address/hostname and port set via the --http-addr flag when starting each node, for example, http://<address from --http-addr>:<port from --http-addr> for an insecure cluster or https://<address from --http-addr>:<port from --http-addr> for a secure cluster.
If --http-addr is not specified when starting a node, the Admin UI is reachable at the IP address/hostname set via the --listen-addr flag and port 8080.
For additional guidance on accessing the Admin UI in the context of cluster deployment, see Start a Local Cluster and Manual Deployment.
Accessing the Admin UI for a secure cluster
Note that on secure clusters, certain areas of the Admin UI can only be accessed by admin users. For details on providing access to users, see this page.
On accessing the Admin UI, your browser will consider the CockroachDB-created certificate invalid, so you’ll need to click through a warning message to get to the UI. For secure clusters, you can avoid getting the warning message by using a certificate issued by a public CA. For more information, refer to Use a UI certificate and key to access the Admin UI.
For each user who should have access to the Admin UI for a secure cluster, create a user with a password. On accessing the Admin UI, the users will see a Login screen, where they will need to enter their usernames and passwords.
This login information is stored in a system table that is replicated like other data in the cluster. If a majority of the nodes with the replicas of the system table data go down, users will be locked out of the Admin UI.
To log out of the Admin UI, click the Log Out link at the bottom of the left-hand navigation bar.
Navigate the Admin UI
The left-hand navigation bar allows you to navigate to the Cluster Overview page, cluster metrics dashboards, the Databases page, the Statements page, the Jobs page, and the Advanced Debugging page.
The main panel display changes for each page:
| Page | Main Panel Component |
|---|---|
| Cluster Overview |
|
| Cluster Metrics | |
| Databases | Information about the tables and grants in your databases. |
| Statements | Information about the SQL statements running in the cluster. |
| Jobs | Information about all currently active schema changes and backup/restore jobs. |
| Advanced Debugging | Advanced monitoring and troubleshooting reports. These pages are experimental. If you find an issue, let us know through these channels. |
Cluster Metrics
The Cluster Metrics dashboards display the time series graphs that are useful to visualize and monitor data trends. To access the time series graphs, click Metrics on the left.
You can hover over each graph to see actual point-in-time values.
By default, CockroachDB stores time series metrics for the last 30 days, but you can reduce the interval for timeseries storage. Alternatively, if you are exclusively using a third-party tool such as Prometheus for time series monitoring, you can disable time series storage entirely. For more details, see this FAQ.
Change time range
You can change the time range by clicking on the time window.
View metrics for a single node
By default, the time series panel displays the metrics for the entire cluster. To view the metrics for an individual node, select the node from the Graph drop-down list.
Summary panel
The Cluster Metrics dashboards display the Summary panel of key metrics. To view the Summary panel, click Metrics on the left.
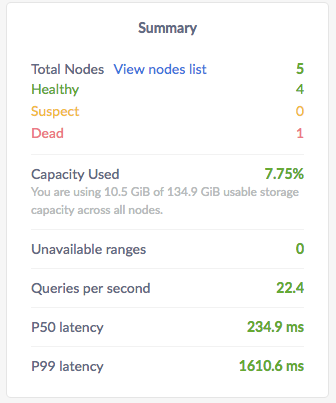
The Summary panel provides the following metrics:
| Metric | Description |
|---|---|
| Total Nodes | The total number of nodes in the cluster. Decommissioned nodes are not included in the Total Nodes count. You can further drill down into the nodes details by clicking on View nodes list. |
| Dead Nodes | The number of dead nodes in the cluster. |
| Capacity Used | The storage capacity used as a percentage of total storage capacity allocated across all nodes. |
| Unavailable Ranges | The number of unavailable ranges in the cluster. A non-zero number indicates an unstable cluster. |
| Queries per second | The total number of SELECT, UPDATE, INSERT, and DELETE queries executed per second across the cluster. |
| P50 Latency | The 50th percentile of service latency. Service latency is calculated as the time between when the cluster receives a query and finishes executing the query. This time does not include returning results to the client. |
| P99 Latency | The 99th percentile of service latency. |
If you are running multiple nodes on a single machine (not recommended in production) and didn't specify the maximum allocated storage capacity for each node using the --store flag, the capacity metrics in the Admin UI are incorrect. This is because when multiple nodes are running on a single machine, the machine's hard disk is treated as an available store for each node, while in reality, only one hard disk is available for all nodes. The total available capacity is then calculated as the hard disk size multiplied by the number of nodes on the machine.
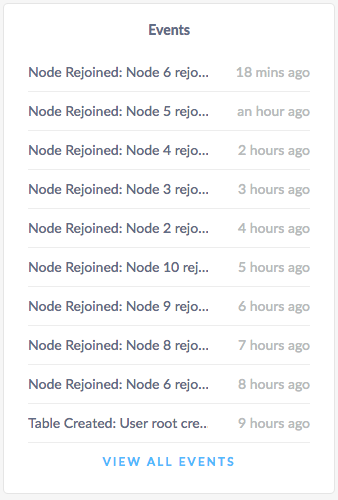
Events panel
The Cluster Metrics dashboards display the Events panel that lists the 10 most recent events logged for the all nodes across the cluster. To view the Events panel, click Metrics on the left-hand navigation bar. To see the list of all events, click View all events in the Events panel.
The following types of events are listed:
- Database created
- Database dropped
- Table created
- Table dropped
- Table altered
- Index created
- Index dropped
- View created
- View dropped
- Schema change reversed
- Schema change finished
- Node joined
- Node decommissioned
- Node restarted
- Cluster setting changed
