
The Custom Chart debug page in the Admin UI can be used to create one or multiple custom charts showing any combination of over 200 available metrics.
The definition of the customized dashboard is encoded in the URL. To share the dashboard with someone, send them the URL. Like any other URL, it can be bookmarked, sit in a pinned tab in your browser, etc.
Accessing the Custom Chart page
To access the Custom Chart debug page, access the Admin UI, and either:
Open http://localhost:8080/#/debug/chart in your browser (replacing
localhostand8080with your node's host and port).Click the gear icon on the left to access the Advanced Debugging Page. In the Reports section, click Custom TimeSeries Chart.
Using the Custom Chart page
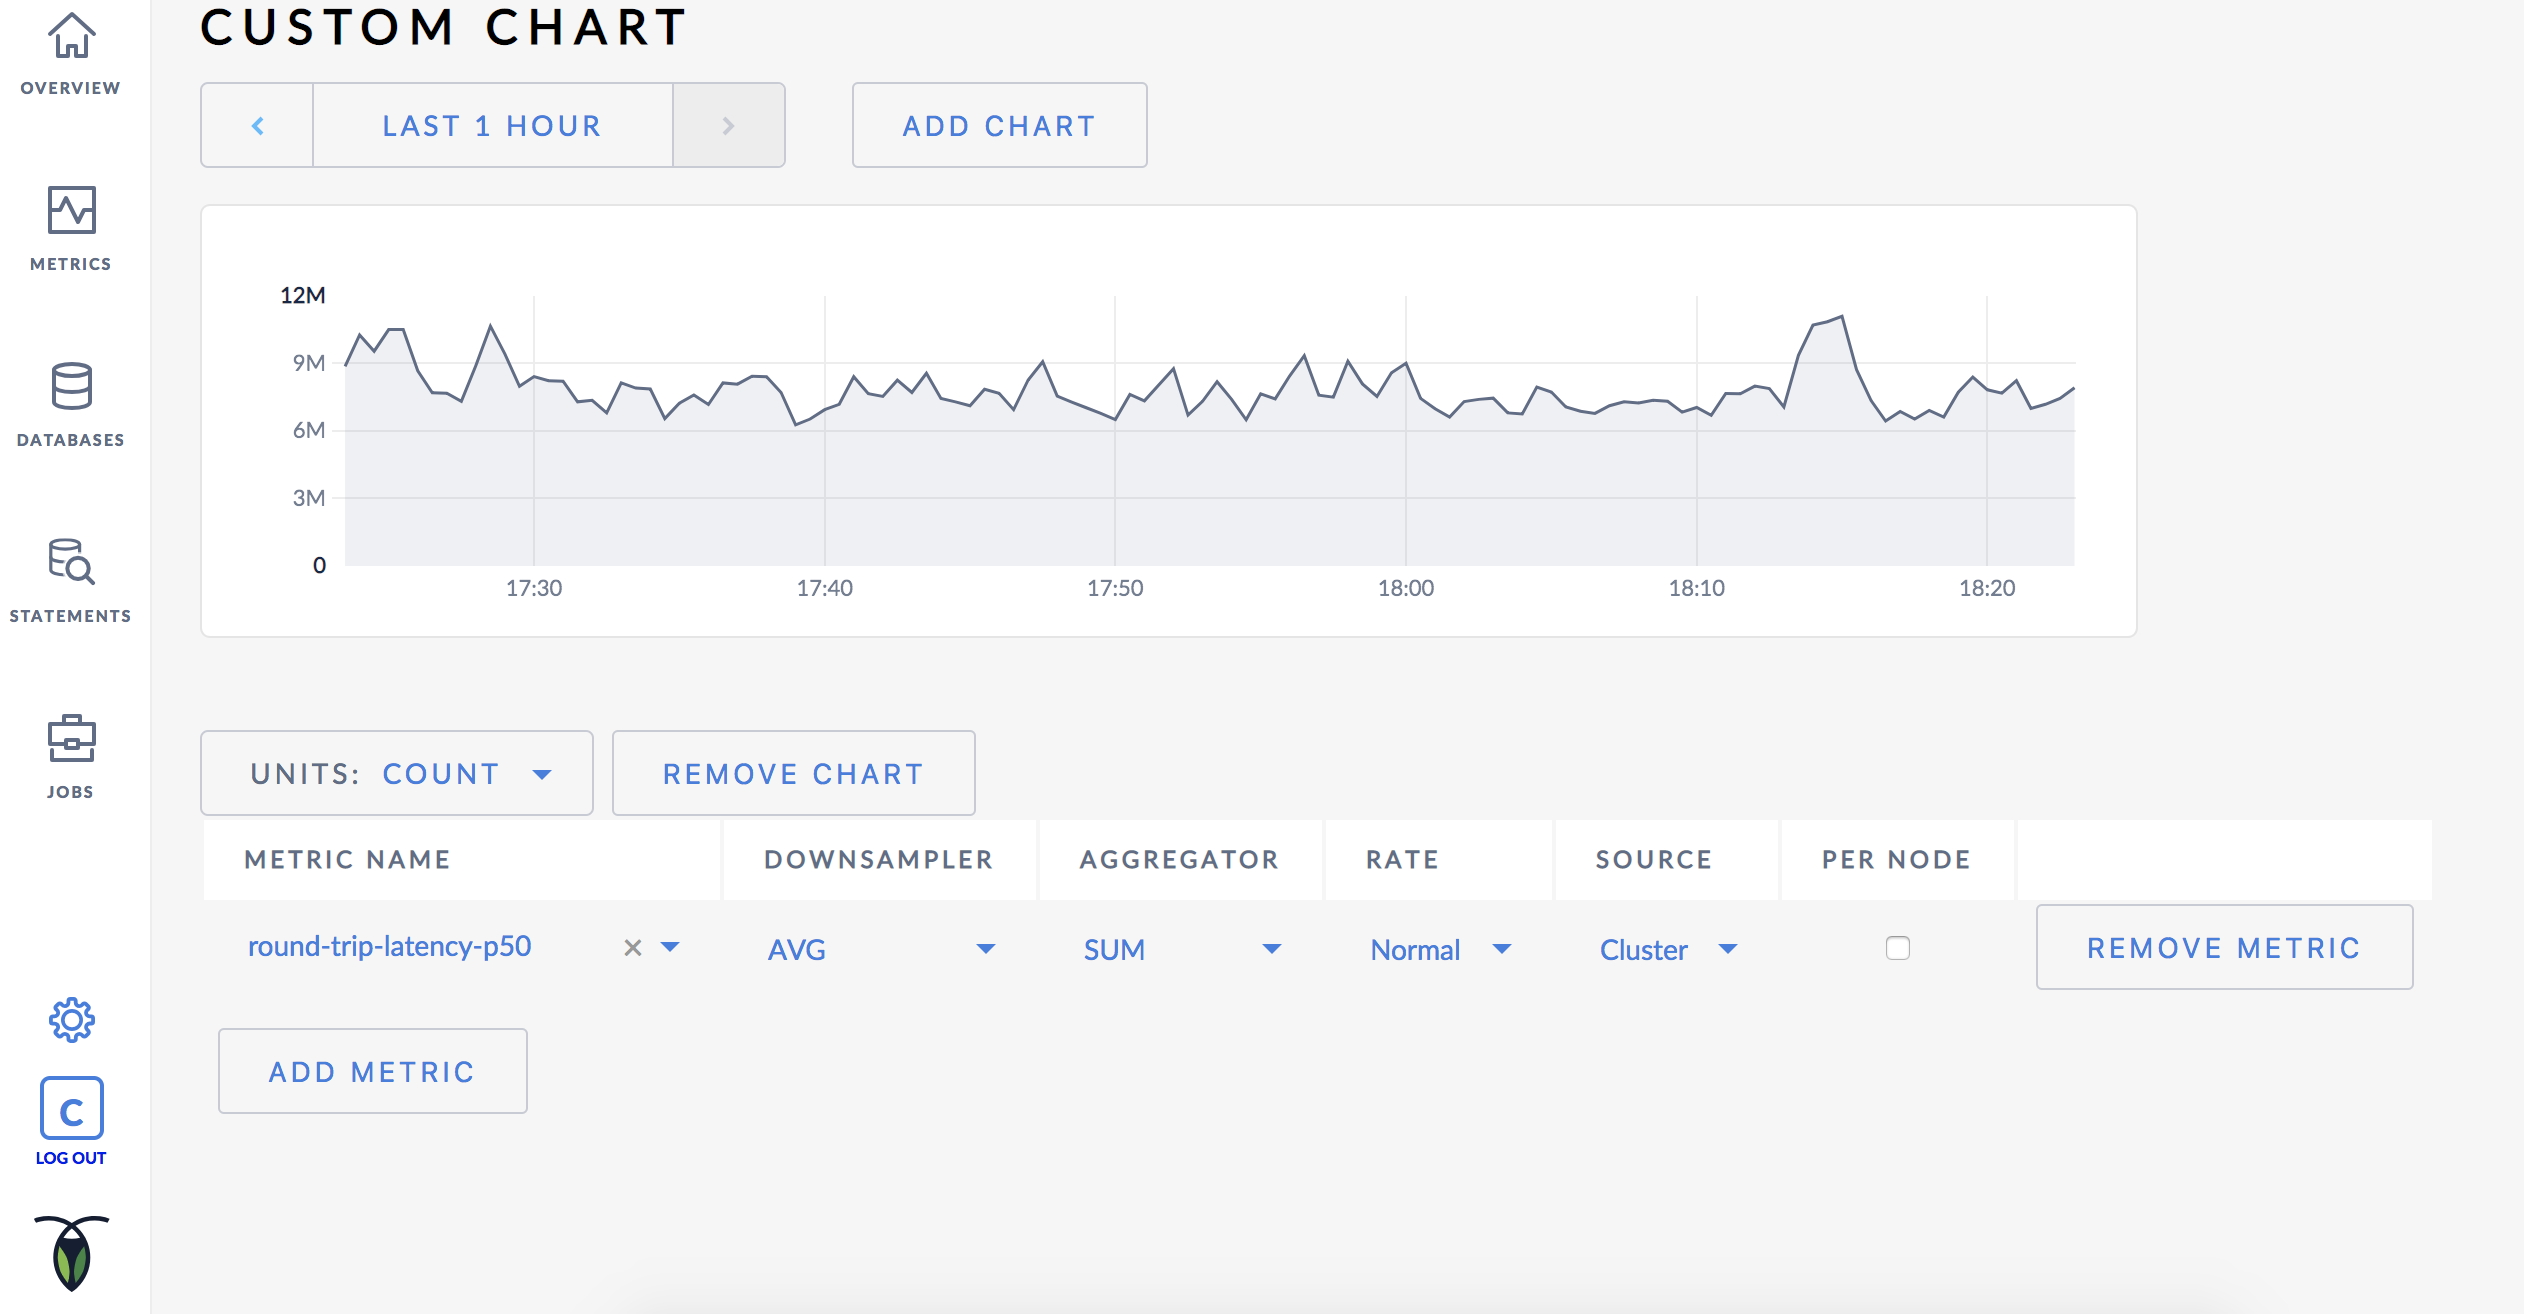
On the Custom Chart page, you can set the time span for all charts, add new custom charts, and customize each chart:
To set the time span for the page, use the dropdown menu above the charts and select the desired time span.
To add a chart, click Add Chart and customize the new chart.
To customize each chart, use the Units dropdown menu to set the units to display. Then use the table below the chart to select the metrics being queried, and how they'll be combined and displayed. Options include:
Column Description Metric Name How the system refers to this metric, e.g., sql.bytesin.Downsampler The "Downsampler" operation is used to combine the individual datapoints over the longer period into a single datapoint. We store one data point every ten seconds, but for queries over long time spans the backend lowers the resolution of the returned data, perhaps only returning one data point for every minute, five minutes, or even an entire hour in the case of the 30 day view.
Options:
- AVG: Returns the average value over the time period.
- MIN: Returns the lowest value seen.
- MAX: Returns the highest value seen.
- SUM: Returns the sum of all values seen.
Aggregator Used to combine data points from different nodes. It has the same operations available as the Downsampler.
Options:
- AVG: Returns the average value over the time period.
- MIN: Returns the lowest value seen.
- MAX: Returns the highest value seen.
- SUM: Returns the sum of all values seen.
Rate Determines how to display the rate of change during the selected time period.
Options:
- Normal: Returns the actual recorded value.
- Rate: Returns the rate of change of the value per second.
- Non-negative Rate: Returns the rate-of-change, but returns 0 instead of negative values. A large number of the stats we track are actually tracked as monotonically increasing counters so each sample is just the total value of that counter. The rate of change of that counter represents the rate of events being counted, which is usually what you want to graph. "Non-negative Rate" is needed because the counters are stored in memory, and thus if a node resets it goes back to zero (whereas normally they only increase).
Source The set of nodes being queried, which is either: - The entire cluster.
- A single, named node.
Per Node If checked, the chart will show a line for each node's value of this metric.
Examples
Query user and system CPU usage
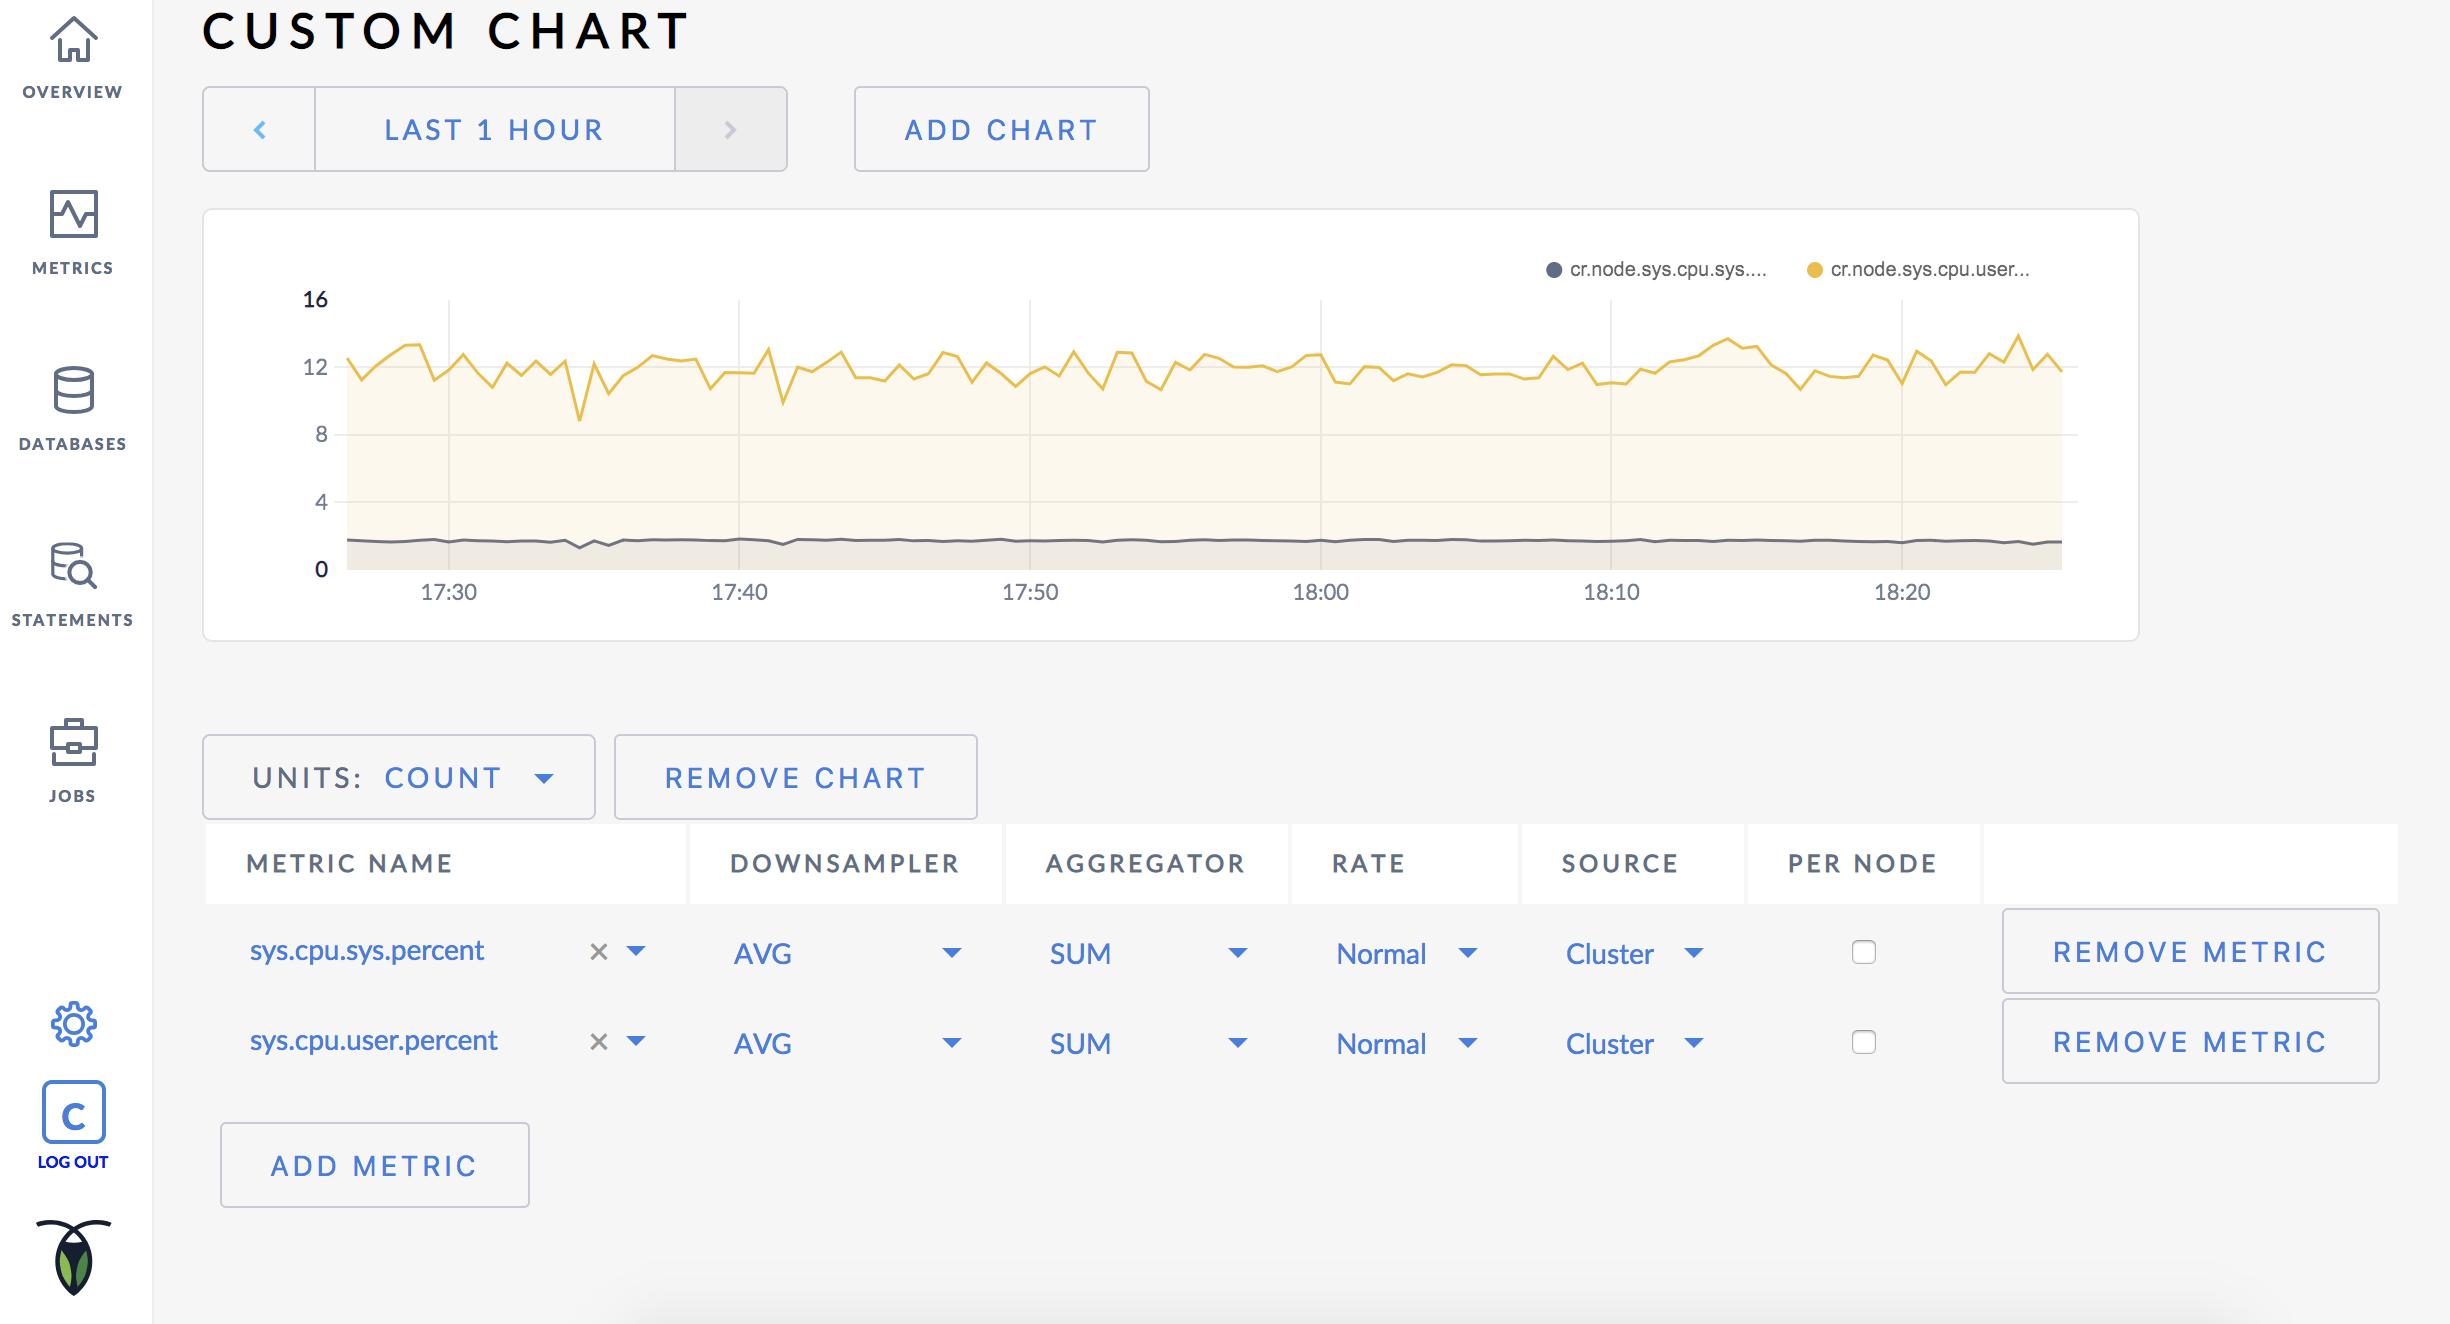
To compare system vs. userspace CPU usage, select the following values under Metric Name:
sys.cpu.sys.percentsys.cpu.user.percent
The Y-axis label is the Count. A count of 1 represents 100% utilization. The Aggregator of Sum can show the count to be above 1, which would mean CPU utilization is greater than 100%.
Checking Per Node displays statistics for each node, which could show whether an individual node's CPU usage was higher or lower than the average.
Available metrics
This list is taken directly from the source code and is subject to change. Some of the metrics listed below are already visible in other areas of the Admin UI.
| Name | Help |
|---|---|
addsstable.applications |
Number of SSTable ingestions applied (i.e., applied by Replicas) |
addsstable.copies |
Number of SSTable ingestions that required copying files during application |
addsstable.proposals |
Number of SSTable ingestions proposed (i.e., sent to Raft by lease holders) |
build.timestamp |
Build information |
capacity.available |
Available storage capacity |
capacity.reserved |
Capacity reserved for snapshots |
capacity.used |
Used storage capacity |
capacity |
Total storage capacity |
clock-offset.meannanos |
Mean clock offset with other nodes in nanoseconds |
clock-offset.stddevnanos |
Std dev clock offset with other nodes in nanoseconds |
compactor.compactingnanos |
Number of nanoseconds spent compacting ranges |
compactor.compactions.failure |
Number of failed compaction requests sent to the storage engine |
compactor.compactions.success |
Number of successful compaction requests sent to the storage engine |
compactor.suggestionbytes.compacted |
Number of logical bytes compacted from suggested compactions |
compactor.suggestionbytes.queued |
Number of logical bytes in suggested compactions in the queue |
compactor.suggestionbytes.skipped |
Number of logical bytes in suggested compactions which were not compacted |
distsender.batches.partial |
Number of partial batches processed |
distsender.batches |
Number of batches processed |
distsender.errors.notleaseholder |
Number of NotLeaseHolderErrors encountered |
distsender.rpc.sent.local |
Number of local RPCs sent |
distsender.rpc.sent.nextreplicaerror |
Number of RPCs sent due to per-replica errors |
distsender.rpc.sent |
Number of RPCs sent |
exec.error |
Number of batch KV requests that failed to execute on this node |
exec.latency |
Latency in nanoseconds of batch KV requests executed on this node |
exec.success |
Number of batch KV requests executed successfully on this node |
gcbytesage |
Cumulative age of non-live data in seconds |
gossip.bytes.received |
Number of received gossip bytes |
gossip.bytes.sent |
Number of sent gossip bytes |
gossip.connections.incoming |
Number of active incoming gossip connections |
gossip.connections.outgoing |
Number of active outgoing gossip connections |
gossip.connections.refused |
Number of refused incoming gossip connections |
gossip.infos.received |
Number of received gossip Info objects |
gossip.infos.sent |
Number of sent gossip Info objects |
intentage |
Cumulative age of intents in seconds |
intentbytes |
Number of bytes in intent KV pairs |
intentcount |
Count of intent keys |
keybytes |
Number of bytes taken up by keys |
keycount |
Count of all keys |
lastupdatenanos |
Time in nanoseconds since Unix epoch at which bytes/keys/intents metrics were last updated |
leases.epoch |
Number of replica leaseholders using epoch-based leases |
leases.error |
Number of failed lease requests |
leases.expiration |
Number of replica leaseholders using expiration-based leases |
leases.success |
Number of successful lease requests |
leases.transfers.error |
Number of failed lease transfers |
leases.transfers.success |
Number of successful lease transfers |
livebytes |
Number of bytes of live data (keys plus values) |
livecount |
Count of live keys |
liveness.epochincrements |
Number of times this node has incremented its liveness epoch |
liveness.heartbeatfailures |
Number of failed node liveness heartbeats from this node |
liveness.heartbeatlatency |
Node liveness heartbeat latency in nanoseconds |
liveness.heartbeatsuccesses |
Number of successful node liveness heartbeats from this node |
liveness.livenodes |
Number of live nodes in the cluster (will be 0 if this node is not itself live) |
node-id |
node ID with labels for advertised RPC and HTTP addresses |
queue.consistency.pending |
Number of pending replicas in the consistency checker queue |
queue.consistency.process.failure |
Number of replicas which failed processing in the consistency checker queue |
queue.consistency.process.success |
Number of replicas successfully processed by the consistency checker queue |
queue.consistency.processingnanos |
Nanoseconds spent processing replicas in the consistency checker queue |
queue.gc.info.abortspanconsidered |
Number of AbortSpan entries old enough to be considered for removal |
queue.gc.info.abortspangcnum |
Number of AbortSpan entries fit for removal |
queue.gc.info.abortspanscanned |
Number of transactions present in the AbortSpan scanned from the engine |
queue.gc.info.intentsconsidered |
Number of 'old' intents |
queue.gc.info.intenttxns |
Number of associated distinct transactions |
queue.gc.info.numkeysaffected |
Number of keys with GC'able data |
queue.gc.info.pushtxn |
Number of attempted pushes |
queue.gc.info.resolvesuccess |
Number of successful intent resolutions |
queue.gc.info.resolvetotal |
Number of attempted intent resolutions |
queue.gc.info.transactionspangcaborted |
Number of GC'able entries corresponding to aborted txns |
queue.gc.info.transactionspangccommitted |
Number of GC'able entries corresponding to committed txns |
queue.gc.info.transactionspangcpending |
Number of GC'able entries corresponding to pending txns |
queue.gc.info.transactionspanscanned |
Number of entries in transaction spans scanned from the engine |
queue.gc.pending |
Number of pending replicas in the GC queue |
queue.gc.process.failure |
Number of replicas which failed processing in the GC queue |
queue.gc.process.success |
Number of replicas successfully processed by the GC queue |
queue.gc.processingnanos |
Nanoseconds spent processing replicas in the GC queue |
queue.raftlog.pending |
Number of pending replicas in the Raft log queue |
queue.raftlog.process.failure |
Number of replicas which failed processing in the Raft log queue |
queue.raftlog.process.success |
Number of replicas successfully processed by the Raft log queue |
queue.raftlog.processingnanos |
Nanoseconds spent processing replicas in the Raft log queue |
queue.raftsnapshot.pending |
Number of pending replicas in the Raft repair queue |
queue.raftsnapshot.process.failure |
Number of replicas which failed processing in the Raft repair queue |
queue.raftsnapshot.process.success |
Number of replicas successfully processed by the Raft repair queue |
queue.raftsnapshot.processingnanos |
Nanoseconds spent processing replicas in the Raft repair queue |
queue.replicagc.pending |
Number of pending replicas in the replica GC queue |
queue.replicagc.process.failure |
Number of replicas which failed processing in the replica GC queue |
queue.replicagc.process.success |
Number of replicas successfully processed by the replica GC queue |
queue.replicagc.processingnanos |
Nanoseconds spent processing replicas in the replica GC queue |
queue.replicagc.removereplica |
Number of replica removals attempted by the replica gc queue |
queue.replicate.addreplica |
Number of replica additions attempted by the replicate queue |
queue.replicate.pending |
Number of pending replicas in the replicate queue |
queue.replicate.process.failure |
Number of replicas which failed processing in the replicate queue |
queue.replicate.process.success |
Number of replicas successfully processed by the replicate queue |
queue.replicate.processingnanos |
Nanoseconds spent processing replicas in the replicate queue |
queue.replicate.purgatory |
Number of replicas in the replicate queue's purgatory, awaiting allocation options |
queue.replicate.rebalancereplica |
Number of replica rebalancer-initiated additions attempted by the replicate queue |
queue.replicate.removedeadreplica |
Number of dead replica removals attempted by the replicate queue (typically in response to a node outage) |
queue.replicate.removereplica |
Number of replica removals attempted by the replicate queue (typically in response to a rebalancer-initiated addition) |
queue.replicate.transferlease |
Number of range lease transfers attempted by the replicate queue |
queue.split.pending |
Number of pending replicas in the split queue |
queue.split.process.failure |
Number of replicas which failed processing in the split queue |
queue.split.process.success |
Number of replicas successfully processed by the split queue |
queue.split.processingnanos |
Nanoseconds spent processing replicas in the split queue |
queue.tsmaintenance.pending |
Number of pending replicas in the time series maintenance queue |
queue.tsmaintenance.process.failure |
Number of replicas which failed processing in the time series maintenance queue |
queue.tsmaintenance.process.success |
Number of replicas successfully processed by the time series maintenance queue |
queue.tsmaintenance.processingnanos |
Nanoseconds spent processing replicas in the time series maintenance queue |
raft.commandsapplied |
Count of Raft commands applied |
raft.enqueued.pending |
Number of pending outgoing messages in the Raft Transport queue |
raft.heartbeats.pending |
Number of pending heartbeats and responses waiting to be coalesced |
raft.process.commandcommit.latency |
Latency histogram in nanoseconds for committing Raft commands |
raft.process.logcommit.latency |
Latency histogram in nanoseconds for committing Raft log entries |
raft.process.tickingnanos |
Nanoseconds spent in store.processRaft() processing replica.Tick() |
raft.process.workingnanos |
Nanoseconds spent in store.processRaft() working |
raft.rcvd.app |
Number of MsgApp messages received by this store |
raft.rcvd.appresp |
Number of MsgAppResp messages received by this store |
raft.rcvd.dropped |
Number of dropped incoming Raft messages |
raft.rcvd.heartbeat |
Number of (coalesced, if enabled) MsgHeartbeat messages received by this store |
raft.rcvd.heartbeatresp |
Number of (coalesced, if enabled) MsgHeartbeatResp messages received by this store |
raft.rcvd.prevote |
Number of MsgPreVote messages received by this store |
raft.rcvd.prevoteresp |
Number of MsgPreVoteResp messages received by this store |
raft.rcvd.prop |
Number of MsgProp messages received by this store |
raft.rcvd.snap |
Number of MsgSnap messages received by this store |
raft.rcvd.timeoutnow |
Number of MsgTimeoutNow messages received by this store |
raft.rcvd.transferleader |
Number of MsgTransferLeader messages received by this store |
raft.rcvd.vote |
Number of MsgVote messages received by this store |
raft.rcvd.voteresp |
Number of MsgVoteResp messages received by this store |
raft.ticks |
Number of Raft ticks queued |
raftlog.behind |
Number of Raft log entries followers on other stores are behind |
raftlog.truncated |
Number of Raft log entries truncated |
range.adds |
Number of range additions |
range.raftleadertransfers |
Number of raft leader transfers |
range.removes |
Number of range removals |
range.snapshots.generated |
Number of generated snapshots |
range.snapshots.normal-applied |
Number of applied snapshots |
range.snapshots.preemptive-applied |
Number of applied preemptive snapshots |
range.splits |
Number of range splits |
ranges.unavailable |
Number of ranges with fewer live replicas than needed for quorum |
ranges.underreplicated |
Number of ranges with fewer live replicas than the replication target |
ranges |
Number of ranges |
rebalancing.writespersecond |
Number of keys written (i.e., applied by raft) per second to the store, averaged over a large time period as used in rebalancing decisions |
replicas.commandqueue.combinedqueuesize |
Number of commands in all CommandQueues combined |
replicas.commandqueue.combinedreadcount |
Number of read-only commands in all CommandQueues combined |
replicas.commandqueue.combinedwritecount |
Number of read-write commands in all CommandQueues combined |
replicas.commandqueue.maxoverlaps |
Largest number of overlapping commands seen when adding to any CommandQueue |
replicas.commandqueue.maxreadcount |
Largest number of read-only commands in any CommandQueue |
replicas.commandqueue.maxsize |
Largest number of commands in any CommandQueue |
replicas.commandqueue.maxtreesize |
Largest number of intervals in any CommandQueue's interval tree |
replicas.commandqueue.maxwritecount |
Largest number of read-write commands in any CommandQueue |
replicas.leaders_not_leaseholders |
Number of replicas that are Raft leaders whose range lease is held by another store |
replicas.leaders |
Number of raft leaders |
replicas.leaseholders |
Number of lease holders |
replicas.quiescent |
Number of quiesced replicas |
replicas.reserved |
Number of replicas reserved for snapshots |
replicas |
Number of replicas |
requests.backpressure.split |
Number of backpressured writes waiting on a Range split |
requests.slow.commandqueue |
Number of requests that have been stuck for a long time in the command queue |
requests.slow.distsender |
Number of requests that have been stuck for a long time in the dist sender |
requests.slow.lease |
Number of requests that have been stuck for a long time acquiring a lease |
requests.slow.raft |
Number of requests that have been stuck for a long time in raft |
rocksdb.block.cache.hits |
Count of block cache hits |
rocksdb.block.cache.misses |
Count of block cache misses |
rocksdb.block.cache.pinned-usage |
Bytes pinned by the block cache |
rocksdb.block.cache.usage |
Bytes used by the block cache |
rocksdb.bloom.filter.prefix.checked |
Number of times the bloom filter was checked |
rocksdb.bloom.filter.prefix.useful |
Number of times the bloom filter helped avoid iterator creation |
rocksdb.compactions |
Number of table compactions |
rocksdb.flushes |
Number of table flushes |
rocksdb.memtable.total-size |
Current size of memtable in bytes |
rocksdb.num-sstables |
Number of rocksdb SSTables |
rocksdb.read-amplification |
Number of disk reads per query |
rocksdb.table-readers-mem-estimate |
Memory used by index and filter blocks |
round-trip-latency |
Distribution of round-trip latencies with other nodes in nanoseconds |
security.certificate.expiration.ca |
Expiration timestamp in seconds since Unix epoch for the CA certificate. 0 means no certificate or error. |
security.certificate.expiration.node |
Expiration timestamp in seconds since Unix epoch for the node certificate. 0 means no certificate or error. |
sql.bytesin |
Number of sql bytes received |
sql.bytesout |
Number of sql bytes sent |
sql.conns |
Number of active sql connections |
sql.ddl.count |
Number of SQL DDL statements |
sql.delete.count |
Number of SQL DELETE statements |
sql.distsql.exec.latency |
Latency in nanoseconds of DistSQL statement execution |
sql.distsql.flows.active |
Number of distributed SQL flows currently active |
sql.distsql.flows.total |
Number of distributed SQL flows executed |
sql.distsql.queries.active |
Number of distributed SQL queries currently active |
sql.distsql.queries.total |
Number of distributed SQL queries executed |
sql.distsql.select.count |
Number of DistSQL SELECT statements |
sql.distsql.service.latency |
Latency in nanoseconds of DistSQL request execution |
sql.exec.latency |
Latency in nanoseconds of SQL statement execution |
sql.insert.count |
Number of SQL INSERT statements |
sql.mem.current |
Current sql statement memory usage |
sql.mem.distsql.current |
Current sql statement memory usage for distsql |
sql.mem.distsql.max |
Memory usage per sql statement for distsql |
sql.mem.max |
Memory usage per sql statement |
sql.mem.session.current |
Current sql session memory usage |
sql.mem.session.max |
Memory usage per sql session |
sql.mem.txn.current |
Current sql transaction memory usage |
sql.mem.txn.max |
Memory usage per sql transaction |
sql.misc.count |
Number of other SQL statements |
sql.query.count |
Number of SQL queries |
sql.select.count |
Number of SQL SELECT statements |
sql.service.latency |
Latency in nanoseconds of SQL request execution |
sql.txn.abort.count |
Number of SQL transaction ABORT statements |
sql.txn.begin.count |
Number of SQL transaction BEGIN statements |
sql.txn.commit.count |
Number of SQL transaction COMMIT statements |
sql.txn.rollback.count |
Number of SQL transaction ROLLBACK statements |
sql.update.count |
Number of SQL UPDATE statements |
sys.cgo.allocbytes |
Current bytes of memory allocated by cgo |
sys.cgo.totalbytes |
Total bytes of memory allocated by cgo, but not released |
sys.cgocalls |
Total number of cgo call |
sys.cpu.sys.ns |
Total system cpu time in nanoseconds |
sys.cpu.sys.percent |
Current system cpu percentage |
sys.cpu.user.ns |
Total user cpu time in nanoseconds |
sys.cpu.user.percent |
Current user cpu percentage |
sys.fd.open |
Process open file descriptors |
sys.fd.softlimit |
Process open FD soft limit |
sys.gc.count |
Total number of GC runs |
sys.gc.pause.ns |
Total GC pause in nanoseconds |
sys.gc.pause.percent |
Current GC pause percentage |
sys.go.allocbytes |
Current bytes of memory allocated by go |
sys.go.totalbytes |
Total bytes of memory allocated by go, but not released |
sys.goroutines |
Current number of goroutines |
sys.rss |
Current process RSS |
sys.uptime |
Process uptime in seconds |
sysbytes |
Number of bytes in system KV pairs |
syscount |
Count of system KV pairs |
timeseries.write.bytes |
Total size in bytes of metric samples written to disk |
timeseries.write.errors |
Total errors encountered while attempting to write metrics to disk |
timeseries.write.samples |
Total number of metric samples written to disk |
totalbytes |
Total number of bytes taken up by keys and values including non-live data |
tscache.skl.read.pages |
Number of pages in the read timestamp cache |
tscache.skl.read.rotations |
Number of page rotations in the read timestamp cache |
tscache.skl.write.pages |
Number of pages in the write timestamp cache |
tscache.skl.write.rotations |
Number of page rotations in the write timestamp cache |
txn.abandons |
Number of abandoned KV transactions |
txn.aborts |
Number of aborted KV transactions |
txn.autoretries |
Number of automatic retries to avoid serializable restarts |
txn.commits1PC |
Number of committed one-phase KV transactions |
txn.commits |
Number of committed KV transactions (including 1PC) |
txn.durations |
KV transaction durations in nanoseconds |
txn.restarts.deleterange |
Number of restarts due to a forwarded commit timestamp and a DeleteRange command |
txn.restarts.possiblereplay |
Number of restarts due to possible replays of command batches at the storage layer |
txn.restarts.serializable |
Number of restarts due to a forwarded commit timestamp and isolation=SERIALIZABLE |
txn.restarts.writetooold |
Number of restarts due to a concurrent writer committing first |
txn.restarts |
Number of restarted KV transactions |
valbytes |
Number of bytes taken up by values |
valcount |
Count of all values |
