

CockroachDB runs background work — backups, schema changes, statistics collection, changefeeds — in the same processes that serve user queries. Traditionally, this creates a tension: either background work runs conservatively, leaving CPU idle, or it runs aggressively and risks hurting foreground latency.
In CockroachDB v26.1, we broke through that tradeoff by combining elastic admission control with a small but powerful change to the Go runtime scheduler.
This post explains how our "elastic" admission control mechanism lets background work use spare CPU capacity without impacting query service latency, and how we extended this mechanism with a patch to the Go scheduler in CockroachDB v26.1. Before we dive in: We call this class of work "elastic" because, unlike a query with a user waiting for its result, we can do more of it now or do a little less now and stretch the task out over a longer period, depending on the current demand for our limited CPU resources.
The Sandwich Counter
Imagine you run a lunchtime sandwich counter. Your kitchen can prepare 100 sandwiches over a shift; during a typical shift you serve 60 customers. Since 60 is well below 100, there's slack — roughly 40% of the time, some cooks aren't making sandwiches. That downtime is perfect for prep work: restocking, cleaning, chopping vegetables for tomorrow.
Management has a simple rule: if customers aren't waiting too long, cooks can be assigned prep tasks. But if any customer waits for more than 5 minutes, no more prep tasks are assigned for the rest of the hour.
This works reasonably well most of the time: low-urgency tasks get done and customers don't have to wait for them. But it can fail in two different ways (sometimes even at the same time).
Overshoot can occur during a slow period: since there are no long lines observed, more and more cooks can be assigned low-urgency tasks, leaving nobody actually on the line. When a customer walks in, they'll have to wait a couple extra minutes for one of the cooks to finish their task and come back to start preparing their order.
Undershoot can occur after a surge in customers (or after an overshoot). Even though we can serve 100 customers in an hour, if 25 all arrive at once on the stroke of noon, the last of them waits 15 minutes for their order. That triggers the rule — no more prep for the hour. After the rush passes, cooks stand idle due to the rule while prep work piles up.
The rule is simple, but it has problems. We need something smarter.
The Feedback Controller
In CockroachDB, we have time-sensitive user-facing queries to serve — the customers at the sandwich counter — along with background tasks like building indexes or recomputing optimizer statistics, which are less urgent but still need to be completed quickly. We have a limited number of CPU cores — cooks — with which to ensure both happen.
The first piece of the solution is a feedback controller that adjusts how aggressively we admit background work based on observed scheduler latency — the computational version of our prep-assignment rule. This is what we implemented and wrote about a few years ago.
Elastic work requests CPU time through a token bucket. The bucket fills at a rate determined by a dynamic utilization limit. Every 100ms, CockroachDB samples Go runtime metrics and compute p99 scheduler latency over a 2.5-second window. "Scheduler latency" is how long goroutines in the process wait between the time when they become runnable and when they actually start running. The target is 1ms — experimentally, that's where we start seeing meaningful impact on foreground latency, particularly since serving a foreground query often involves several handoffs between goroutines, so small delays at each can compound quickly.
IF p99_scheduler_latency > target (1ms):
    utilization_limit = max(current - 2*delta, min_utilization)
ELSE:
    IF requests_waiting:
        utilization_limit = min(current + 1*delta, max_utilization)
    ELSE:
        slowly decay toward inactive baseline
The asymmetry is intentional: we decrease the limit 2x faster than we increase it. Overshooting during a load spike causes latency pain; undershooting during light load just means slightly slower background work — which we already established is not time-sensitive. Small adjustment deltas (0.1%/second) and a long averaging window (2.5s) reduce oscillation.
This mostly handles the undershoot problem — after a burst passes, we gradually ramp elastic work back up rather than staying conservative. But it doesn't fully solve overshoot: once we've admitted background work, it runs for its allotted time slice (100ms by default). If all CPUs are busy with backfill work when a query arrives, that query waits, and the observed delay rises. This causes us to be more conservative with limiting. The net result is we struggle to push higher resource utilization without seeing elevated delays that drag it back down. In clusters with minimal background work, this may be OK: if we limit to 10% of CPU and that's all we need to complete that cluster's background work on time, that's fine. But when a cluster wants to perform more background work — build a new index, run backups, emit changefeeds, recompute optimizer stats — then being unable to use available resources to get it done becomes a problem.
Cooperative Yielding
There's a natural instinct: Go has a runtime scheduler. Why can't we just tell it "these goroutines are low priority, these are high priority — run high priority first"?
Priority alone doesn't solve the problem, because of what happens when high-priority work arrives while low-priority work is already running. You can't just yank a cook away mid-task — they might have a stack of boxes blocking the walk-in's door and leaving them there would be in everyone's way, including other cooks rushing to complete urgent orders. The computational analog is that preempting a low-priority goroutine while it is holding a lock causes priority inversion when the high-priority work needs that lock.
But background tasks do have natural safe stopping points — between batches, after releasing locks, between loop iterations. When our cook finishes moving one stack of boxes, they can check if they're needed back on the line before moving to the next stack. This is cooperative yielding: background work explicitly checks whether it should step aside, but chooses when to check. If higher-priority work is waiting and all CPUs are busy, it parks itself. If nothing is waiting, it continues immediately.
Off-the-shelf, Go doesn't quite have all the pieces to offer such a mechanism though — goroutines run until their time slice expires or they block on I/O with limited mechanisms to influence scheduling.
Why Only the Runtime Can Do This
To utilize available resources effectively, you need to yield just enough: step aside when someone actually needs the CPU, resume immediately when capacity exists. Step aside too soon and you waste resources, but if you wait too long to step aside, you delay work that was waiting. And after you step aside, if you wait too long to resume, you again leave capacity unused, wasting resources. "Is work waiting to run right now?" is the signal you need to make an accurate, impactful yield decision rather than "how much work waited recently?" Metrics about past scheduling latency are stale; by the time you see them, goroutines have already waited or not, but that doesn't tell you if you can run now.
When we looked at how our code, in "userspace" (i.e. non-runtime Go code), could try to answer the question "Is work waiting to run right now?" we came up short. There are thousands of goroutines — handling queries, running backups, computing stats — but most spend the majority of their time blocked on RPCs or syscalls or timers. They're not actively waiting to run...until they are: an RPC response arrives or a timer fires and suddenly several goroutines are runnable and waiting to run. To track this in userspace, we'd need to instrument every spot, across the codebase, where anything could change from blocked to ready to run, or restructure everything into async request/worker-pool patterns.
But one of the biggest reasons we use and love Go is that we don't have to write code like this. We write simple, procedural, blocking code that runs in lightweight goroutines, letting the scheduler handle mapping those Gs onto Ms and Ps. The runtime already knows what it wants to run — it owns the run queue. Duplicating that information in userspace would be tedious, imperfect, and would defeat a major reason we chose Go in the first place.
The runtime exposes some of this in its metrics, but reading them requires a mutex and allocations — fine for observability, too expensive for a control signal in a hot loop. We need the answer cheaply, cheap enough to check every loop iteration.
As we looked around, we concluded that the current public APIs didn't quite fit our needs. But digging into the runtime internals, we spotted something in its background garbage collection workers: a cooperative, load-observing yield mechanism! GC mark workers periodically call goschedIfBusy() to yield capacity back when — and only when — all the scheduler processors are busy, meaning that capacity may be needed elsewhere. Looking at the body of this helper, we saw that it reads the scheduler's npidle atomic — the count of idle processors (slots that can run goroutines, roughly mapping to CPU cores).
Inspired by goschedIfBusy, our solution came into focus: a new public API in the runtime for background tasks to call frequently — in the body of hot loops. This API would use sched.npidle as an extremely cheap signal (one atomic read) that yielding may or may not be needed, and when it is, park the goroutine in a separate scheduler queue until the scheduler has capacity to resume it.
Inside runtime.Yield()
Conceptually runtime.Yield is very simple: check if there are runnable goroutines waiting in the scheduler and if so, park the caller in a new separate queue from which the scheduler retrieves it when — and only when — nothing else is waiting to run. That's all callers need to know: if workIsWaiting() { parkInYieldQueue() }. The rest of this section walks through exactly how we determine if "work is waiting" inside the Go scheduler with minimal overhead, but is only here for those curious about the nitty-gritty — feel free to skip to the end if you just want the results.
Minimizing overhead is critical: Yield must be callable at extremely high frequency in CPU-hungry loops, which means the cost has to be tiny. If it's expensive, callers will call it less often — only every N iterations, outside their inner loop, etc. — and the work we want to yield to waits longer to be noticed.
The first thing Yield checks is sched.npidle.Load() == 0: just like in goschedIfBusy(), this tells us if there are idle processors — if there are, there's no need to yield since we can assume they'll run anything waiting. We put this one-liner in its own function, with the rest of the code in a separate internal function called only when npidle is zero, ensuring the outer function and its fast-path exit remain small enough to inline. Thus the overhead in the common case — scheduler not saturated — is just a single inlined atomic read and comparison. This is cheap enough (a couple instructions, a handful of nanoseconds) that we can ask callers to pay it even in unsaturated cases where they previously might not have checked at all.
However, if npidle is zero, we no longer get to assume an idle processor will run any waiting work, so we need to check for it. There are multiple places to check because the scheduler has multiple work queues: each processor has a local runnable goroutine queue, plus there's a global queue. We start by checking the calling processor's local queue and the global queue — O(1) and relatively cheap. If we find anything, we yield: park this goroutine in the yielded queue, freeing up the processor to find and run the waiting work.
But there are also local run queues for all the other processors — perhaps many of them on a big multi-socket server with 32, 64, or more cores. Searching all of these on every call to Yield starts to look expensive, and much less cache-friendly since they're not local to the caller's processor. And there's one more place work could be waiting, even more expensive to check (a syscall), and it's not a queue at all: netpoll.
netpoll is how the scheduler discovers that some previously-fired I/O or network request has a result ready, so it can move the issuing goroutine from waiting back to runnable. Normally the scheduler checks netpoll periodically (every 10ms) and also — more importantly for us — whenever findRunnable (the function the scheduler runs to figure out what a processor should run next) doesn't find any runnable goroutines. From the scheduler's point of view, this makes sense: when there's work ready to run, run it; only when there's nothing waiting should it spend a syscall looking for more. But for background work that doesn't want to delay other work's end-to-end latency, the equation changes. If a user's query was waiting on an RPC that just completed, we want netpoll to notice promptly so their goroutine gets scheduled right away. This delay wouldn't appear in goroutine scheduling latency — our focus metric — but would hurt user-observed query latency. So while we want background work to occupy all processors, we still need netpoll checks to happen; without idle processors triggering them via findRunnable, our yielding code needs to do it.
So the full set of checks for waiting work we want to perform under saturation now include not just every processor's run queues, but also a netpoll syscall. A syscall is expensive, so how do we square this with our requirement that yield checks have minimal overhead? As usual, when we have something expensive inside something we claim is cheap, we wave the magic wand of "amortization" over it: we perform the expensive check only on a subset of calls so the average cost per call, and thus the aggregate overhead, stays low.
Choosing which subset of calls though is its own challenge: a fixed fraction / probabilistic approach would check too often if called more frequently, or too rarely if called less frequently. Since what we care about is bounding wait time, we use time: if more than 0.25ms has passed since the last expensive check, check again. Whether a caller invokes Yield 1000 times per second or 1000 times per millisecond, we still only check, at most, four times per millisecond. One complication: even reading the clock (runtime.nanotime) is too expensive for every call in a truly tight loop, so we put it behind a counter with exponential backoff. If we've checked the clock many times without 0.25ms elapsing, we wait longer — more calls — before checking again.
Together, these optimizations keep Yield overhead quite low even at extremely high calling frequencies — measured at <1% in CockroachDB when yield-instrumented work is saturating CPU.
Finally, one last bonus optimization: remember how Yield started by checking the closest place work could be waiting in the calling processor's local queue? If it finds a goroutine waiting there, it could just park the yielding goroutine in the global yield queue, the same as we would if it found work waiting elsewhere as that would fulfill the caller's goal of getting out of the way of the waiting goroutine. But in this case, there's another way it can fulfill that goal as well: by simply moving to the back of that local queue, i.e. switching places with that waiting goroutine. This is potentially more appealing than parking in the global yield queue and eventually being resumed by any other processor (i.e. on a different core) since if the goroutine to which we yielded just runs briefly and the yielding goroutine then returns to the head of the queue on the same processor it could enjoy much better for cache locality than it it had resumed elsewhere. There is a caveat here though: we need to ensure two goroutines that both want to yield don't thrash back and forth yielding to each other. This isn't a problem when parking in the global yield queue, since that queue isn't where Yield checks for waiting work when deciding whether to yield. But the local runnable queue is. We solve this by putting a sentinel in the backoff counter to remember that a goroutine tried to yield locally, then skipping this optimization when we see it — breaking the cycle after the first thrash.
That covers the implementation. You can read the code on CockroachDB's Go fork — it's actually much shorter (just 54 lines of code, not counting its comments) than this explanation. Now let's look at what this buys us in practice.
Results
When yielding works — when it's called often enough in work that supports it — we see minimal scheduling delays even when we fully utilize all available CPU.
This turned out even better than we expected: during an IMPORT that drives 95% average CPU utilization, we would previously see p99 scheduling delays of 30-50ms, which could cause significant user-visible query latency. In one test running a YCSB workload alongside an IMPORT, the workload latency would spike by over 1000x, from below 2ms to multiple seconds. Now, while still maintaining the same 95%+ CPU utilization, we see scheduling delays remain below 200µs with that YCSB workload's observed latency peaking at just 4ms.
Since observed scheduling delays are what drive the admission feedback controller, when yielding is working to minimize scheduling delays, that admission controller opens up: it admits more work because now it can trust that work to yield back if needed.
Yielding did not replace our elastic admission controller, but rather complemented it. The controller remains in the loop for jobs that are configured to use it, even as they also use Yield, so if the pattern of their work changes — some input or configuration means it now has a larger critical section that can't include yield, or foreground work spikes — the controller still cuts back admission if delays rise. They work in concert.
The fact that yielding has allowed our existing delay feedback controller to drive much higher CPU utilization has also now allowed us to apply that controller to more types of background jobs. Previously, we used it primarily in backups and changefeeds, which aren't as CPU-hungry as some other jobs. We'd held off on fully integrating it into IMPORTs and schema changes because it would underutilize CPU — sometimes by 40% or more in these CPU-bound jobs, adding real minutes or hours to finish an IMPORT or add a new index — a DBA who identifies a new index as the fix for a slow query in production wants that index added now insofar as their resources allow. With yielding integrated into these jobs, we no longer need to choose between limiting their latency impact and efficient hardware utilization.
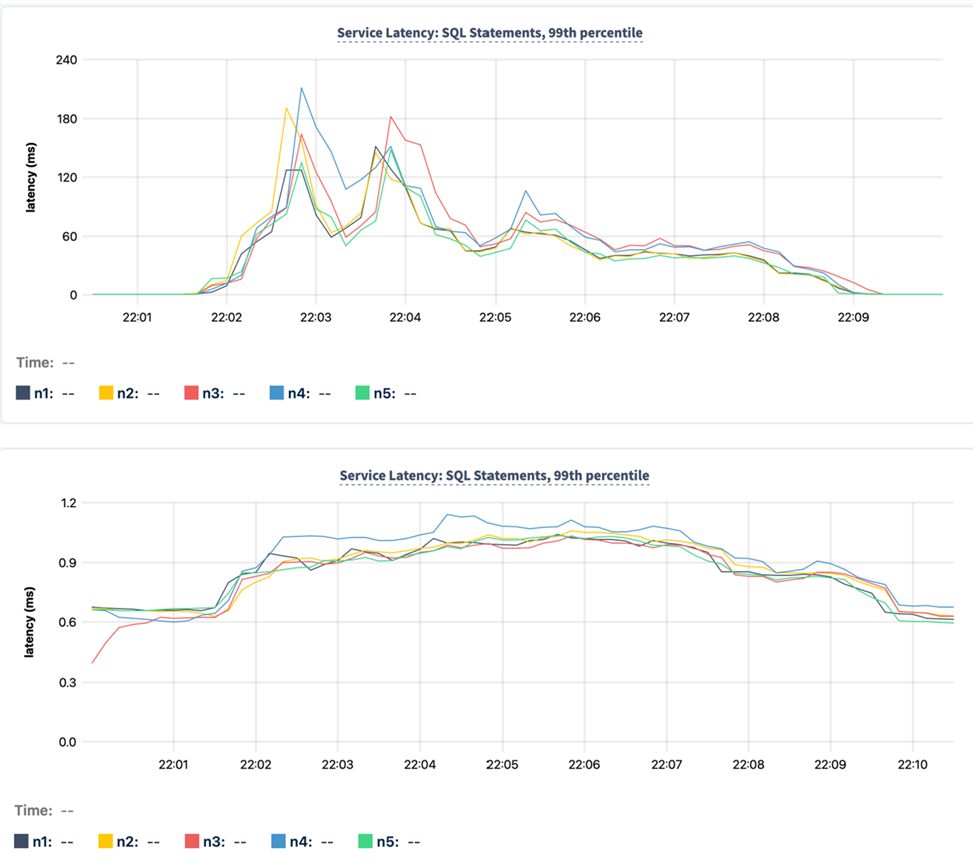
p99 latency observed by foreground SQL query traffic when a CPU saturating bulk data load via IMPORT was run concurrently, before (top) and after (bottom) enabling yielding.
One thing that surprised us: IMPORT throughput — which, again, previously was not subject to elastic limiting — on an otherwise idle cluster actually increased 5-10% when yields were added to it. This was not expected: while we worked hard to minimize the overhead of Yield, we hoped that meant it would, best case, cause such a negligible slow-down as to have no effect.
The unexpected speedup appeared to be down to two mechanisms: First, yielding in IMPORT's producer components ensures downstream systems that manage writing data and replicating it are never starved to the point of triggering their overload protections, which hit throughput harder than skipping a few clock cycles in the producer. Second, when jobs spin up many goroutines to maximize throughput, they occasionally all become runnable at once and fight it out in the scheduler, which attempts some level of fairness via preemptions. With Yield added, the majority of such a spike quickly moves itself to the yield queue, letting the remainder run to completion uninterrupted with friendlier cache behavior, since we explicitly do not impose any attempt at fairness on yielded goroutines. We haven't measured the exact contribution of each effect since we were just pleasantly surprised by the gain. And of course, if foreground work is consuming CPU, these IMPORTs now run slightly slower — exactly as intended.
Conclusion
We ran months of production-scale tests on our patched runtime to validate the approach, and it's on by default in CockroachDB 26.1. Observed overhead is under 1% during bulk operations that saturate CPU, with major improvements to foreground latency while running background bulk jobs.
This approach works best when background work has natural stopping points — loop iterations, batch boundaries, points where locks aren't held. Work with long critical sections or infrequent yield points will still cause delays; the feedback controller backstops this by throttling admission, but that's a blunter tool that on its own can reduce hardware utilization. Instrumenting more of our codebase with yield points is ongoing work.
Cooperative yielding is a powerful tool to run background work aggressively without impacting foreground latency, but it requires that work be able to know, right now, whether anyone is waiting. In Go, the runtime owns this information. Trying to reconstruct it in userspace defeats the simplicity that makes Go productive.
We've implemented this as a patch to our forked Go runtime and seen positive results. But the pattern isn't specific to CockroachDB or even databases — any system doing background processing while serving interactive traffic faces the same tension: to fully utilize hardware, you need enough background work in flight to fill spare capacity, but all that work then needs a way to get out of the way when needed. Back at the sandwich counter, that's just a cook glancing at the ticket board between tasks. In Go, it requires a window into the runtime's scheduler. We've filed a proposal upstream to discuss whether this or something like it makes sense in the standard runtime.
Try CockroachDB Today
Spin up your first CockroachDB Cloud cluster in minutes. Start with $400 in free credits. Or get a free 30-day trial of CockroachDB Enterprise on self-hosted environments.
David Taylor is Principal Software Engineer at Cockroach Labs.