
This page provides solutions for common performance issues in your clusters. See the recipes to identify performance problems in your workload.
Indicators that your workoad is experiencing contention
- Your application is experiencing degraded performance with serialization errors like
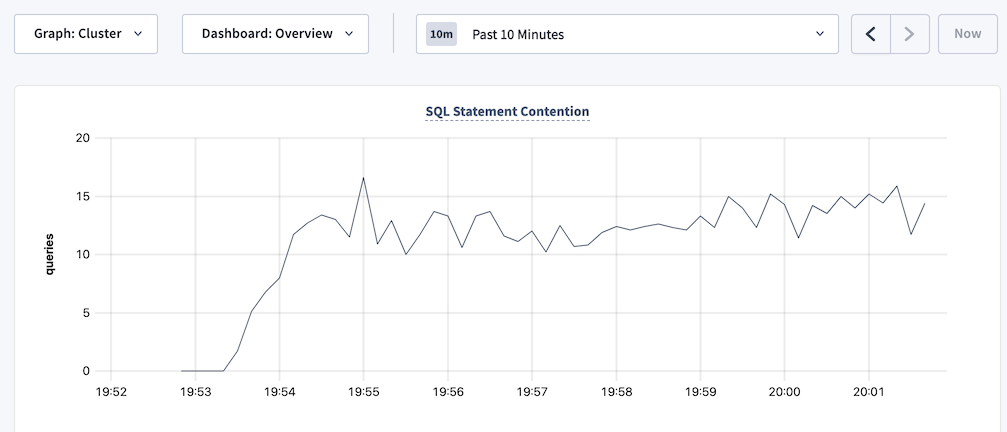
SQLSTATE: 40001,RETRY_WRITE_TOO_OLD, andRETRY_SERIALIZABLE. - The SQL Statement Contention graph graph is showing spikes over time.
- The KV Transaction Restarts graph graph is showing spikes in retries over time.
Fixing contention problems
Find the transactions and statements within the transactions that are experiencing contention. CockroachDB has several ways of tracking down transactions that are experiencing contention:
- The Transactions page and the Statements page in the DB Console allow you to sort by contention.
Create views for the information in the
crdb_internal.cluster_contention_eventstable to find the tables and indexes that are experiencing contention.CREATE VIEW contended_tables (database_name, schema_name, name, num_contention_events) AS SELECT DISTINCT database_name, schema_name, name, num_contention_events FROM crdb_internal.cluster_contention_events JOIN crdb_internal.tables ON crdb_internal.cluster_contention_events.table_id = crdb_internal.tables.table_id ORDER BY num_contention_events desc; CREATE VIEW contended_indexes (database_name, schema_name, name, index_name, num_contention_events) AS SELECT DISTINCT database_name, schema_name, name, index_name, num_contention_events FROM crdb_internal.cluster_contention_events, crdb_internal.tables, crdb_internal.table_indexes WHERE (crdb_internal.cluster_contention_events.index_id = crdb_internal.table_indexes.index_id AND crdb_internal.cluster_contention_events.table_id = crdb_internal.table_indexes.descriptor_id) AND (crdb_internal.cluster_contention_events.table_id = crdb_internal.tables.table_id) ORDER BY num_contention_events DESC;Then run a select statement from the
contended_tablesorcontended_indexesview.SELECT * FROM contended_tables; SELECT * FROM contended_indexes;
After identifying the tables and indexes experiencing contention, follow the steps outlined in our best practices recommendations to avoid contention.
Indicators that your workload has statements with full table scans
The following query returns statements with full table scans in their statement plan:
SHOW FULL TABLE SCANS;The following query against the
crdb_internal.node_statement_statisticstable returns results:SELECT count(*) as total_full_scans FROM crdb_internal.node_statement_statistics WHERE FullTableScan = 'True';Viewing the statement plan on the Statement details page of the DB Console indicates that the plan contains full table scans.
The statement plans returned by the
EXPLAINandEXPLAIN ANALYZEcommands indicate that there are full table scans.
Fixing full table scans in statements
Full table scans often result in poor statement performance. Not every full table scan is an indicator of poor performance, however. The cost-based optimizer may decide on a full table scan when other index or join scans would result in longer execution time.
Examine the statements that result in full table scans and consider adding secondary indexes.
Indicators that your tables are using suboptimal primary keys
- The Hardware metrics dashboard in the DB Console shows high resource usage per node.
- The Problem Ranges report on the Advanced Debug page of the DB Console indicates a high number of queries per second on a subset of ranges or nodes.
Fixing suboptimal primary keys
Evaluate the schema of your table to see if you can redistribute data more evenly across multiple ranges. Specifically, make sure you have followed best practices when selecting your primary key.
If your workload with a small dataset (for example, a dataset that contains few index key values) is experiencing resource contention, consider splitting your tables and indexes to distribute ranges across multiple nodes to reduce resource contention.
