
CockroachDB delivers predictable throughput and latency at all scales on commodity hardware. This page provides an overview of the performance profiles you can expect, based on Cockroach Labs's extensive testing using the TPC-C industry-standard benchmark.
For instructions to reproduce the TPC-C results listed here, see Performance Benchmarking with TPC-C. If you fail to achieve similar results, there is likely a problem in either the hardware, workload, or test design.
This document is about CockroachDB’s performance on benchmarks. For guidance on tuning real workloads, see SQL Best Practices, and for guidance on data location techniques to minimize network latency, see Topology Patterns.
Scale
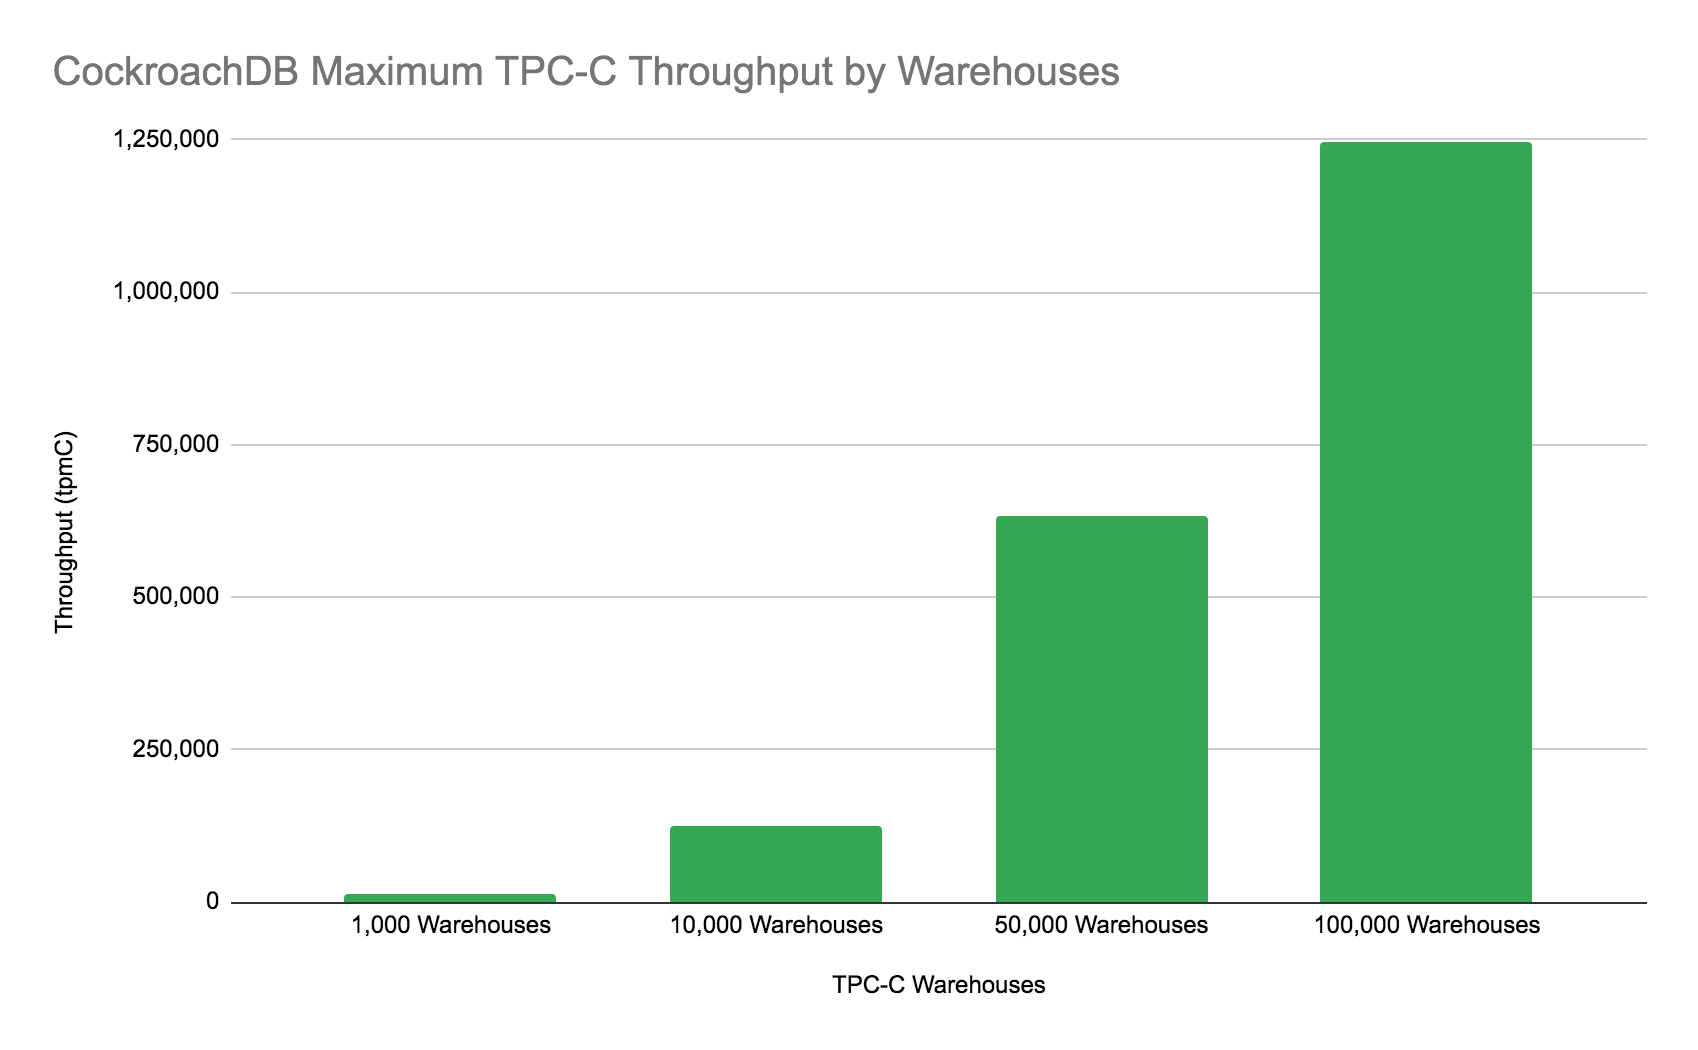
TPC-C provides the most realistic and objective measure for OLTP performance at various scale factors, and CockroachDB can process 1.2M tpmC with 100,000 warehouses, a nearly perfect score. For a refresher on what exactly TPC-C is and how it is measured, see Benchmark details below.
| Metric | CockroachDB Results |
|---|---|
| Max Throughput | 1,245,462 tpmC |
| Max Warehouses with Max Efficiency | 100,000 Warehouses |
| Max Number of Rows | 49.8B |
| Max Unreplicated Data | 8TB |
| Number of Nodes | 81 |
| Node Machine Type | c5d.9xlarge |
CockroachDB achieves this performance in SERIALIZABLE isolation, the strongest isolation level in the SQL standard.
Linear scaling
CockroachDB has no theoretical scaling limit and, in practice, can achieve near-linear performance at 256 nodes. Because the TPC-C results above reflect leaps in scale, to test linear scaling, Cockroach Labs ran a simple benchmark named KV 95 (95% point reads, 5% point writes, all uniformly distributed) on AWS c5d.4xlarge machines:
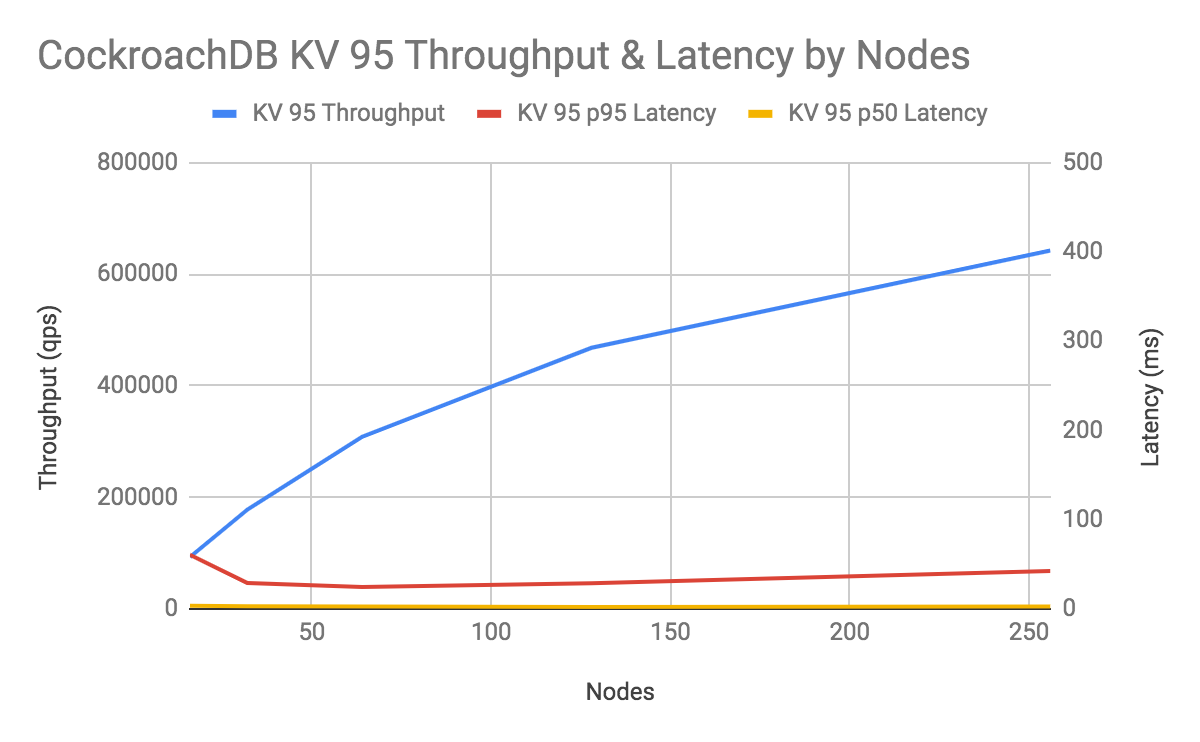
This chart shows that adding nodes increases throughput linearly while holding p50 and p99 latency constant. The concurrency for each scale was chosen to optimize throughput while maintaining an acceptable latency and can be observed in the table below.
| Number of Nodes | Workers | Concurrency |
|---|---|---|
| 16 | 2 | 512 |
| 32 | 4 | 512 |
| 64 | 4 | 1024 |
| 128 | 8 | 1024 |
| 256 | 8 | 2048 |
Throughput
Cockroach Labs believes TPC-C provides the most realistic and objective measure for OLTP throughput. In the real world, applications generate transactional workloads that consist of a combination of reads and writes, possibly with concurrency and likely without all data being loaded into memory. Approach benchmark results quoted in QPS with caution, because anything as simple as a “query” is unlikely to be representative of the workload you need to run in practice.
Latency
CockroachDB returns single-row reads in 1 ms and processes single-row writes in 2 ms within a single availability zone. As you expand out to multiple availability zones or multiple regions, latency can increase due to distance and the limitation of the speed of light.
For benchmarking latency, again, Cockroach Labs believes TPC-C provides the most realistic and objective measure, since it encompasses the latency distribution, including tail performance.
CockroachDB provides a number of important tuning practices for both single-region and multi-region deployments, including secondary indexes and various data topologies to achieve low latency.
Benchmark details
TPC-C
Cockroach Labs measures performance through many diverse tests, including the industry-standard OLTP benchmark TPC-C, which simulates an e-commerce or retail company. Created in 1992, TPC-C has withstood the test of time and remains the most mature industry benchmark for OLTP workloads, and the only objective comparison for evaluating OLTP performance. In its own words, TPC-C:
“…involves a mix of five concurrent transactions of different types and complexity either executed on-line or queued for deferred execution. The database is comprised of nine types of tables with a wide range of record and population sizes. While the benchmark portrays the activity of a wholesale supplier, TPC-C is not limited to the activity of any particular business segment, but, rather represents any industry that must manage, sell, or distribute a product or service.”
As a result, TPC-C includes create, read, update, and delete (e.g., CRUD) queries, basic joins, and other SQL statements used to administer mission-critical transactional workloads. It includes detailed specifications for concurrency and workload contention.
How TPC-C works
TPC-C measures the throughput and latency for processing sales through a customer warehouse using a “business throughput” metric called tpmC that measures the number of order transactions performed per minute throughout the system. This metric is considerably more realistic than TPS (transactions per second) or QPS (queries per second) alone because it summarizes multiple transactions per order and accounts for failed transactions. TPC-C also has several latency requirements that apply to median, p90, and max latencies.
TPC-C specifies restrictions on the maximum throughput achievable per warehouse. This is done to ensure that as a system becomes progressively more capable of throughput, it must also deal with progressively more data. This is how things work in the real world, and it makes little sense to say that your database can process a bazillion transactions per second if it’s processing the same data over and over again.
Because TPC-C is constrained to a maximum amount of throughput per warehouse, we often discuss TPC-C performance as the maximum number of warehouses for which a database can maintain the maximum throughput per minute. For a full description of the benchmark, please consult the official documentation.
Performance limitations
CockroachDB has no theoretical limitations to scaling, throughput, latency, or concurrency other than the speed of light. Practically, we will be improving bottlenecks and addressing challenges over the next several releases.
See also
Hardware
CockroachDB works well on commodity hardware in public cloud, private cloud, on-prem, and hybrid environments. For hardware recommendations, see our Production Checklist.
Also note that CockroachDB creates a yearly cloud report focused on evaluating hardware performance. For more information, see the 2020 Cloud Report.
Performance Tuning
For guidance on tuning a real workload's performance, see SQL Best Practices, and for guidance on data location techniques to minimize network latency, see Topology Patterns.
