
The Overview dashboard lets you monitor important SQL performance, replication, and storage metrics. To view this dashboard, access the Admin UI and click Metrics on the left-hand navigation bar. The Overview dashboard is displayed by default.
The Overview dashboard displays the following time series graphs:
SQL Queries
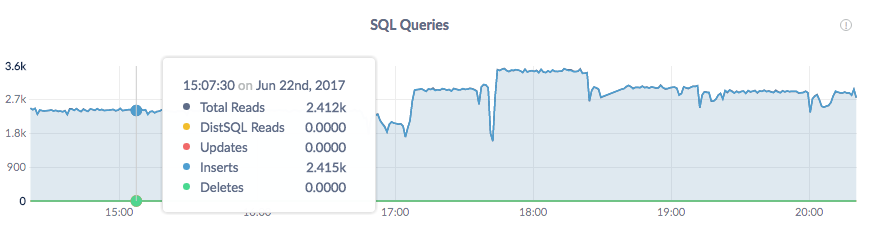
In the node view, the SQL Queries graph shows the current moving average, over the last 10 seconds, of the number of
SELECT/INSERT/UPDATE/DELETEqueries per second issued by SQL clients on the node.In the cluster view, the graph shows the sum of the per-node averages, that is, an aggregate estimation of the current query load over the cluster, assuming the last 10 seconds of activity per node are representative of this load.
Service Latency: SQL, 99th percentile
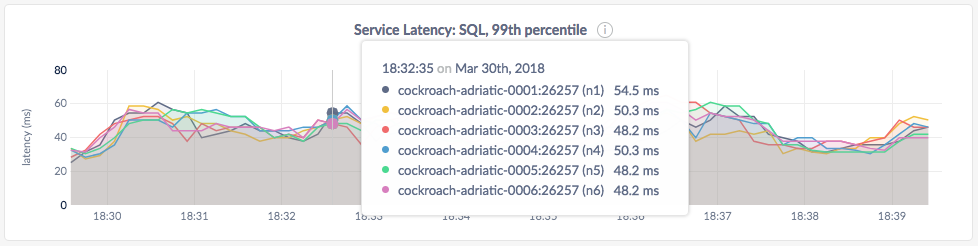
Service latency is calculated as the time between when the cluster receives a query and finishes executing the query. This time does not include returning results to the client.
In the node view, the graph shows the 99th percentile of service latency for the node.
In the cluster view, the graph shows the 99th percentile of service latency across all nodes in the cluster.
Replicas per Node
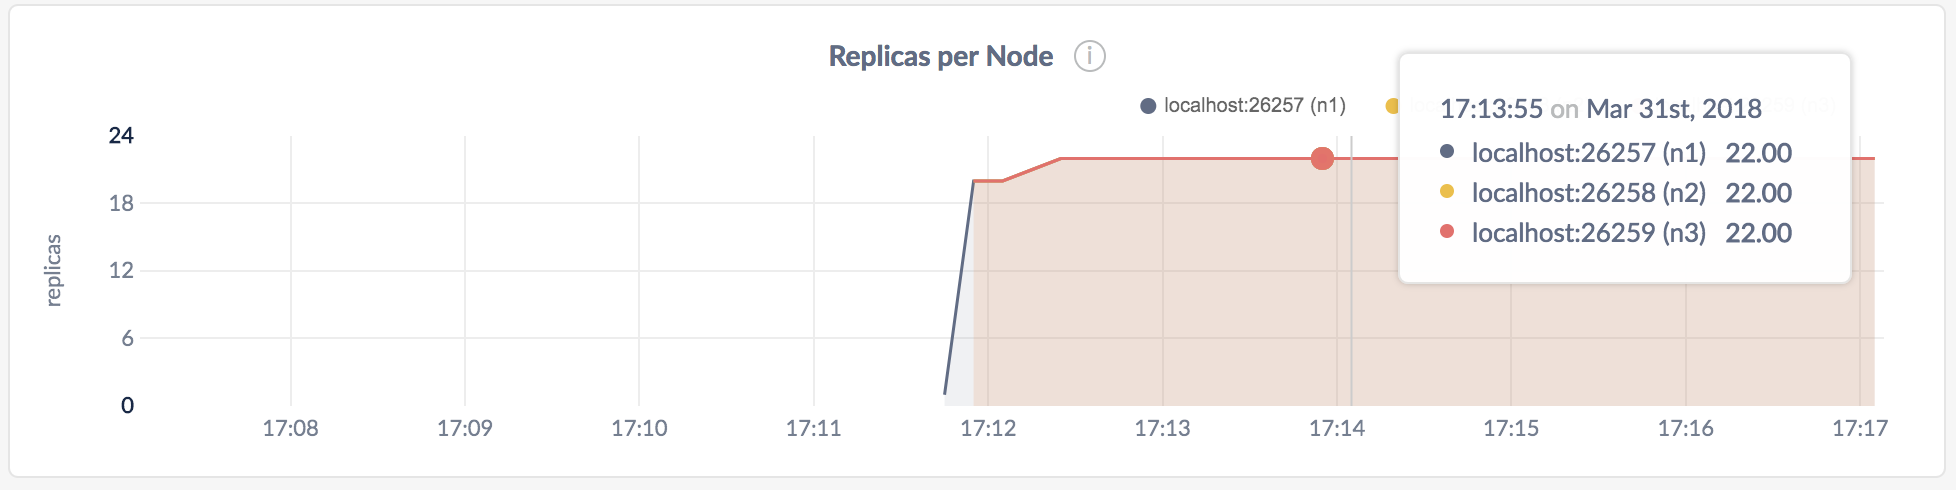
Ranges are subsets of your data, which are replicated to ensure survivability. Ranges are replicated to a configurable number of CockroachDB nodes.
In the node view, the graph shows the number of range replicas on the selected node.
In the cluster view, the graph shows the number of range replicas on each node in the cluster.
For details about how to control the number and location of replicas, see Configure Replication Zones.
Capacity
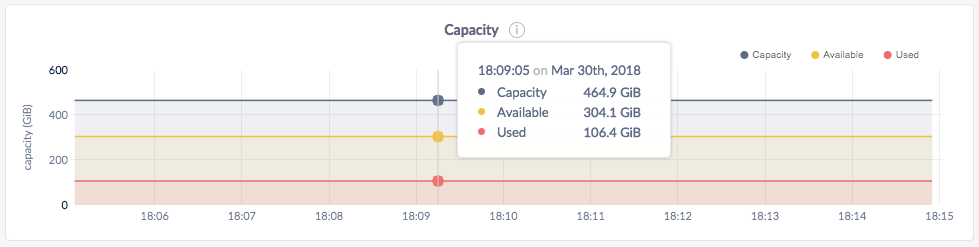
You can monitor the Capacity graph to determine when additional storage is needed.
In the node view, the graph shows the maximum allocated capacity, available storage capacity, and capacity used by CockroachDB for the selected node.
In the cluster view, the graph shows the maximum allocated capacity, available storage capacity, and capacity used by CockroachDB across all nodes in the cluster.
On hovering over the graph, the values for the following metrics are displayed:
| Metric | Description |
|---|---|
| Capacity | The maximum storage capacity allocated to CockroachDB. You can configure the maximum allocated storage capacity for CockroachDB using the --store flag. For more information, see Start a Node. |
| Available | The free storage capacity available to CockroachDB. |
| Used | Disk space used by the data in the CockroachDB store. Note that this value is less than (Capacity - Available) because Capacity and Available metrics consider the entire disk and all applications on the disk including CockroachDB, whereas Used metric tracks only the store's disk usage. |
If you are running multiple nodes on a single machine (not recommended in production) and didn't specify the maximum allocated storage capacity for each node using the --store flag, the capacity metrics in the Admin UI are incorrect. This is because when multiple nodes are running on a single machine, the machine's hard disk is treated as an available store for each node, while in reality, only one hard disk is available for all nodes. The total available capacity is then calculated as the hard disk size multiplied by the number of nodes on the machine.
