
On a secure cluster, this area of the Admin UI can only be accessed by an admin user. See Admin UI access.
The Statements page helps you identify frequently executed or high latency SQL statements. The Statements page also allows you to view the details of an individual SQL statement by clicking on the statement to view the Statement Details page.
To view the Statements page, access the Admin UI and then click Statements on the left.
Limitation
The Statements page displays the details of the SQL statements executed within a specified time interval. At the end of the interval, the display is wiped clean, and you'll not see any statements on the page until the next set of statements is executed. By default, the time interval is set to one hour; however, you can customize the interval using the diagnostics.reporting.interval cluster setting.
Filtering by application
If you have multiple applications running on the cluster, the Statements page shows the statements from all of the applications by default. To view the statements pertaining to a particular application, select the application name from the App dropdown menu. If you haven't set the application name in the connection string, it appears as unset in the dropdown menu.
Understanding the Statements page
SQL statement fingerprint
The Statements page displays the details of SQL statement fingerprints instead of individual SQL statements.
A statement fingerprint is a grouping of similar SQL statements in their abstracted form by replacing the literal values with underscores (_). Grouping similar SQL statements as fingerprints helps you quickly identify frequently executed SQL statements and their latencies.
A statement fingerprint is generated when two or more statements are the same after any literal values in them (e.g.,numbers and strings) are replaced with underscores. For example, the following statements have the same once their numbers have been replaced with underscores:
INSERT INTO new_order(product_id, customer_id, transaction_id) VALUES (380, 11, 11098)INSERT INTO new_order(product_id, customer_id, transaction_id) VALUES (192, 891, 20)INSERT INTO new_order(product_id, customer_id, transaction_id) VALUES (784, 452, 78)
Thus, they can have the same fingerprint:
INSERT INTO new_order(product_id, customer_id, no_w_id) VALUES (_, _, _)
The following statements are different enough to not have the same fingerprint:
INSERT INTO orders(product_id, customer_id, transaction_id) VALUES (380, 11, 11098)INSERT INTO new_order(product_id, customer_id, transaction_id) VALUES (380, 11, 11098)INSERT INTO new_order(product_id, customer_id, transaction_id) VALUES ($1, 11, 11098)INSERT INTO new_order(product_id, customer_id, transaction_id) VALUES ($1, $2, 11098)INSERT INTO new_order(product_id, customer_id, transaction_id) VALUES ($1, $2, $3)
Parameters
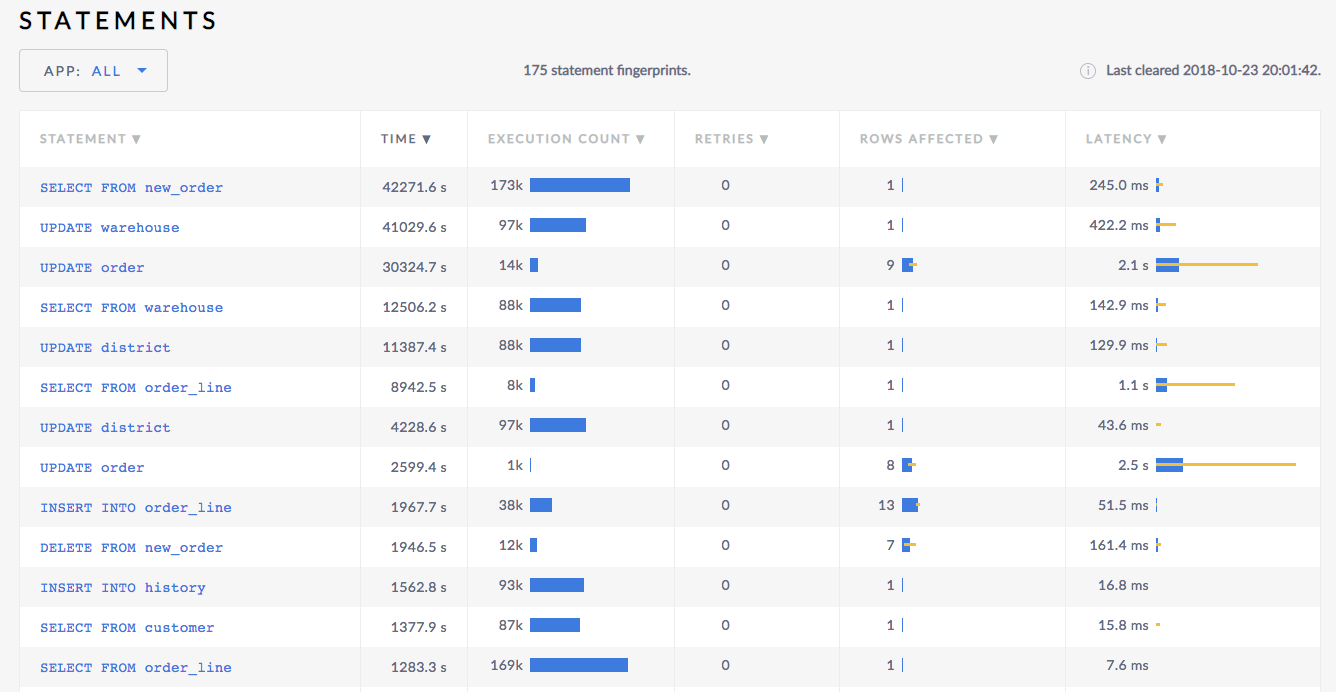
The Statements page displays the time, execution count, number of retries, number of rows affected, and latency for each statement fingerprint. By default, the statement fingerprints are sorted by time; however, you can sort the table by execution count, retries, rows affected, and latency.
The following details are provided for each statement fingerprint:
| Parameter | Description |
|---|---|
| Statement | The SQL statement or the fingerprint of similar SQL statements. To view additional details of a statement fingerprint, click on the statement fingerprint in the Statement column to see the Statement Details page. |
| Time | The cumulative time taken to execute the SQL statement (or multiple statements having the same fingerprint) within the last hour or the specified time interval. |
| Execution Count | The total number of times the SQL statement (or multiple statements having the same fingerprint) is executed within the last hour or the specified time interval. The execution count is displayed in numerical value as well as in the form of a horizontal bar. The bar is color-coded to indicate the ratio of runtime success (indicated by blue) to runtime failure (indicated by red) of the execution count for the fingerprint. The bar also helps you compare the execution count across all SQL fingerprints in the table. You can sort the table by count. |
| Retries | The cumulative number of retries to execute the SQL statement (or multiple statements having the same fingerprint) within the last hour or the specified time interval. |
| Rows Affected | The average number of rows returned while executing the SQL statement (or multiple statements having the same fingerprint) within the last hour or the specified time interval. The number of rows returned are represented in two ways: The numerical value shows the number of rows returned, while the horizontal bar is color-coded (blue indicates the mean value and yellow indicates one standard deviation of the mean value of the number of rows returned). The bar helps you compare the mean rows across all SQL fingerprints in the table. You can sort the table by rows returned. |
| Latency | The average service latency of the SQL statement (or multiple statements having the same fingerprint) within the last hour or the specified time interval. The latency is represented in two ways: The numerical value shows the mean latency, while the horizontal bar is color-coded (blue indicates the mean value and yellow indicates one standard deviation of the mean value of latency). The bar also helps you compare the mean latencies across all SQL fingerprints in the table. You can sort the table by latency. |
Statement Details page
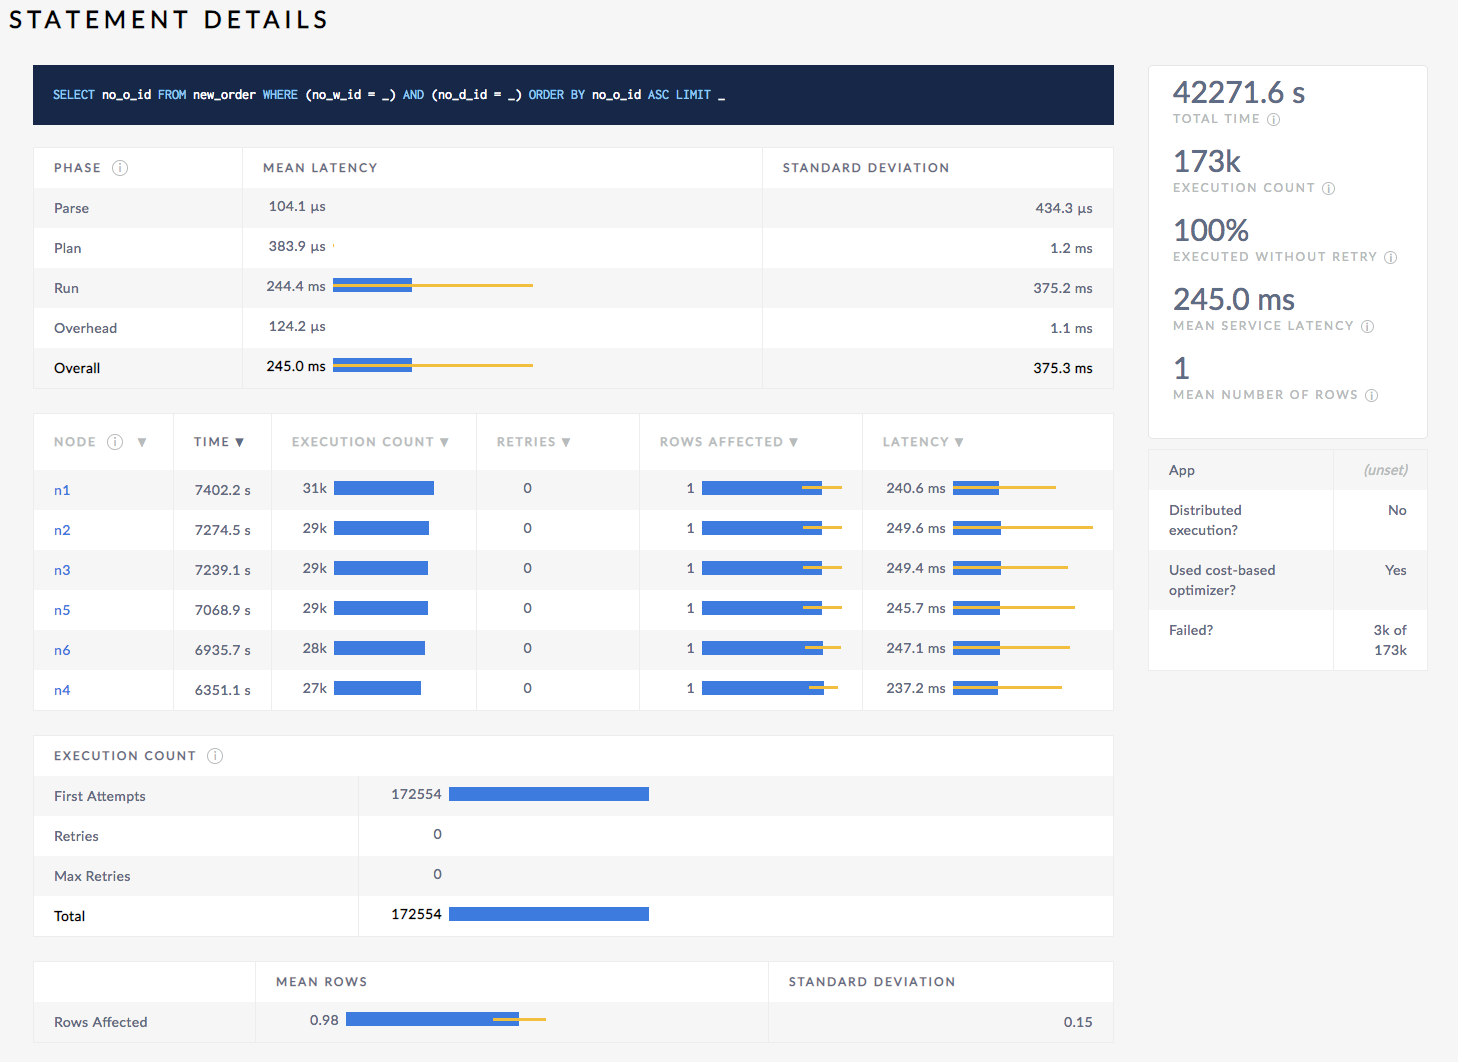
The Statement Details page displays the logical plan as well as the details of the time, execution count, retries, rows returned, and latency by phase and by gateway node for the selected statement fingerprint.
Logical plan
New in v19.1 The Logical Plan section displays CockroachDB's query plan for an explainable statement. You can then use this information to optimize the query. For more information about logical plans, see EXPLAIN.
By default, the logical plan for each fingerprint is sampled every 5 minutes. You can use the sql.metrics.statement_details.plan_collection.period cluster setting to change this time interval. For example, to change the interval to 2 minutes, run the following SET CLUSTER SETTING command:
> SET CLUSTER SETTING sql.metrics.statement_details.plan_collection.period = '2m0s';
Latency by Phase
The Latency by Phase table provides the mean value and one standard deviation of the mean value of the overall service latency as well as latency for each execution phase (parse, plan, run) for the SQL statement (or multiple statements having the same fingerprint). The table provides the service latency details in numerical values as well as color-coded bar graphs: blue indicates the mean value and yellow indicates one standard deviation of the mean value of latency.
Statistics by Gateway Node
The Statistics by Gateway Node table provides a breakdown of the number of statements of the selected fingerprint per gateway node. For each gateway node, the table also provides the following details:
| Parameter | Description |
|---|---|
| Node | The ID of the gateway node. |
| Time | The cumulative time taken to execute the statement within the last hour or the specified time interval. |
| Execution Count | The total number of times the SQL statement (or multiple statements having the same fingerprint) is executed. |
| Retries | The cumulative number of retries to execute the SQL statement (or multiple statements having the same fingerprint) within the last hour or the specified time interval. |
| Rows Affected | The average number of rows returned while executing the SQL statement (or multiple statements having the same fingerprint) within the last hour or the specified time interval. The number of rows returned are represented in two ways: The numerical value shows the number of rows returned, while the horizontal bar is color-coded (blue indicates the mean value and yellow indicates one standard deviation of the mean value of the number of rows returned). The bar helps you compare the mean rows across all SQL fingerprints in the table. You can sort the table by rows returned. |
| Latency | The average service latency of the SQL statement (or multiple statements having the same fingerprint) within the last hour or the specified time interval. The latency is represented in two ways: The numerical value shows the mean latency, while the horizontal bar is color-coded (blue indicates the mean value and yellow indicates one standard deviation of the mean value). The bar also helps you compare the mean latencies across all SQL fingerprints in the table. You can sort the table by latency. |
Execution Count
The Execution Count table provides information about the following parameters in numerical values as well as bar graphs:
| Parameter | Description |
|---|---|
| First Attempts | The cumulative number of first attempts to execute the SQL statement (or multiple statements having the same fingerprint) within the last hour or the specified time interval. |
| Retries | The cumulative number of retries to execute the SQL statement (or multiple statements having the same fingerprint) within the last hour or the specified time interval. |
| Max Retries | The highest number of retries for a single SQL statement with this fingerprint within the last hour or the specified time interval. For example, if three statements having the same fingerprint had to be retried 0, 1, and 5 times, then the Max Retries value for the fingerprint is 5. |
| Total | The total number of executions of statements with this fingerprint. It is calculated as the sum of first attempts and cumulative retries. |
Row Count
The Row Count table provides the mean value and one standard deviation of the mean value of cumulative count of rows returned by the SQL statement (or multiple statements having the same fingerprint). The table provides the service latency details in numerical values as well as a bar graph.
Statistics
The statistics box on the right-hand side of the Statements Details page provides the following details for the statement fingerprint:
| Parameter | Description |
|---|---|
| Total time | The cumulative time taken to execute the SQL statement (or multiple statements having the same fingerprint) within the last hour or the specified time interval. |
| Execution count | The total number of times the SQL statement (or multiple statements having the same fingerprint) is executed within the last hour or the specified time interval. |
| Executed without retry | The percentage of successful executions of the SQL statement (or multiple statements having the same fingerprint) on the first attempt within the last hour or the specified time interval. |
| Mean service latency | The average service latency of the SQL statement (or multiple statements having the same fingerprint) within the last hour or the specified time interval. |
| Mean number of rows | The average number of rows returned while executing the SQL statement (or multiple statements having the same fingerprint) within the last hour or the specified time interval. |
The table below the statistics box provides the following details:
| Parameter | Description |
|---|---|
| App | Name of the application specified by the application_name session setting. The Statements Details page shows the details for this application. |
| Distributed execution? | Indicates whether the statement execution was distributed. |
| Used cost-based optimizer? | Indicates whether the statement (or multiple statements having the same fingerprint) were executed using the cost-based optimizer. |
| Failed? | Indicate if the statement (or multiple statements having the same fingerprint) were executed successfully. |
