
In an ideal world, all workloads are perfect and never face performance issues. In the real world, that’s hard to achieve. Your workload might not always follow best practices, or it could contain problematic queries that cause trouble.
The causes of workload performance issues vary. Your workload could have a statement using a non-performant index that slows down your reads and writes, or it might have a transaction that runs concurrently with another transaction using the same table, resulting in contention. There could be an index that was created but never used, or even a bad statement that retries or fails on execution.
Solving these issues could cut costs and provide a better experience for your application’s end users. But it’s difficult to pinpoint the exact cause of these issues, so many of them never get fixed.
The CockroachDB Console provides historical and real-time information about your workloads in an interactive UI. For example, the Console’s SQL Activity page displays statistics about statements and transactions, such as latency, retries, contention, and explain plans, and you can decide what is important to you by adding filters or choosing which columns on the tables you want to see and order by.
Having a lot of information can be useful, but sometimes you want to focus on just the optimization opportunities and the most problematic executions, and you need a way to easily identify them. To help with this scenario, we introduced the Insights page to our Console.
The Insights page exposes problems that CockroachDB has detected in your workloads and schemas then offers recommendations to improve the performance of your workload.
Workload Insights for better query performance
On the Workload Insights tab, we display insights from your workloads that contain slow executions, alongside the possible causes for poor performance. There is one view for Transaction and another for Statements.
Transaction Executions
The Transaction Executions view displays the latest execution by transaction fingerprint that experienced high contention. The remaining executions that experienced contention and are not being displayed are available on the table crdb_internal.transaction_contention_events. We consider a contention duration high when it is greater than 100ms (set by the cluster setting sql.insights.latency_threshold).
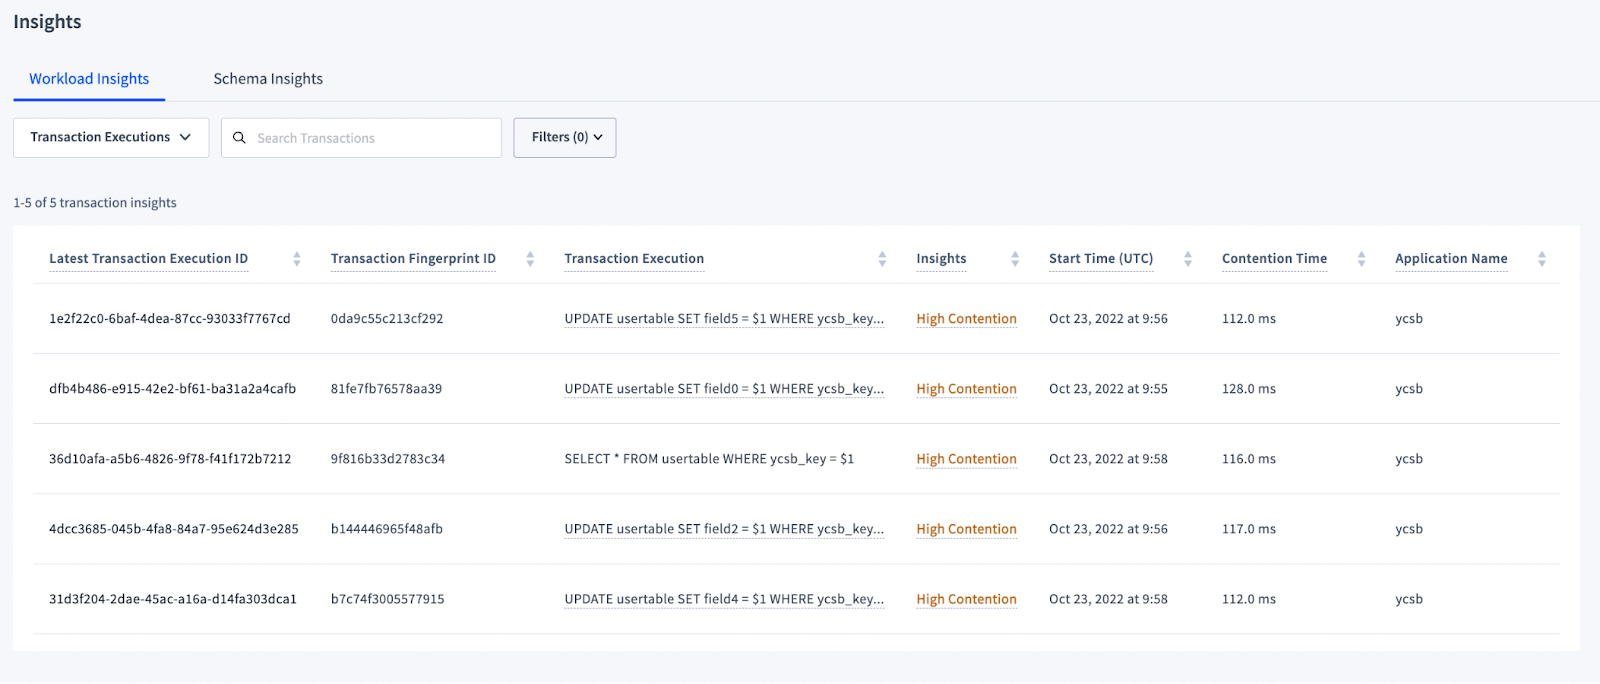
Clicking on a value in the Latest Transaction Execution ID column brings you to its details page. This page contains more information about that particular execution, including which transactions it waited on.
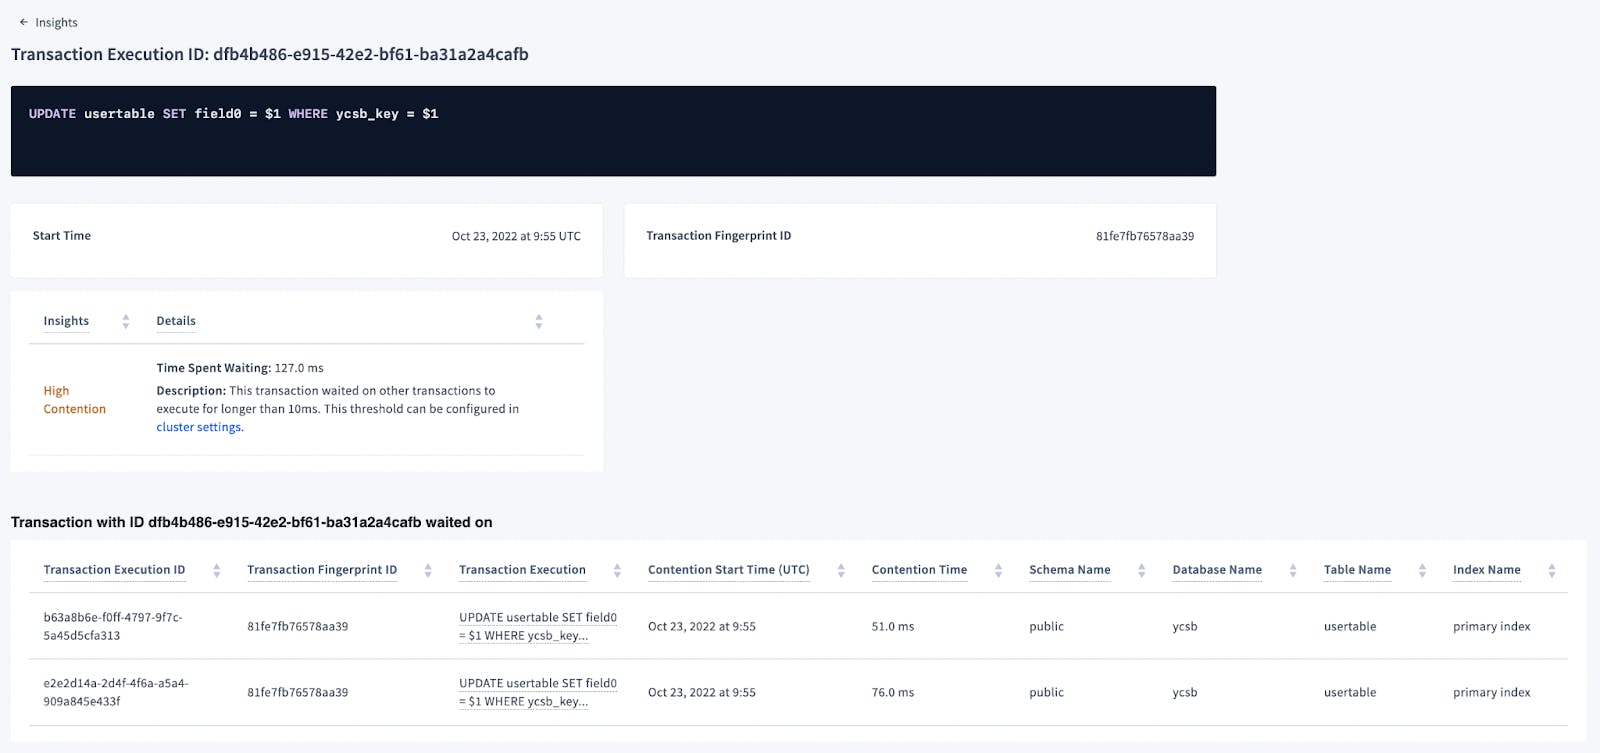
Knowing which transaction is causing contention can help you adjust your workload and follow contention best practices.
Statement Executions
On this table, we show the latest execution by statement fingerprint that was triggered by any of the two conditions:
Slow Execution: The execution took longer than 100ms to finish (defined by the cluster setting
sql.insights.latency_threshold).Anomaly: The execution latency was
>p99 && >2*p50and took longer than 50ms to execute (defined by the cluster settingsql.insights.anomaly_detection.latency_threshold).
The historical executions triggered but not displayed on the console are available on crbd_internal.cluster_execution_insights.
The possible insights for flagged statements are:
High Retry Count: The execution was retried more than 10 times (cluster setting sql.insights.high_retry_count.threshold).
High Contention: The execution experienced contention for at least 100ms (cluster setting sql.insights.latency_threshold).
Suboptimal Plan: The execution has index recommendations that would improve their plan.
Failed: The execution failed.
Slow Execution: The execution was slow, but didn’t experience any of the above problems.

Similar to the Transaction view, clicking on any value on the Latest Statement Execution ID column, will bring you to its details page. On this page you will see more information about the execution and the insights detected.

Each Insight has its own details, with more information about what the Insight means and suggestions for how to fix it.
Schema Insights
The Schema Insights tab focuses on index recommendations that will improve read and write performance.
Warning: Schema changes consume additional resources and can potentially negatively impact workload responsiveness during execution.
We display a drop index recommendation when the index has not been used for over 7 days (defined by cluster setting sql.index_recommendation.drop_unused_duration).
RELATED
Forward Indexes on JSON columns
Index recommendations to create, replace, or alter an index, are shown based on the plan used for each statement execution. You must execute the same fingerprint at least 6 times to receive a recommendation, because CockroachDB assumes that you are no longer merely experimenting with a query up until that point.

The last column of the Schema Insights table shows an “Apply” button (available only for self hosted and DB Console). If the SQL user logged into the Console has schema change permissions, you can apply the recommendation directly from the UI, otherwise you have the option to copy the SQL command and execute it using a SQL client with a user that has the right permissions.

The drop recommendations can also be found on the Databases page, where you will see an alert indicating that a particular Database/Table has recommendations.

The create, replace, and alter recommendations are also displayed on the Explain Plan tab of the Statement Details page. While the Schema Insights only displays the latest recommendations for that statement fingerprint, the Explain Plan tab displays all recommendations generated by all plans. When you execute the same statement after creating or updating an index, the recommendation disappears from the Schema Insights page.

These recommendations can also be seen when executing the EXPLAIN command from a SQL client, but without the need to execute the statement multiple times.

Workload and Schema Insights
Workload & Schema insights provides developers with a seamless experience when building their world-changing applications with a distributed database like CockroachDB. The initial set of insights was motivated based on internal telemetry data that allowed us to understand how developers were struggling with tuning their database for optimal performance. Based on this internal telemetry data, we’ve curated these insights directly in the console and we’re excited to have these insights accessible for all end-users to take advantage of and maximize their experience with CockroachDB.
If a video demonstration of the tool is helpful, check out this demo created by my colleague, Kevin Ngo (Sr Product Manager):
If there is a new feature that you want or you’re having a performance issue and you need our assistance, use one of our support resources to reach out to us, we’re happy to help!
To learn more about query performance, check a few other resources:
• SQL Performance Best Practices
• SQL Query Tuning with DB Console