
Observability is how you understand the current state of your database: how it is behaving, plus any potentially problematic things you should be paying attention to — and identifying improvements based on this information.
In CockroachDB we have multiple teams dedicated to observability. Our job is collecting information about your workload and current status of your database so you are better equipped to understand any problems that may arise. We offer two tools for accessing this information: This information can be seen in our ccloud CLI, which allows you to create, manage, and connect to CockroachDB clusters from the command line. It is also available in Cockroach DB Console, the native tool packaged with every binary to provide observability for any workload. The DB Console gives operators and developers access to important cluster data including Metrics, Databases, Sessions, Transactions, Statements, and more. This is all great information to have at your fingertips – but what exactly should you be using it for? Well, how about identifying opportunities for capturing better performance? In this blog post, we focus on SQL observability and how to use the DB Console to find SQL statements experiencing performance issues.
DB Console overview
The Overview page provides a cluster overview. It’s also the gateway to accessing the Metrics page.

The Metrics page is where to find information about SQL statement latency, contention, and errors. Here, with a single glance, you should be able to identify any periods with higher than expected levels for these metrics — indicating where issues might be happening.
Having identified a possible problematic period, you can now check the SQL Activity page for more details on that particular period.
The SQL Activity page provides an array of information based on:
The
represents a SQL statement by replacing literal values (e.g., numbers and strings) with underscores (_).
The transaction fingerprint represents the list of statement fingerprints in order of execution within that transaction.
The statement fingerprint ID is the combination of the statement fingerprint, the database it was executed on, the transaction type (implicit or explicit) and whether execution has failed (true or false).
When statements and transactions are executed, CockroachDB aggregates the statistics per statement and transaction fingerprint IDs in one hour “buckets.” This means that if a statement was executed at 9:10 and another with the same fingerprint ID was executed at 9:58, both statistics will be aggregated with a timestamp of 9:00. That information is displayed on the SQL Activity page.
Tip: Tagging your application with a label or name when connecting to your database, can be very helpful to quickly filter and isolate the application-specific problematic workloads. You can follow these Client Connection Parameter instructions to set the application name when connecting to your database.
Statements and Transactions pages work in a very similar way, but it’s worth taking a look at each of them.
The Statements page
At this point, if you already know there is a particular application, database, node or region that is facing problems, select them on the filter.
You can then use the column selector to show only the columns that we’re interested in for this analysis, e.g. Execution Count, Statement Time, Contention, Retries and % of All Runtime.

Next you can click on the columns to sort via any of them, allowing an easy visualization of statements that might be facing higher contention and/or retries. You can also see statements that take the majority of the workload run time, (which you should consider finding improvements for).
On this page each statement fingerprint ID will be a single row, with the values on the columns being the aggregation on the period selected on the time picker. For values such as contention we show mean and deviation, and for values such as retries, we show the total. You can hover each column’s title to get more information about each one!
Clicking on the value on the statement column for the statement of interest will bring you to its Details page. Here you will find information about failures, full scan, among others, and also the charts with statistics displayed for the selected period (using the 1 hour bucket).
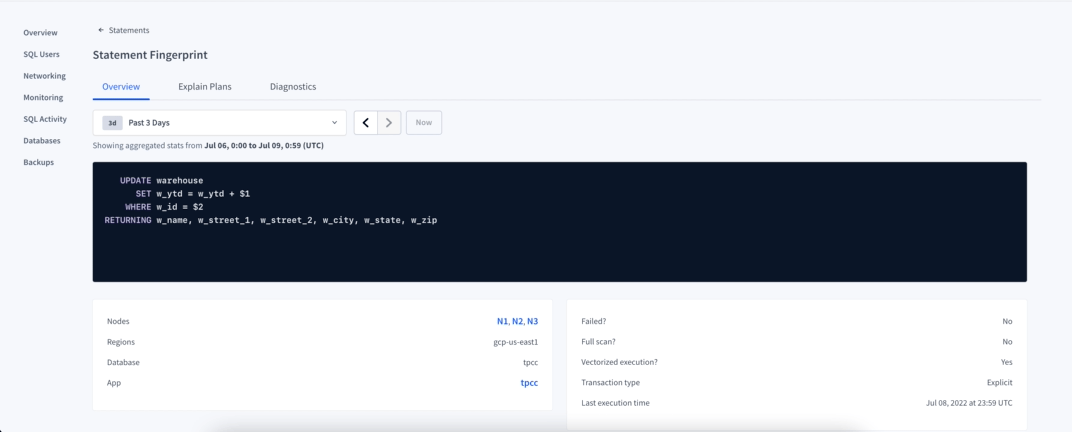
On this page there is also information about Explain Plans used by this statement and any Diagnostic Bundle you might have collected for it. If you need more information about a particular statement, you can activate the Statement Diagnostics Bundle from the Diagnostics tab inside the Statement Details. Alternatively you can use the Diagnostics column on the Statement page, selecting when to collect and for how long the request should try before it expires.

When you’re in contact with our support team to get help on diagnosing a problem with a particular statement and the problem is persistent or you can reproduce it, generate the bundle for that statement and provide it to our team, so we can better assist you.
Tip: You can also use our CLI to generate a bundle, using EXPLAIN ANALYZE (DEBUG), and when the issue is intermittent, you can use the slow query log to get some information about it.
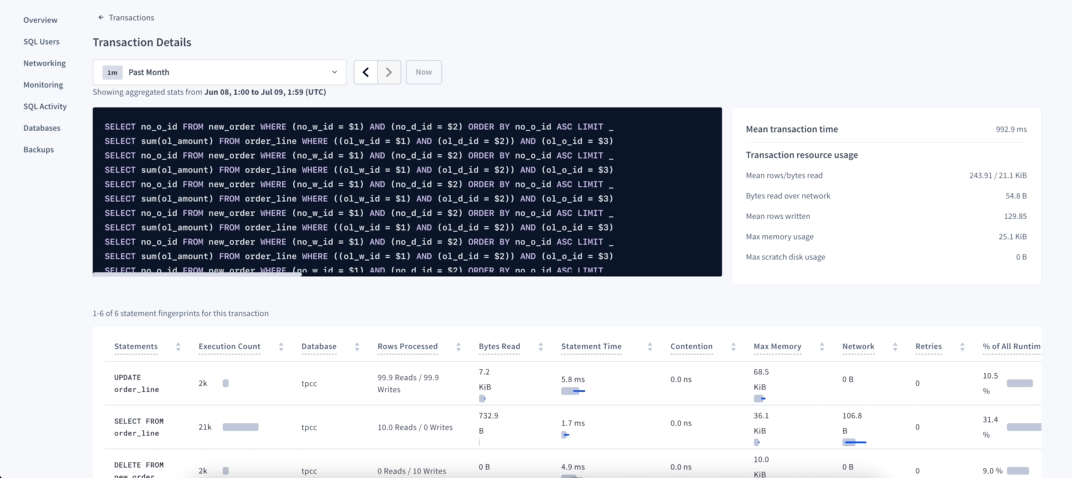
The Transactions page
Now we focus on the Transactions page. Similar to the Statement page, you can sort by contention and retries to look for the transactions having more issues and then look into the Details page for more information.
The other important metrics are the transaction time — because any transaction time that doesn’t fall within the required SLA should be improved — and number of statements, because transactions with a large number of statements have a higher chance to experience that problem.
Click on the transaction to open its Details page and view the statistics about all the statements that were executed on that transaction. If you notice particular statements that have higher execution time, contention or retries, you can drill down to that particular statement, and get more information about it. If none of the statements seems to have an issue, but you still have a lot of them into a single transaction, consider breaking it down into smaller units of work.
Once you have found the problematic statements and transactions, and with the collected information in hand, you can take actionable steps to resolve the root cause. For more details and suggestions, see the list of resources at the end of this blog post.
Observability in complex product environments like CockroachDB is crucial, and we’re continuously working on improvements and new features. For example, the team is currently working on a dedicated insights page to guide you on what you can do to improve the performance of the statements that are facing performance issues.
If there is a new feature that you want or you’re having a performance issue that you need our assistance, use one of our support resources to reach out to us, we’re happy to help!
Resources
To learn more about this topic, check a few other resources:
Query behavior troubleshooting