Over the past year, Cockroach Labs has been working hard to give our observability tooling some extra love. When it comes to monitoring our cloud products, such as CockroachDB Dedicated, meeting our customers where they are is one of our primary goals. Many organizations already have a platform in place to monitor their systems, and we’d like them to feel right at home when it comes to monitoring their CockroachDB cluster. But with so many platforms available in the ever-changing observability market today, like Datadog, Amazon CloudWatch, and more, how do we stay flexible in our observability tooling? The popular tools of today are not guaranteed to stand the test of time. Therefore, we need a platform for third party monitoring integrations that’s flexible enough to support both the platforms of today, as well as those of tomorrow.
For Cockroach Labs, we chose the OpenTelemetry Collector to serve as such a platform and to integrate with Datadog as the first of what we hope to someday be a substantial library of third party integrations. This blog post discusses the capabilities of the OpenTelemetry Collector and how we introduced it into our cloud infrastructure.
What is the OpenTelemetry Collector? 
The OpenTelemetry framework is a collection of tools, APIs, and SDKs for cloud-native software that makes it easy to instrument, collect, and export telemetry data. The project is an evolution formed through a merger of the older (and soon deprecated) OpenTracing and OpenCensus projects, and is strongly backed by the Cloud Native Computing Foundation.
As mentioned before, a key piece of this initiative is the OpenTelemetry Collector. The Collector is a single process capable of scraping various telemetry data formats (metrics, logs, and traces), such as Prometheus metrics, transforming them into the common OTLP format, and exporting them to various external targets, such as (but not limited to) Datadog. The Collector has a modular design, made up of a few core components:
Receivers: these provide a way to get data into the Collector; these can be push or pull based. A
wide array of different receivers are supported
, and the list is constantly growing.
Processors: these define what to do with telemetry data once received, such as transformations, routing, redaction, and more.
Exporters: these define where to send data after it’s been received and processed; these can also be push or pull based. There’s also a wide variety of exporters available, many
built & supported by the platforms they export to
.
Each of these core components are chained together through pipelines. Multiple instances of the same component can exist within a single Collector process, and they can be chained together in many different ways via pipelines via YAML configuration.
Source: opentelemetry.io
Collecting Telemetry from CockroachDB
The modular design of the Collector provides us with the flexibility we need to provide customers with interchangeable third party integrations. To begin, every node of a CockroachDB cluster exports granular time series metrics. The metrics are provided in a Prometheus format, and what do you know? The Collector has a receiver for that! Once configured, the Prometheus receiver can be configured as part of a pipeline.
If the metrics aren’t initially in the proper format for export to Datadog, we can enlist the help of one of the many Collector processors to handle any transformations. For example, we can use the filter processor to eliminate the metric set down to just those metrics we feel are relevant & actionable to our cloud customers. If metrics need to be renamed to fit the specific style of a third party export target, we can make use of the metrics transform processor.
By this point, we have received our telemetry payload and formatted it as needed. Now, it’s time to send the payload to the customer’s observability platform of choice - for example, Datadog. Luckily for us, there’s an exporter for that as well! The Datadog exporter (by now, you might be picking up on a theme here!). We can configure the Datadog exporter with the necessary customer credentials to export metrics to their Datadog account.
The final step is to piece it all together using a metrics pipeline, which looks something like the below YAML configuration.
pipelines:
    metrics/datadog:
      receivers:
      - prometheus
      processors:
      - filter
      - metricstransform
      exporters:
      - datadog
Such a flexible platform meets our needs quite well. With so many options for each step of the telemetry data’s journey and a large & active base of open-source contributors, the OpenTelemetry Collector is well suited to support CockroachCloud as it evolves.
Now that we’ve seen how the Collector itself works, let’s zoom out a bit. How do these OpenTelemetry Collector processes fit into the broader CockroachDB cluster?
OpenTelemetry Collector alongside CockroachDB
The official OpenTelemetry documentation notes that the OpenTelemetry collector consists of two primary deployment methods:
Agent: A Collector instance running with the application or on the same host as the application (e.g. binary, sidecar, or daemonset).
Gateway: One or more Collector instances running as a standalone service (e.g. container or deployment) typically per cluster, data center or region.
It’s recommended that the agent is deployed on every host within an environment. In the context of CockroachDB, this means that each VM running a CockroachDB process should also run a Collector agent process. The agent process is given the responsibility of receiving the initial telemetry payload and applying any necessary transformations before forwarding the payload to the gateway.
Unlike the agent, only a single gateway process exists in the cluster (or in a multi-region cluster, in each region). The gateway’s primary responsibility is “last-mile” delivery of telemetry payloads to customer export targets like Datadog.
In practice, the deployment looks something like this:
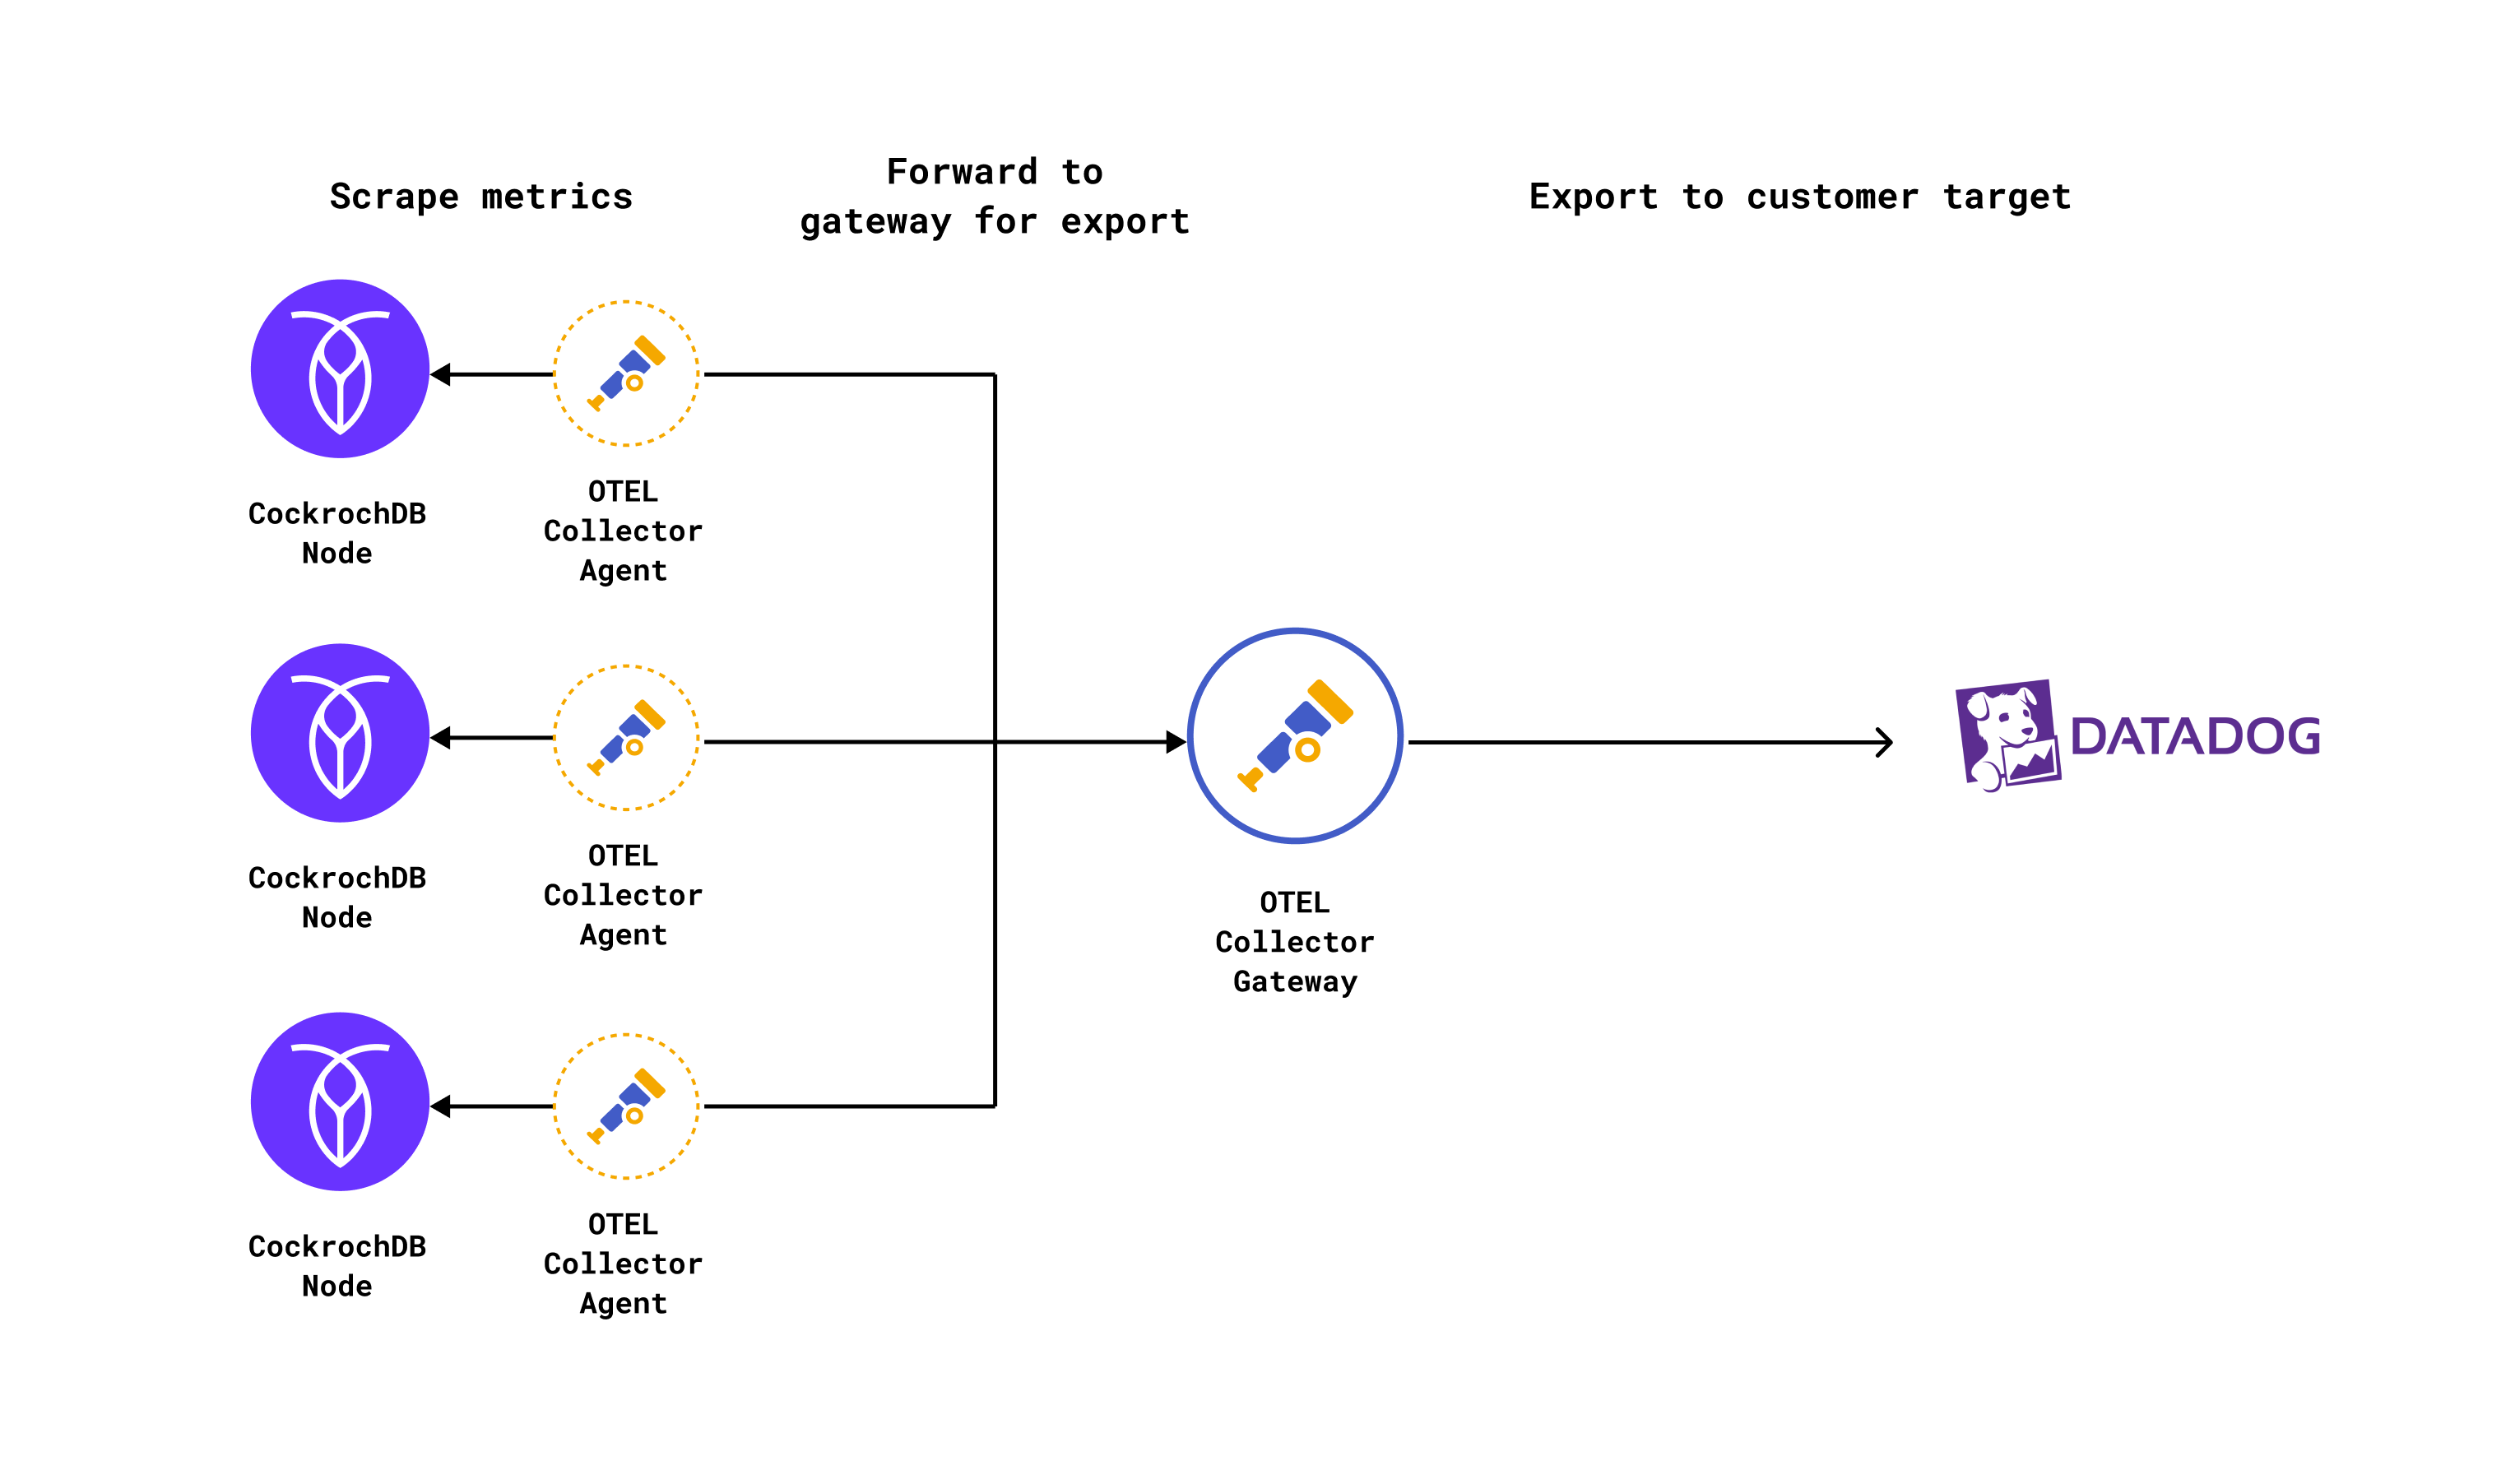
This division of responsibility across the agent and gateway Collector has some nice benefits, the primary one being that we can better limit the number of egress points required to send telemetry payloads to a single gateway process, as opposed to multiple agent processes. The same goes for API token secrets used to deliver telemetry data to customer targets.
RELATED
DASH: How to evaluate Kubernetes-native databases
Let’s get a bit more specific now that we understand the primary deployment model. CockroachDB Dedicated runs in Kubernetes, and therefore all OpenTelemetry Collector processes are run inside their own Pod. For the agent, we need one process per-host. Therefore, we use a Kubernetes DaemonSet to deploy the agent processes, which ensures that all nodes run a copy of the agent pod. For the gateway, we only need one per-region, so a Kubernetes Deployment fits our needs well. The deployment allows us to specify a desired number of replicas within each CockroachDB region, and enables us to easily scale the number of replicas if necessary.
When it’s all put together, a CockroachDB Dedicated cluster looks like:

Pretty cool! But you might be wondering - if the Collector is run on the same host as the CockroachDB node, won’t that eat away at the CockroachDB node’s resources? Indeed, resources are finite. We place resource limits on each Collector pod within the cluster, of course, to avoid any type of “runaway train” scenario. However, we have been quite impressed by the efficiency of the collector. Even with the telemetry of 12 CockroachDB nodes in a single region flowing through a single gateway process, we’ve yet to see a Collector use more than 75MB of memory. Furthermore, 75MB itself is an outlier. The average Collector container’s RSS memory usage at the time of writing is a mere 47MB. On the CPU front, things are quite efficient as well, with the Collector using an average of 0.003 of a single vCPU core. Therefore, the impact on the CockroachDB node itself is negligible.
What’s next?
In its initial iteration, the OpenTelemetry Collector stack in CockroachCloud is only supported within CockroachDB Dedicated, with Datadog as a “pilot” integration. We would love to continue expanding our library of metrics integrations to include more third party vendors to continue meeting our customers monitoring needs where they feel most comfortable. The Collector is also capable of handling more than just metrics, so there are plenty of opportunities to expand its usage to traces and logs as well, as well as potentially use it for internal telemetry used by our own SREs. All in all, the Collector is a very powerful and flexible observability tool that provides many possibilities for the future. We here at Cockroach Labs look forward to evolving alongside it.