"I'll know it when I see it" is the classic car buyer's line, but it's also the one thing old-school search bars totally fail to deliver.
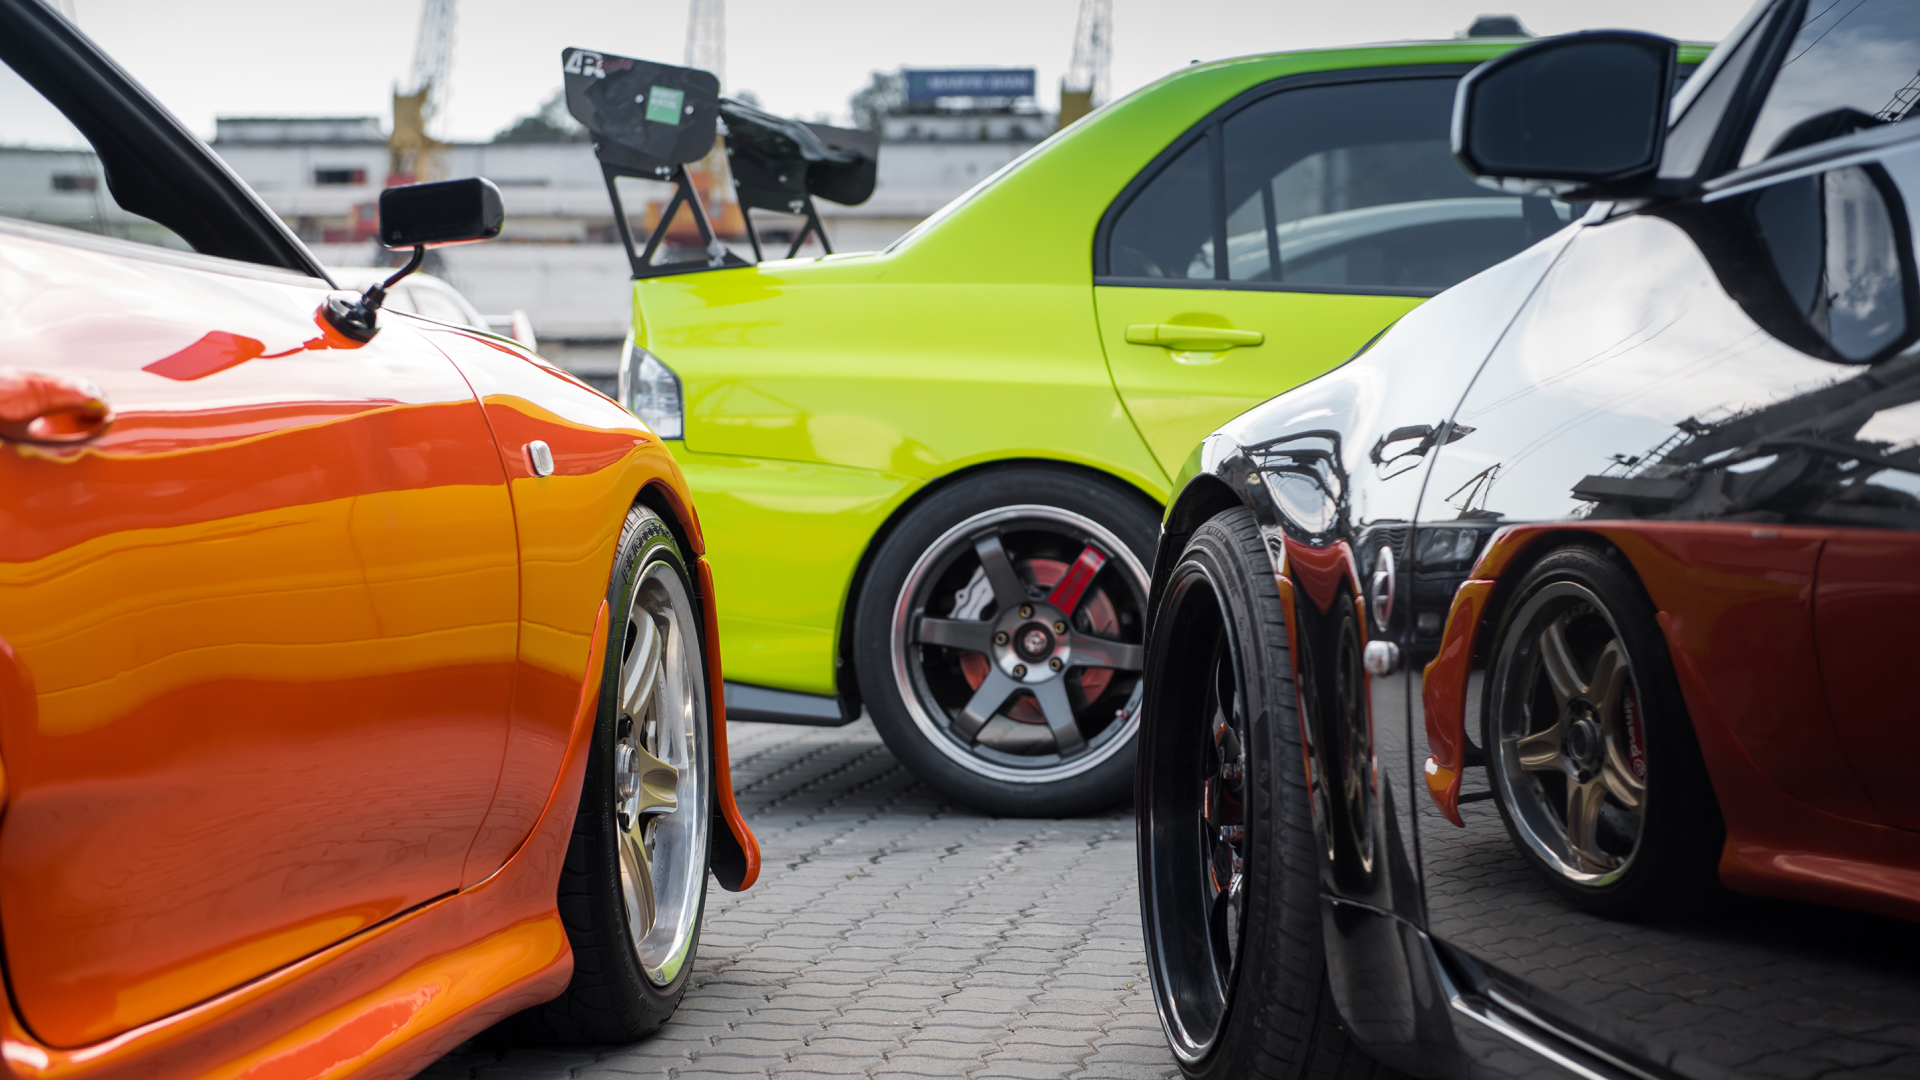
Traditional keyword search fails when a customer wants a car that "looks like this photo from Fast and Furious." This is where vector search comes in, transforming unstructured data into mathematical vectors to find semantically similar items.
In this blog I’ll walk you through a fun little demo I cooked up called "Cockroach Cars." I use a combination of Python and SQL to find cars currently available for purchase. We'll check out how to use CockroachDB as a spot to stash vectors, make embeddings, peek at the vector space, and even do cool image-to-image similarity searches—all right inside the database just using SQL.
1. Visual Search: Finding That "Fast and Furious" Look
Time to talk about the main attraction: finding a car just from a picture! This is the cool part. There is no need to sift through lists, hoping the seller provided the right keywords in their description, like "vintage muscle" or "street racer." Just paste the photo, the app turns it into a vector, and then asks CockroachDB to find the most similar cars.
The Process
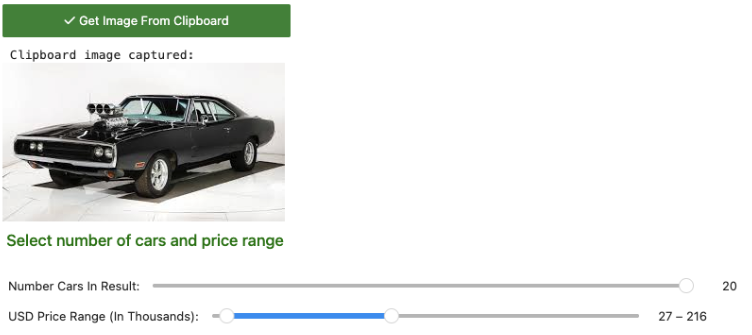
Input: The user copies an image to their clipboard.
Embedding: In the program, a vector embedding is generated for that image using the loaded CLIP model.
SQL Query: We run a K-Nearest Neighbors (KNN) search directly in CockroachDB using the
<->(L2 Distance/Euclidean) operator.Provide filters like the number of items returned within a price range.
The user copies an image of their ideal "Fast and Furious" vehicle to the clipboard, along with the quantity of cars found in the search results and the desired price range.
Check out the SQL query that makes this semantic magic happen to find the ride you actually want.
The query filters by price range (a standard scalar filter) and sorts by vector similarity (distance) simultaneously.
The Results
In our example search, we used an input image of a classic muscle car. The search returned:
1969 Pontiac Firebird ($46k)
1969 Chevrolet Camaro ($335k)
1966 Chevrolet Sport ($41k)
1968 Pontiac GTO ($45k)
1964 Oldsmobile Jetstar 88 Holiday Coupe ($33k)
1967 Pontiac Firebird ($29k)
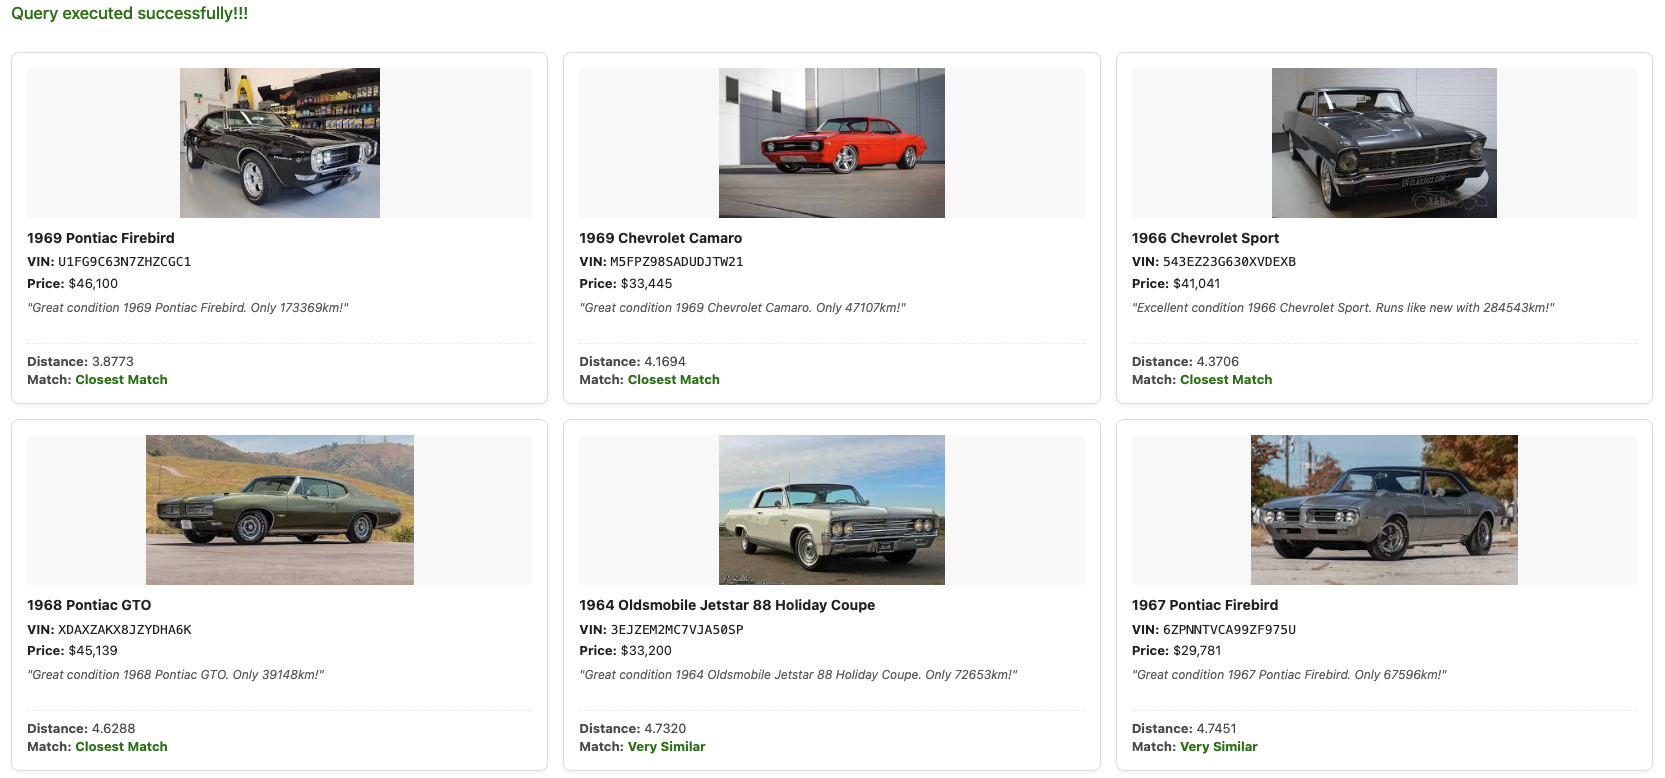
The results are remarkably consistent. Despite different makes and models, all returned vehicles share the distinctive visual characteristics of late-60s American muscle cars (boxy hoods, circular headlights, chrome bumpers).
2. Under the Hood
To bring "Cockroach Cars" to life, we need a setup that can handle both standard relational data and high-dimensional vector operations without getting bogged down. A stack that is developer-friendly, and capable of executing complex similarity searches right inside the database. Here is the specific toolkit I used to build this engine.
The Tech Stack
CockroachDB Database: With distributed SQL and vector search, all in one.
Language: Python (Jupyter Notebook environment)
Python Libraries:
sentence-transformers(CLIP model),scikit-learn(PCA/KMeans),plotly(3D visualization)Database Driver:
psycopg(PostgreSQL adapter)
I’m using the CLIP (Contrastive Language-Image Pre-training) model (the clip-ViT-B-32 version from sentence-transformers). CLIP is perfect for this because it puts both images and text in the same "vector space," which lets you search with either text-to-image or image-to-image.
    # Load the model
    from sentence_transformers import SentenceTransformer
    model = SentenceTransformer('clip-ViT-B-32')
Then connect to a CockroachDB cluster using a connection string formatted for psycopg.
The Data
I collected the vehicle image dataset from various internet sources, including Kaggle and GitHub. To create the corresponding synthetic metadata, I developed a Python script leveraging the Faker package. The complete process involved three steps:
Loading the images into a staging table
Generating both the image embeddings and the metadata
Inserting this information into the
for_sale_inventorytable
This final table holds the vehicle metadata alongside their respective image embeddings.
3. Data Exploration
Before diving into vectors, let’s do some standard SQL analysis to get a feel for the dataset. We're working with 4,597 vehicles and 19 columns with images, embeddings, and metadata.
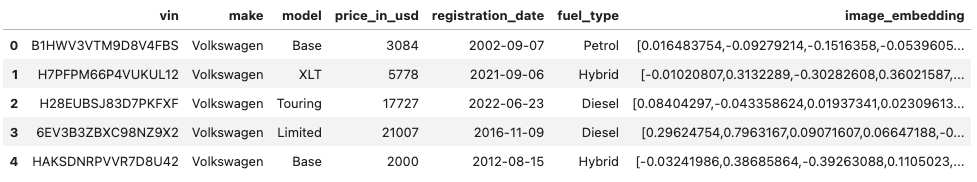
A quick look at the data reveals columns like vin, make, model, price_in_usd, registration_date, fuel_type and image_embedding.
result = %sql SELECT vin, make, model, price_in_usd, registration_date, fuel_type, image_embedding FROM for_sale_inventory;
df = result.DataFrame()        # Convert to Pandas DataFrame
df.head(5)                     # Preview 5 data rows
Upon execution of the code above, the query successfully retrieved 4,597 records from the inventory table, which are now stored in our DataFrame (see below).
Visualizing Inventory Distribution
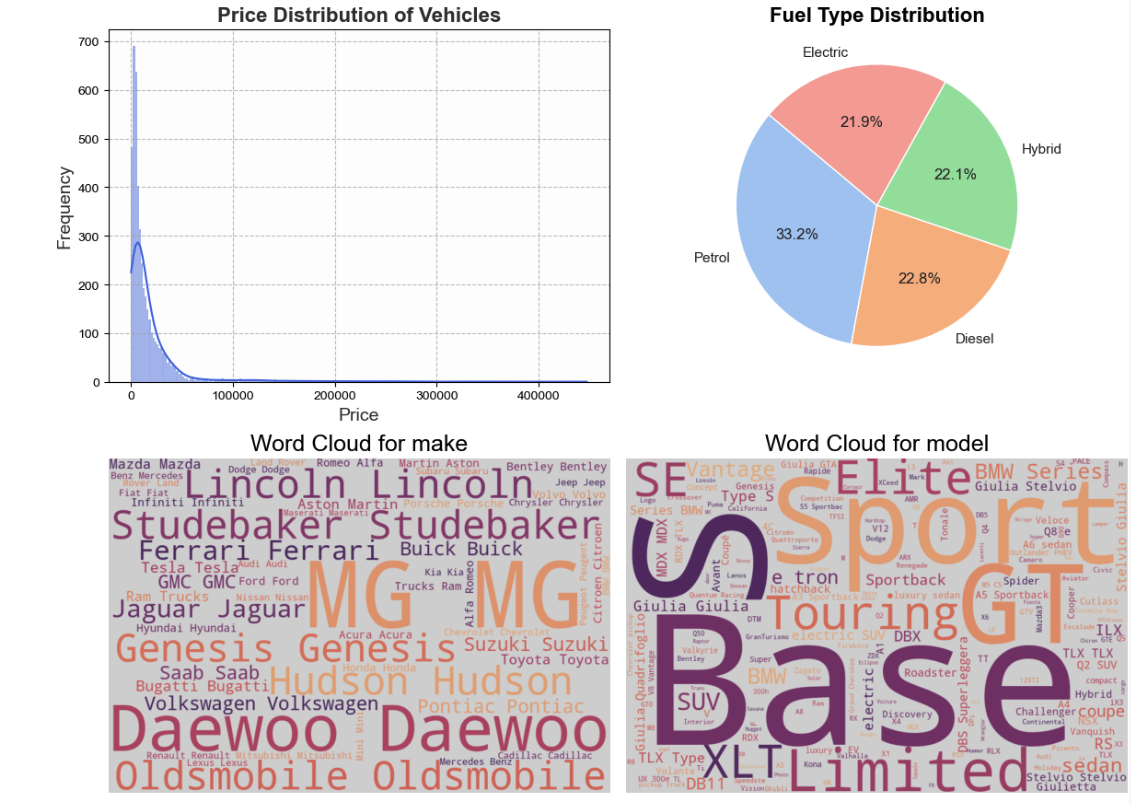
I use matplotlib and seaborn to whip up a dashboard for visualizing the inventory from the Pandas dataframe (result) created in the sample code above.
Price Distribution: A histogram shows the price spread, likely right-skewed with a long tail of luxury vehicles.
Fuel Type: A pie chart reveals a diverse mix of Electric (21.9%), Hybrid (22.1%), Petrol (33.2%), and Diesel (22.8%) vehicles.
Inventory Cloud: Word clouds for "Make" and "Model" highlight dominant brands like Volkswagen, Acura, and Pontiac.
4. Visualizing the Vector Space
CockroachDB's C-SPANN vector indexing is super smart! It uses a hierarchical k-means tree (see figure below) to organize vector data for very efficient similarity searches. Basically, it grabs your categorized data (like, all the Toyota models), groups them using k-means (think of it like sorting them into handy 3D clusters), and then makes a map of all that complex high-dimensional info. This organized tree lets the database zoom right to the closest matches without having to look through everything.
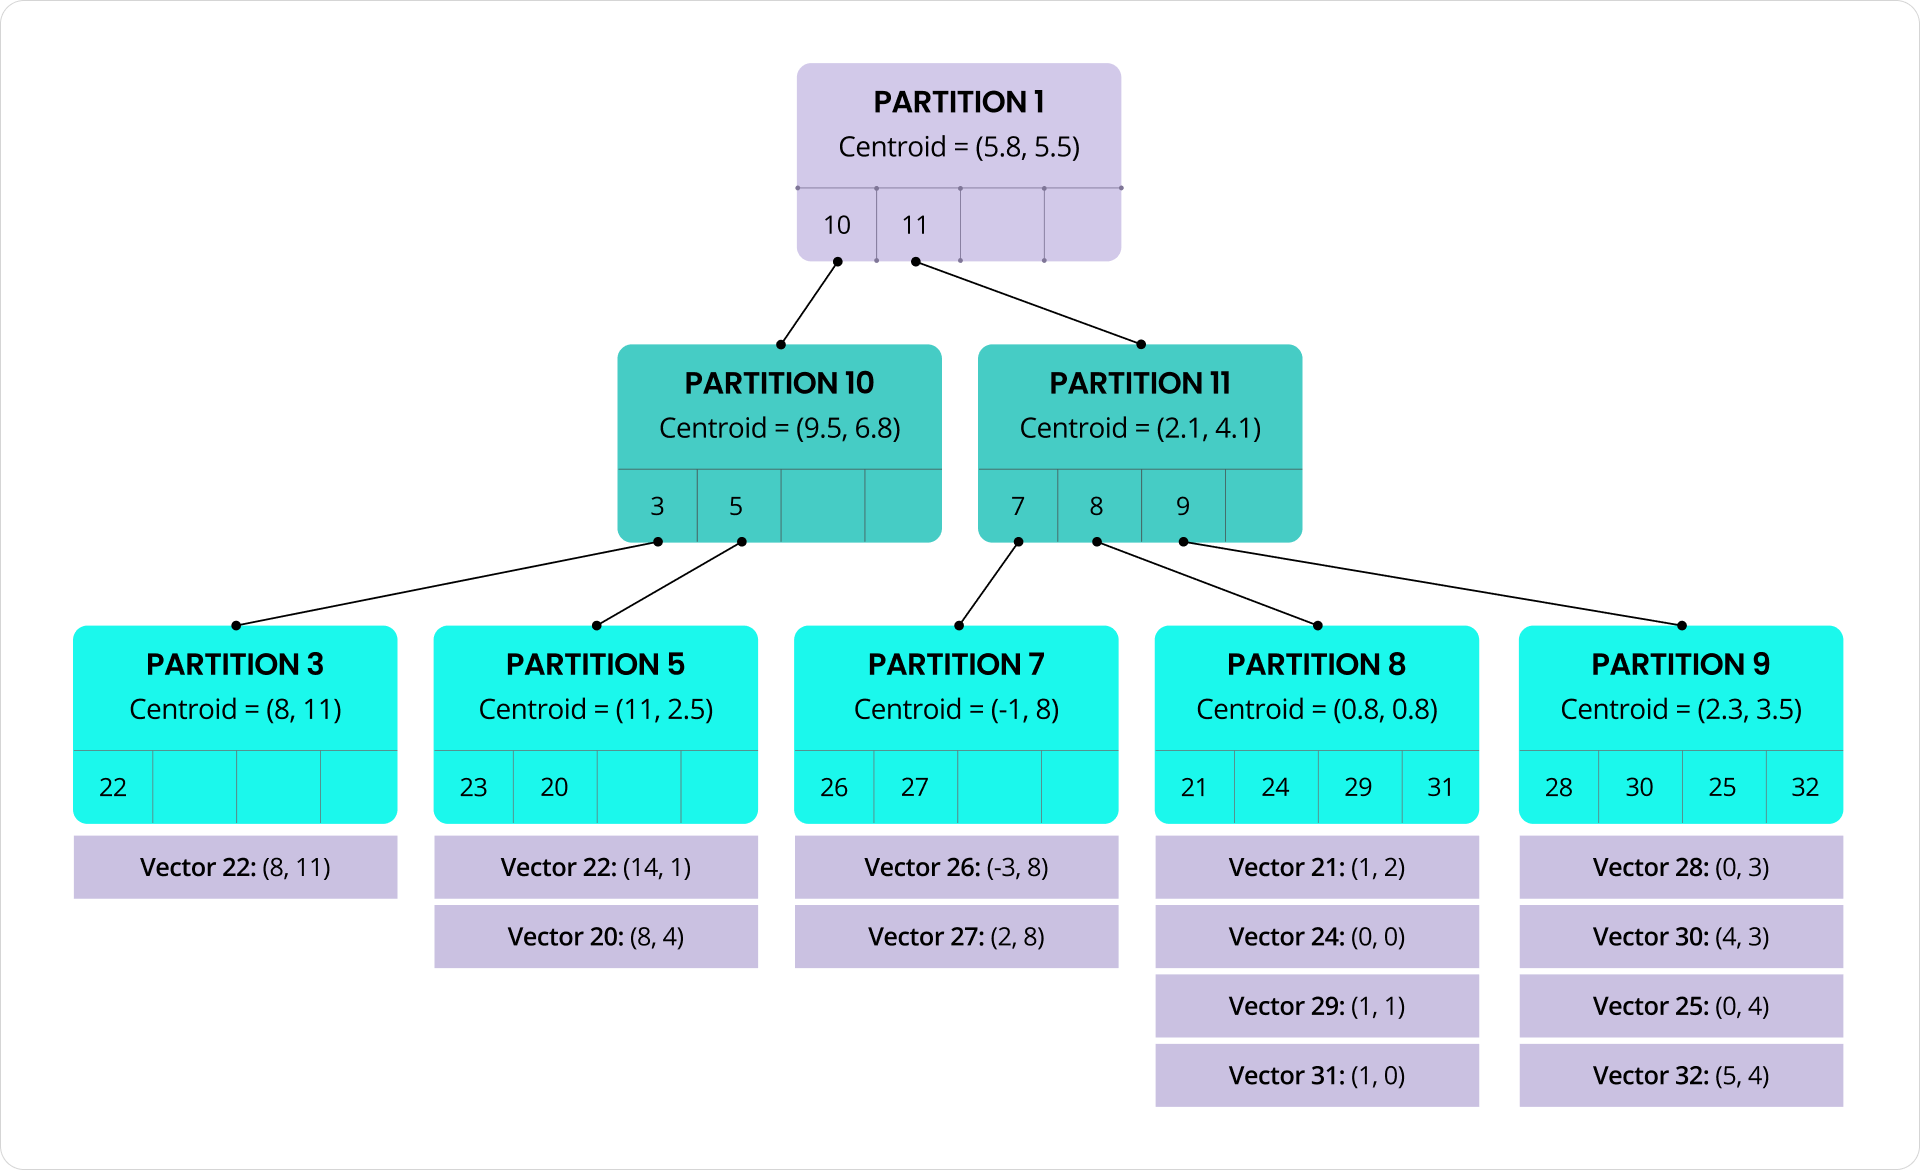
Image Caption: Hierarchical K-means Tree
For more information see:
Introducing Distributed Vector Indexing to CockroachDB by David Bressler
Real-Time Indexing for Billions of Vectors: How we built fast, fresh vector indexing at scale in CockroachDB by Andy Kimball
RELATED: Check out this video by Technical Evangelist Rob Reid, who explains why having vectors in the same database as your relational data is a modern-day super power.
Okay, so those car image vectors are 512-dimension arrays of numbers, which, let's be honest, don't make much sense to us humans. To help us see how the images relate to each other, we shrink those super-high-dimensional vectors down to a simple 3-dimensions. In this example we only do this dimensionality reduction for the bottom, or 'leaf,' nodes, though.
The Pipeline
Fetch Embeddings: We retrieve the raw vector strings from CockroachDB.
Parse & Standardize: Convert strings to
float32arrays and normalize them usingStandardScaler.Dimensionality Reduction (PCA): We use Principal Component Analysis (PCA) to reduce the 512 dimensions down to just 3 components. This retains the most significant variance in the data.
Clustering (K-Means): We group the vehicles into 50 clusters (representing different car makes) to color-code the visualization.
The 3D Plot
Using plotly, we plot the vehicles in 3D space.
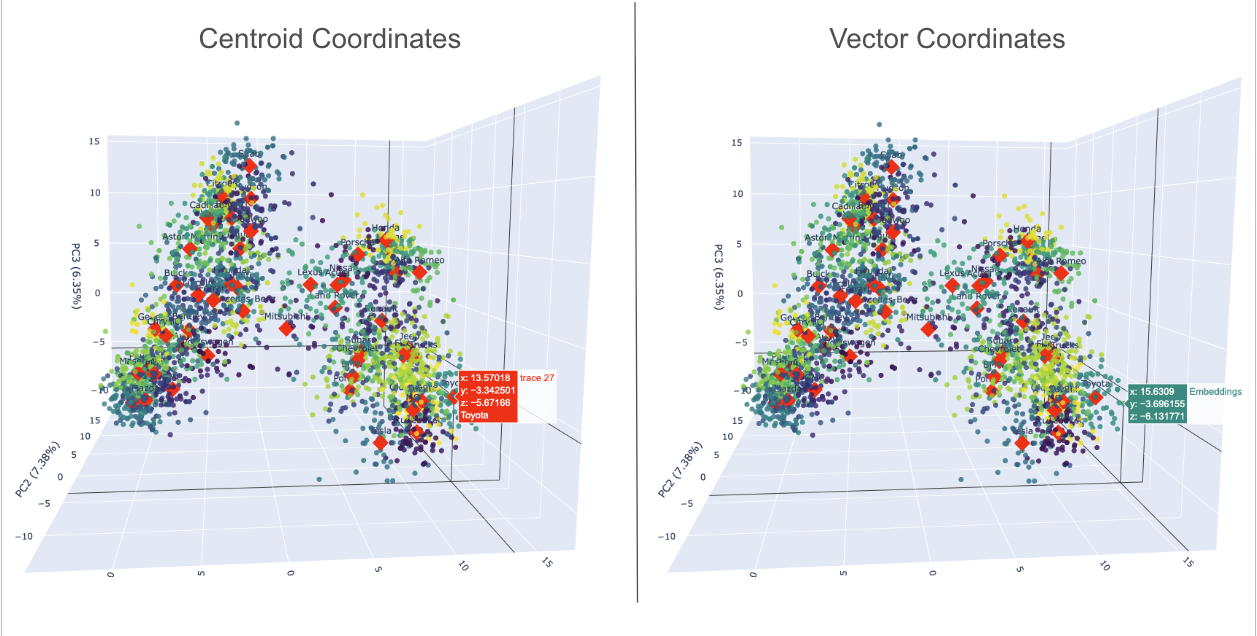
In the interactive plot provided, visually similar vehicles are naturally grouped together. The red diamonds, highlighted on the left side of the figure above, represent the centroids, such as the coordinates for Toyota. The right side of the figure displays the vector coordinates (a car image) corresponding to a selected embedding.
Conclusion
So, the "Cockroach Cars" walkthrough shows how awesome it is when you blend vector search right into standard SQL. You ditch the need for separate embedding services or vector databases, which means you can build smart apps that filter data and find similar stuff semantically with just one quick, easy query. We can query metadata (WHERE price > 50000) and vectors (WHERE image_embedding <-> query) in a single, ACID-compliant SQL statement.
This doesn't just make the whole setup and your data pipeline simpler; you also get all that legendary CockroachDB resilience, easy scaling and multi-region capabilities. So, even the craziest "fast and furious" searches stay efficient, reliable, and available everywhere.
Learn more about how top AI Innovators are achieving success with CockroachDB
Alejandro Infanzon is a Solutions Architect at Cockroach Labs.