Whether you’re a developer or operator, we want to give you the observability tools you need to monitor your CockroachDB cluster. This includes standard tools such as logs, metrics like Prometheus and health endpoints, and alerting. But modern observability requires more than just the standard tools.
To give you as much insight into your database as possible, CockroachDB also provides SQL commands, tables, and a native DB Console packaged with every binary to provide observability for any workload. The DB Console gives operators and developers access to important cluster data including Metrics, Databases, Sessions (new in CockroachDB 20.2), Transactions (new in CockroachDB 20.2), Statements, and more.
The purpose of this post is to give you an overview of several key ways you can monitor CockroachDB, and provide you with a place to learn more.
Why do operators use the DB Console?
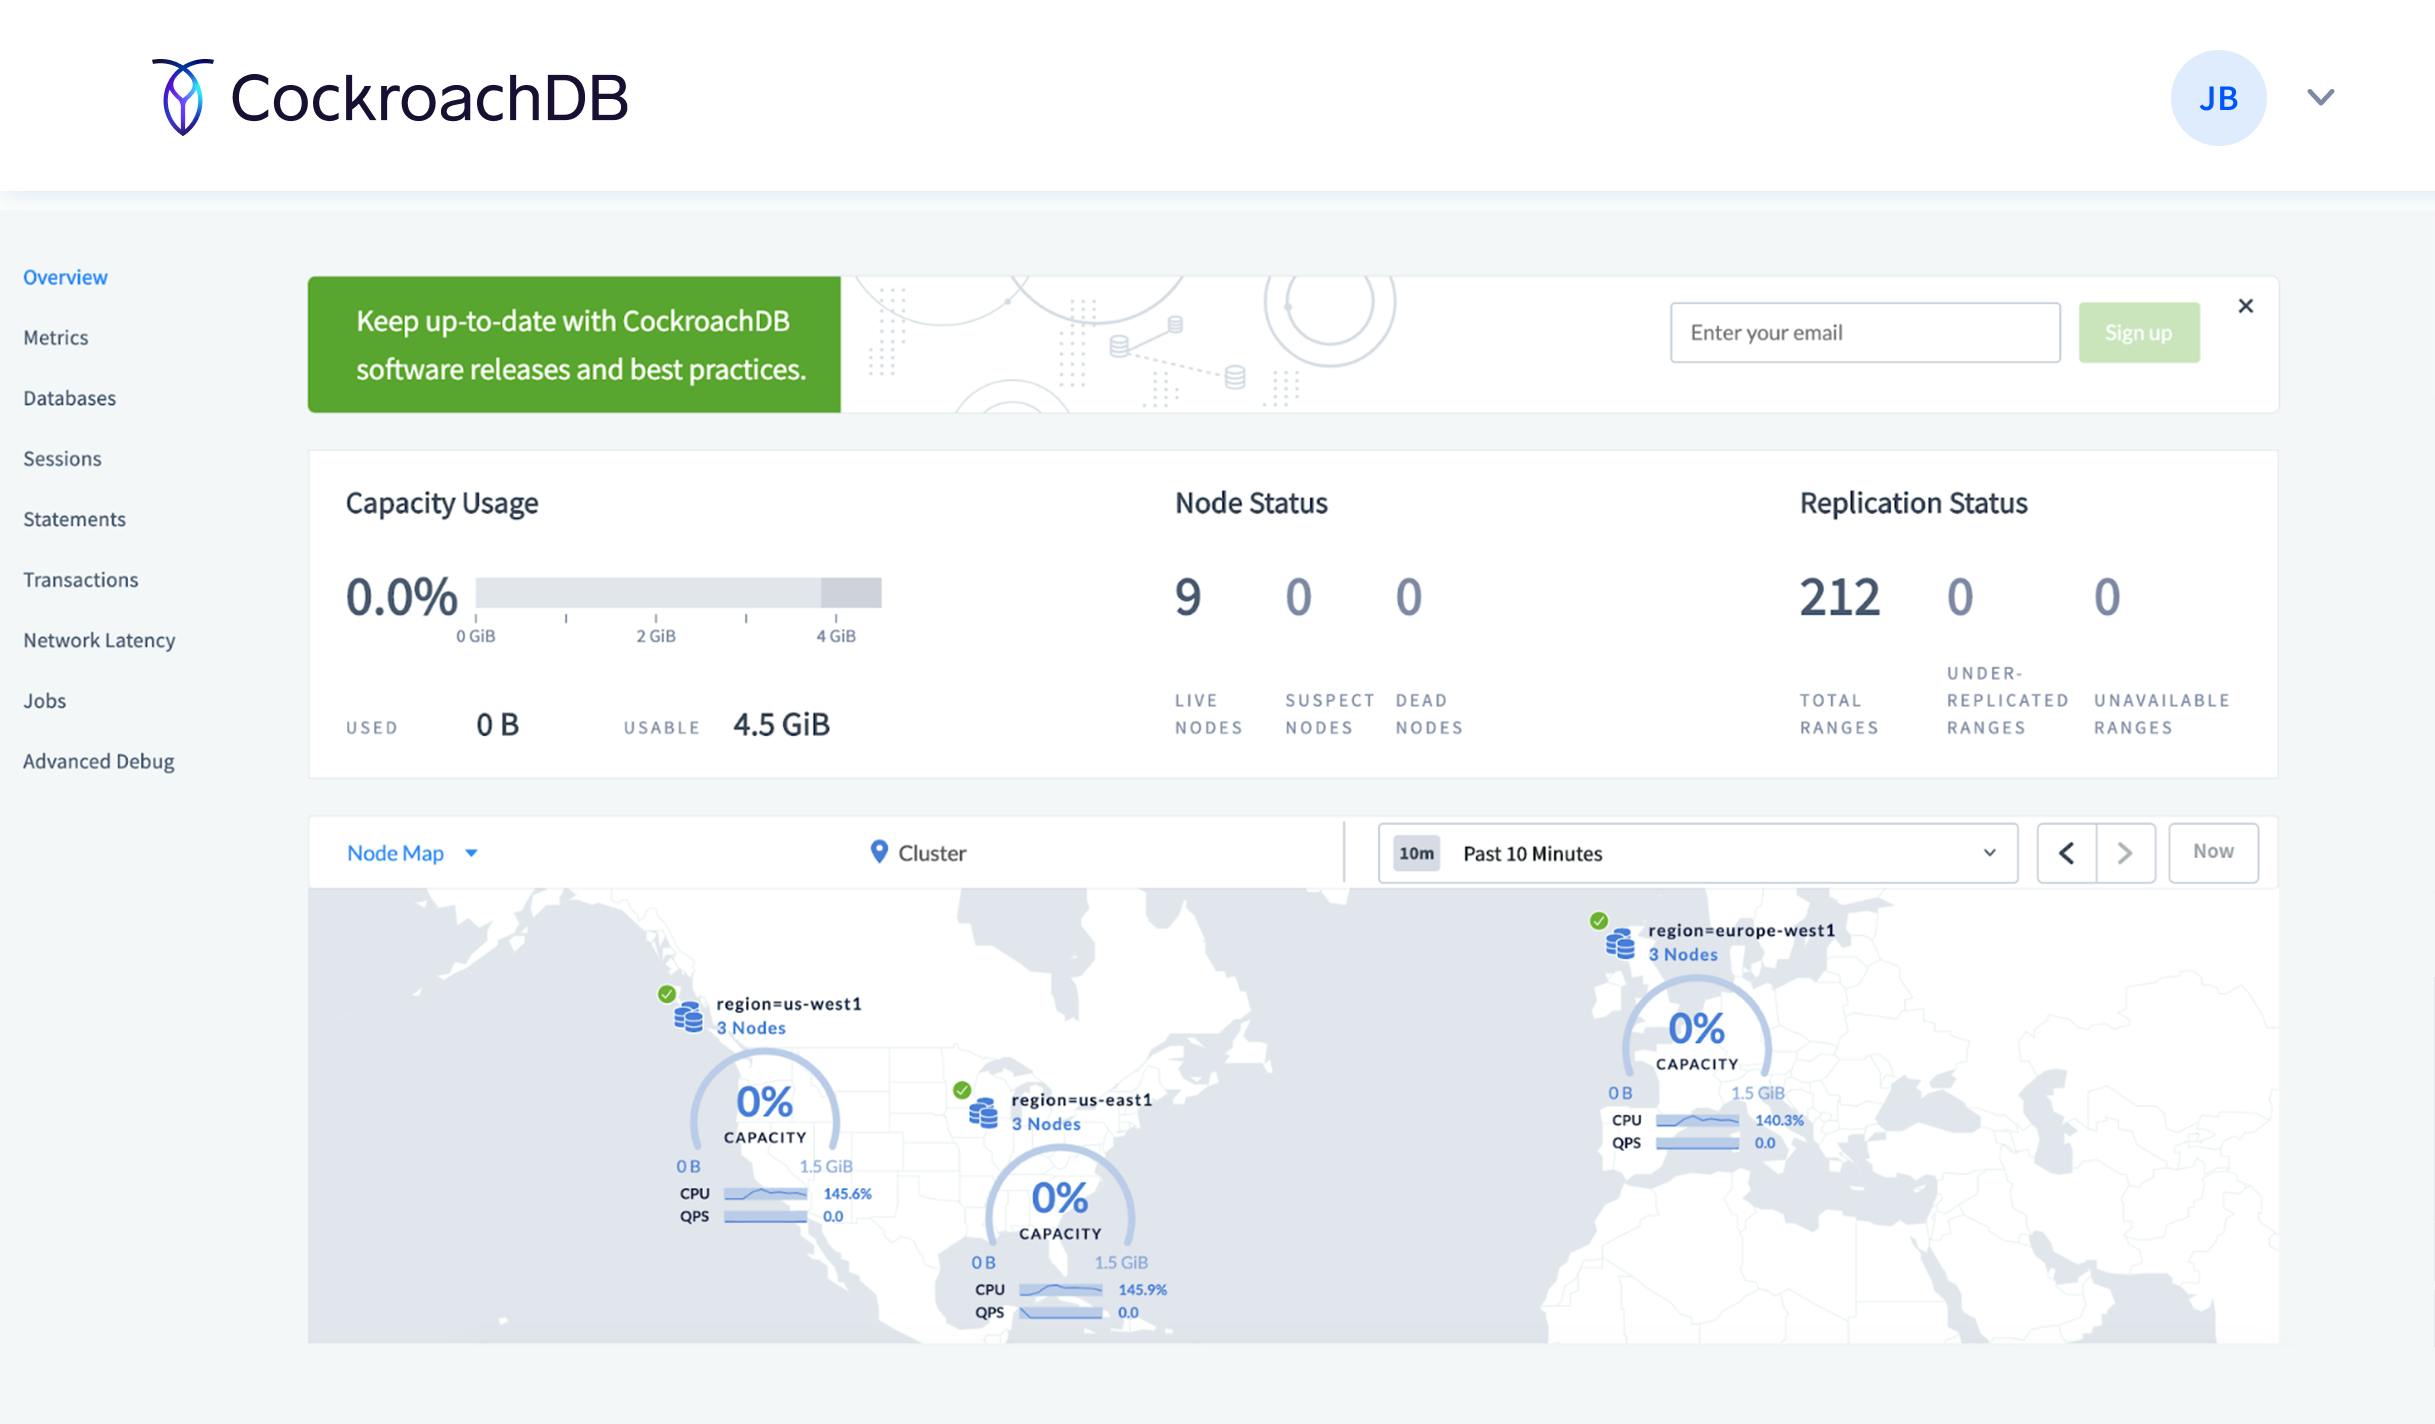
If you’re an operator, you know that it’s not a matter of if things will go wrong with your environment, but when. We arm operators with access to critical cluster health information by evaluating node status (e.g., live, suspect, and dead nodes), replication health, as well as assess key metrics like CPU, memory, and disk usage. This allows you to prevent problems before they happen or quickly discover the root cause during an emergency.
Why do developers use the DB Console?
If you’re a developer, you know that change is the only constant for production workloads. New business requirements lead to schema migrations and new transactions with new performance goals. CockroachDB already provides zero downtime migrations to minimize the impact of modern development. The DB Console now provides you with a way to observe your workloads and the sessions, transactions, and statements that comprise them. Iterating is a way of life for developers, CockroachDB now provides a tool that makes it easy to assess how changes to schema and query design impact the workload.
Let’s dive a bit deeper into how developers can use the DB Console.
Sessions Page
If you notice throughput has dropped or CPU usage is approaching 100%, you might suspect an errant statement is running loose somewhere in your database. You need to be able to find it and cancel it as quickly as possible. The Sessions page, introduced in CockroachDB 20.2, provides you with live access to all sessions (i.e., connections) and in-progress transactions and statements.
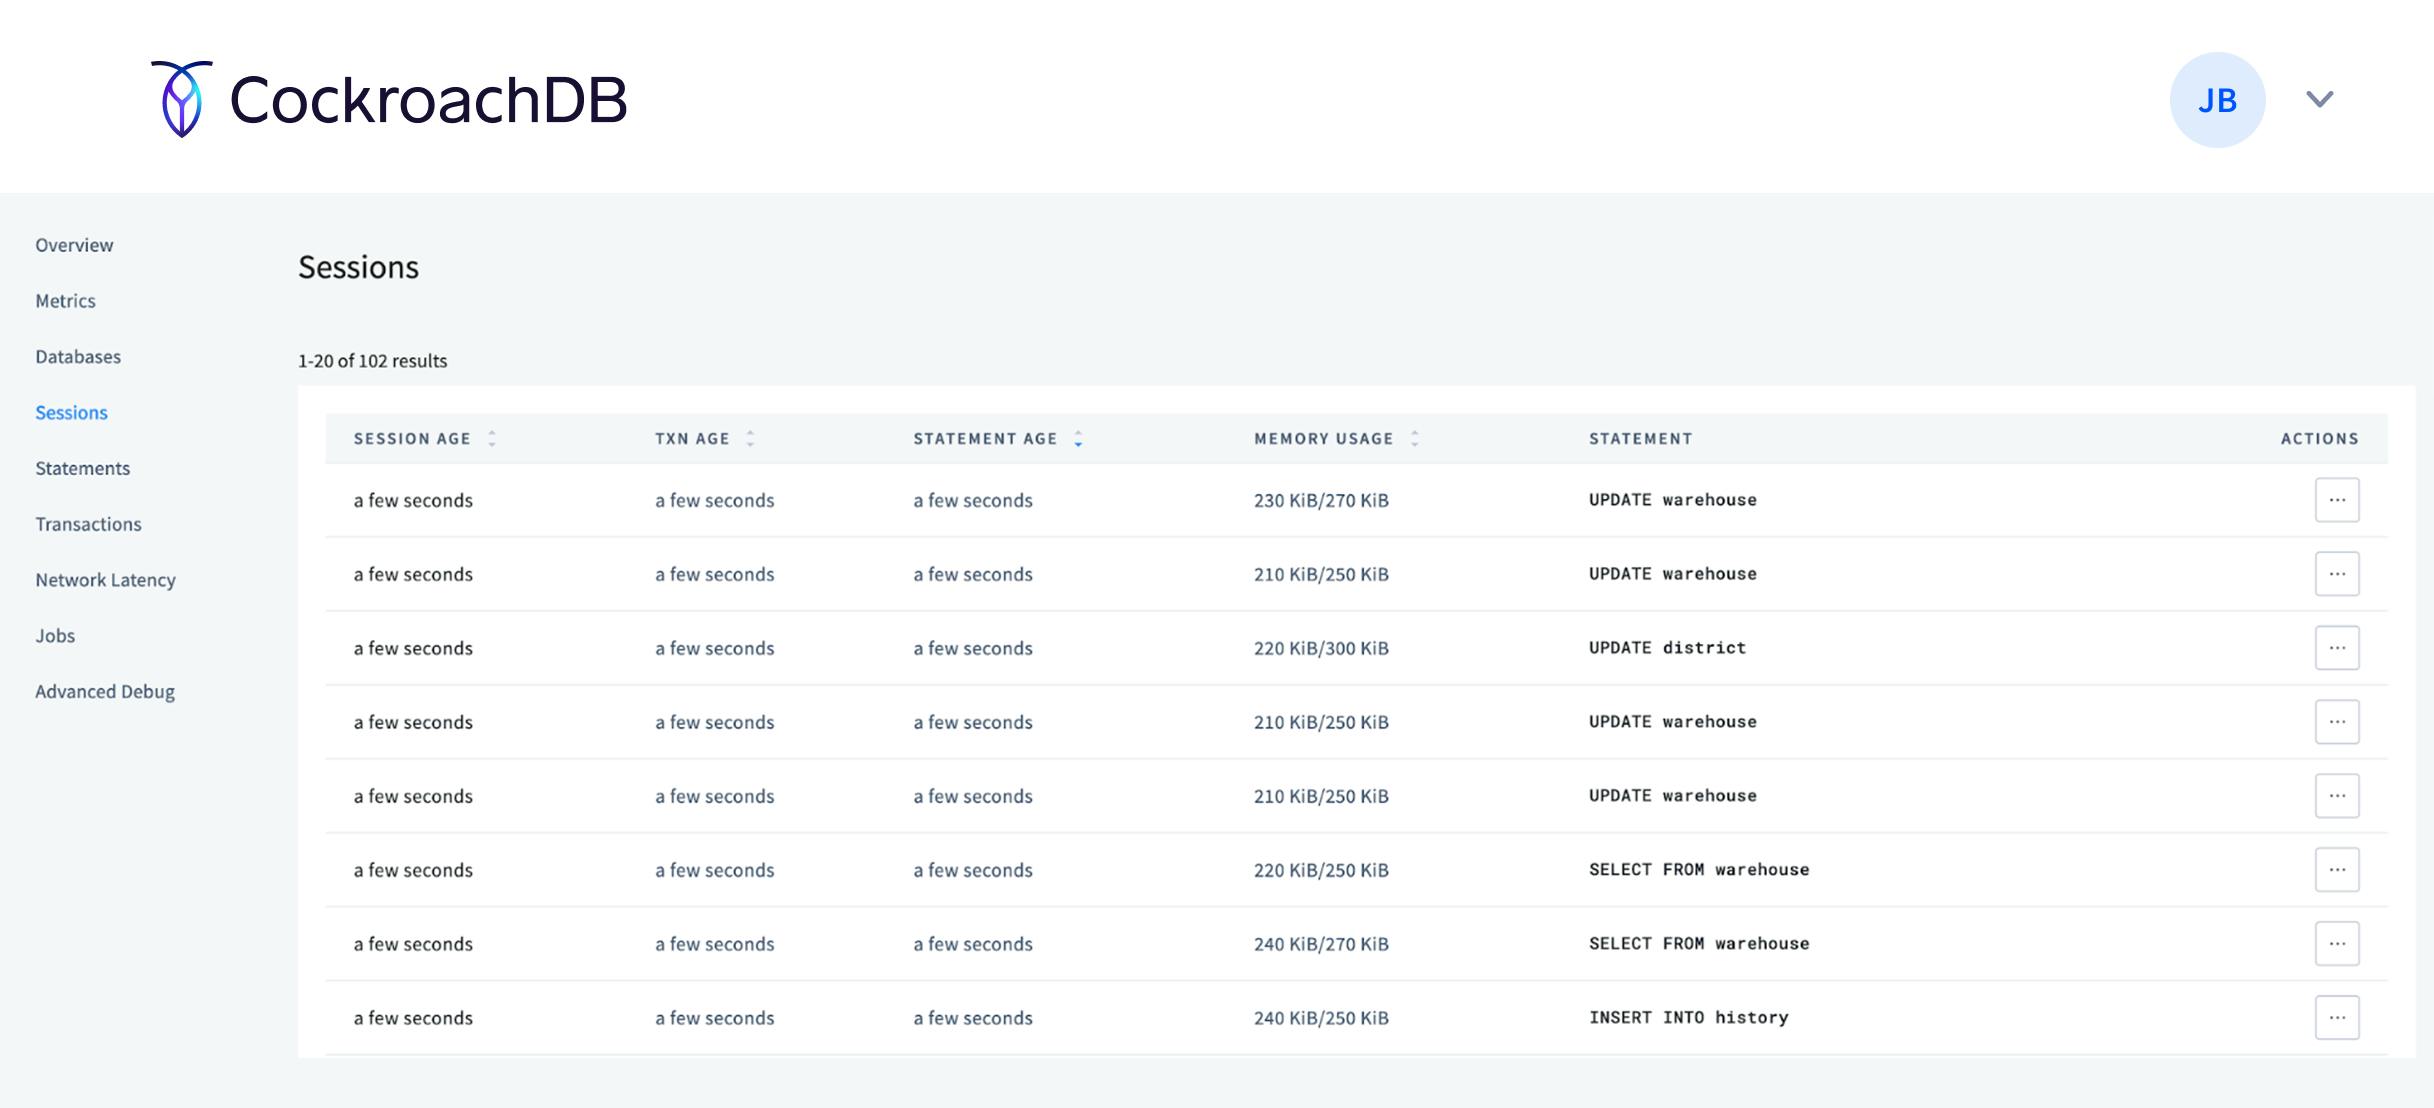
You can sort by session age, transaction age, statement age, or memory usage to find any problematic active sessions. More importantly, CockroachDB now allows you to cancel problematic sessions and queries:

You can click into any given session to learn more about the number of statements executed or retried, as well as learn about memory usage.
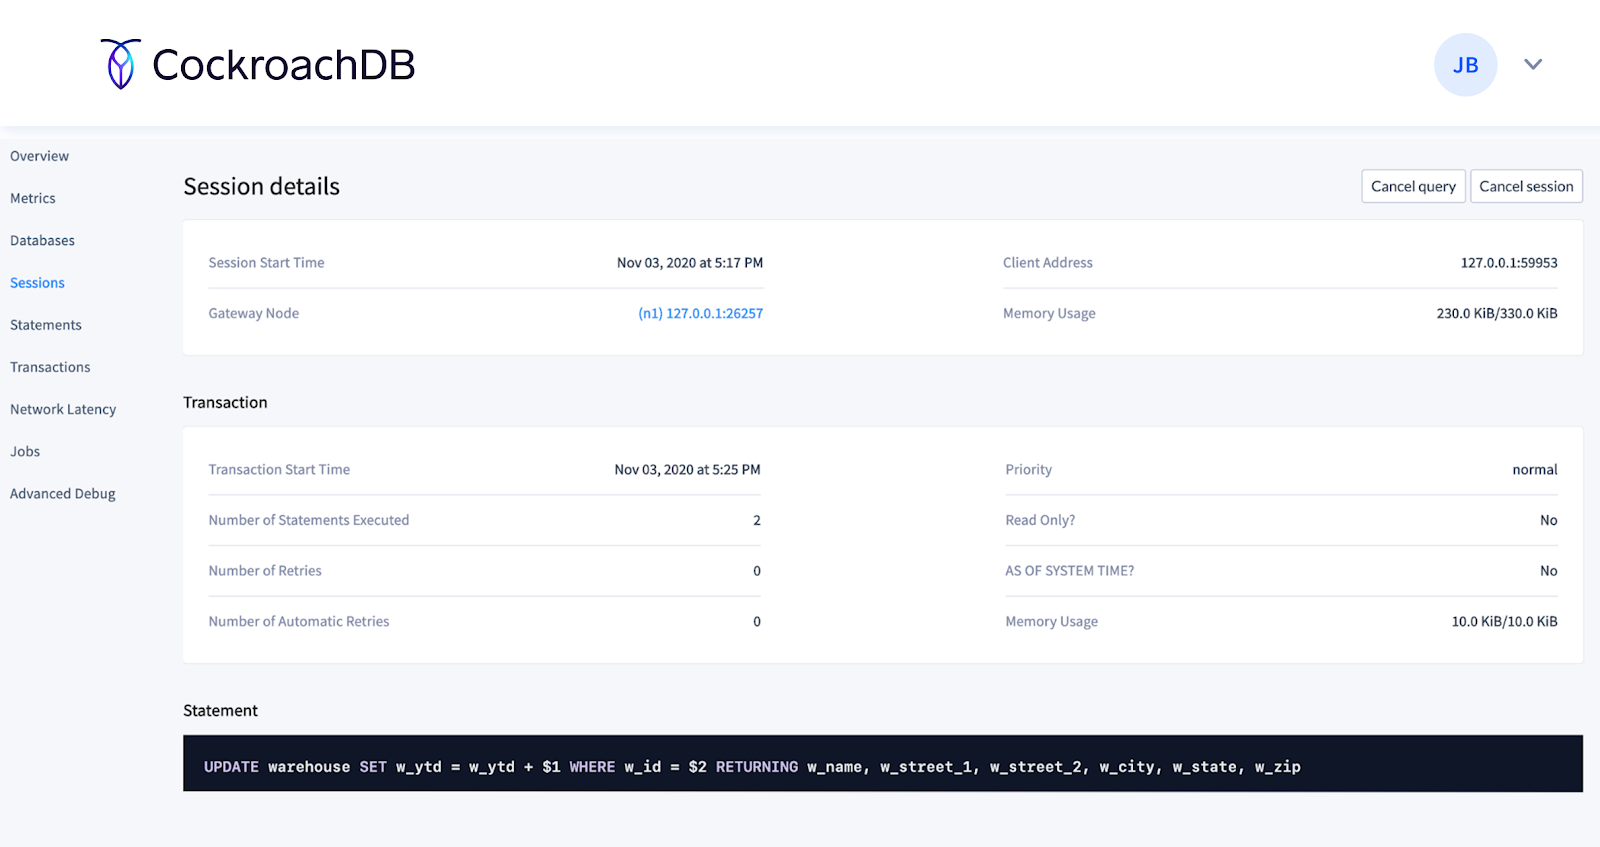
Now with CockroachDB 20.2, developers have the flexibility to find and cancel sessions. Learn more about the sessions page via our documentation.
Transactions Page
It’s not always easy to understand the transactions that a complex, dynamic workload performs. Understanding which statements and tables make up each transaction, as well as the transaction’s end-to-end latency, are critical inputs into understanding and managing workload throughput and end-user latency. CockroachDB 20.2 adds visibility into transaction fingerprints on the new transactions page in the DB Console. Like the statements page introduced in previous versions, the transactions page shows historical information about already executed transactions and statements.
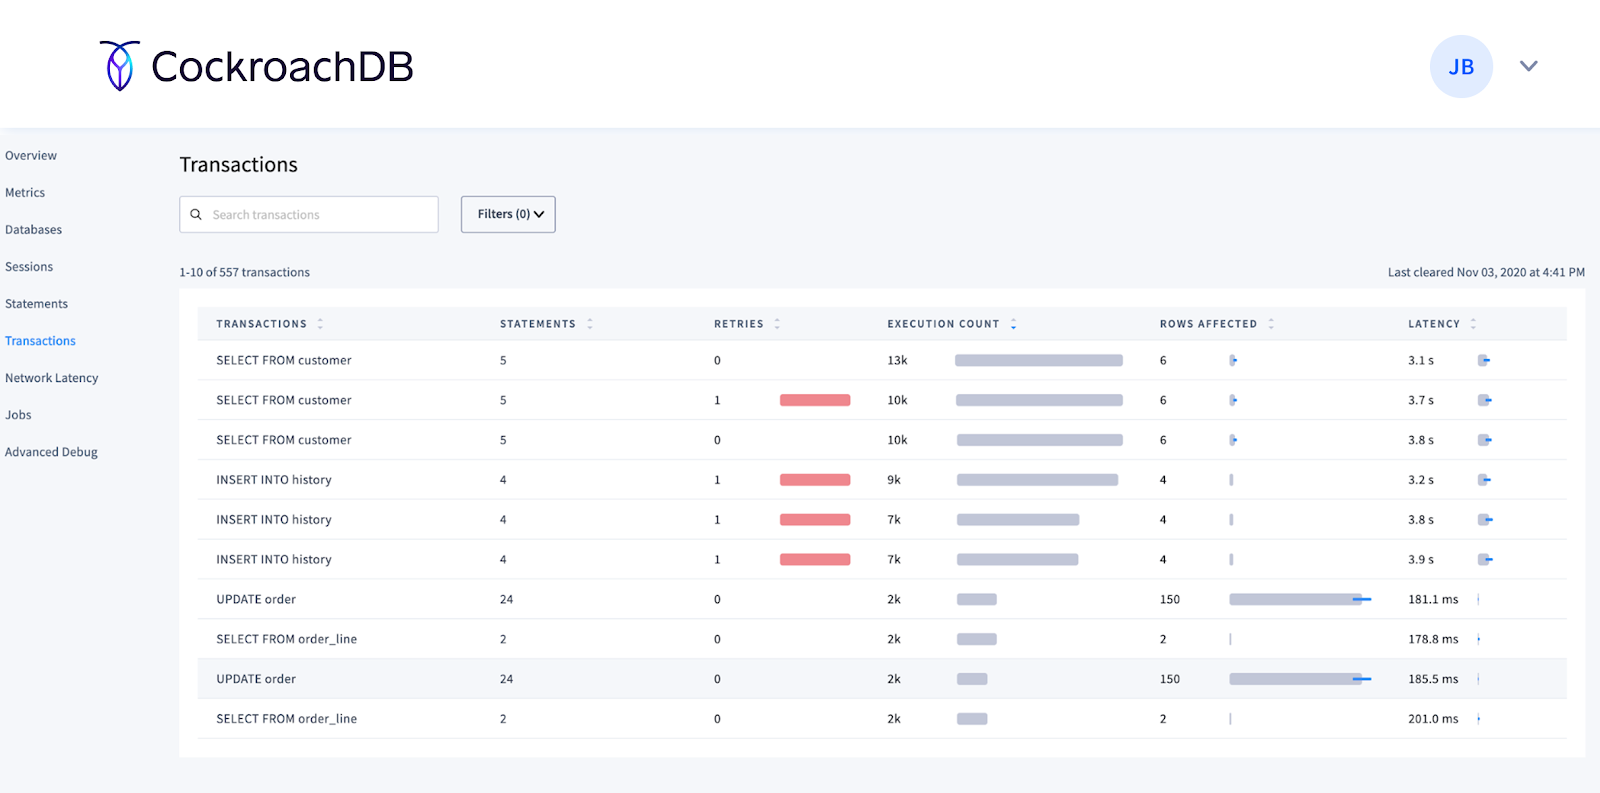
However, unlike with the statements page, you can now see all of the statement fingerprints that comprise a specific transaction:
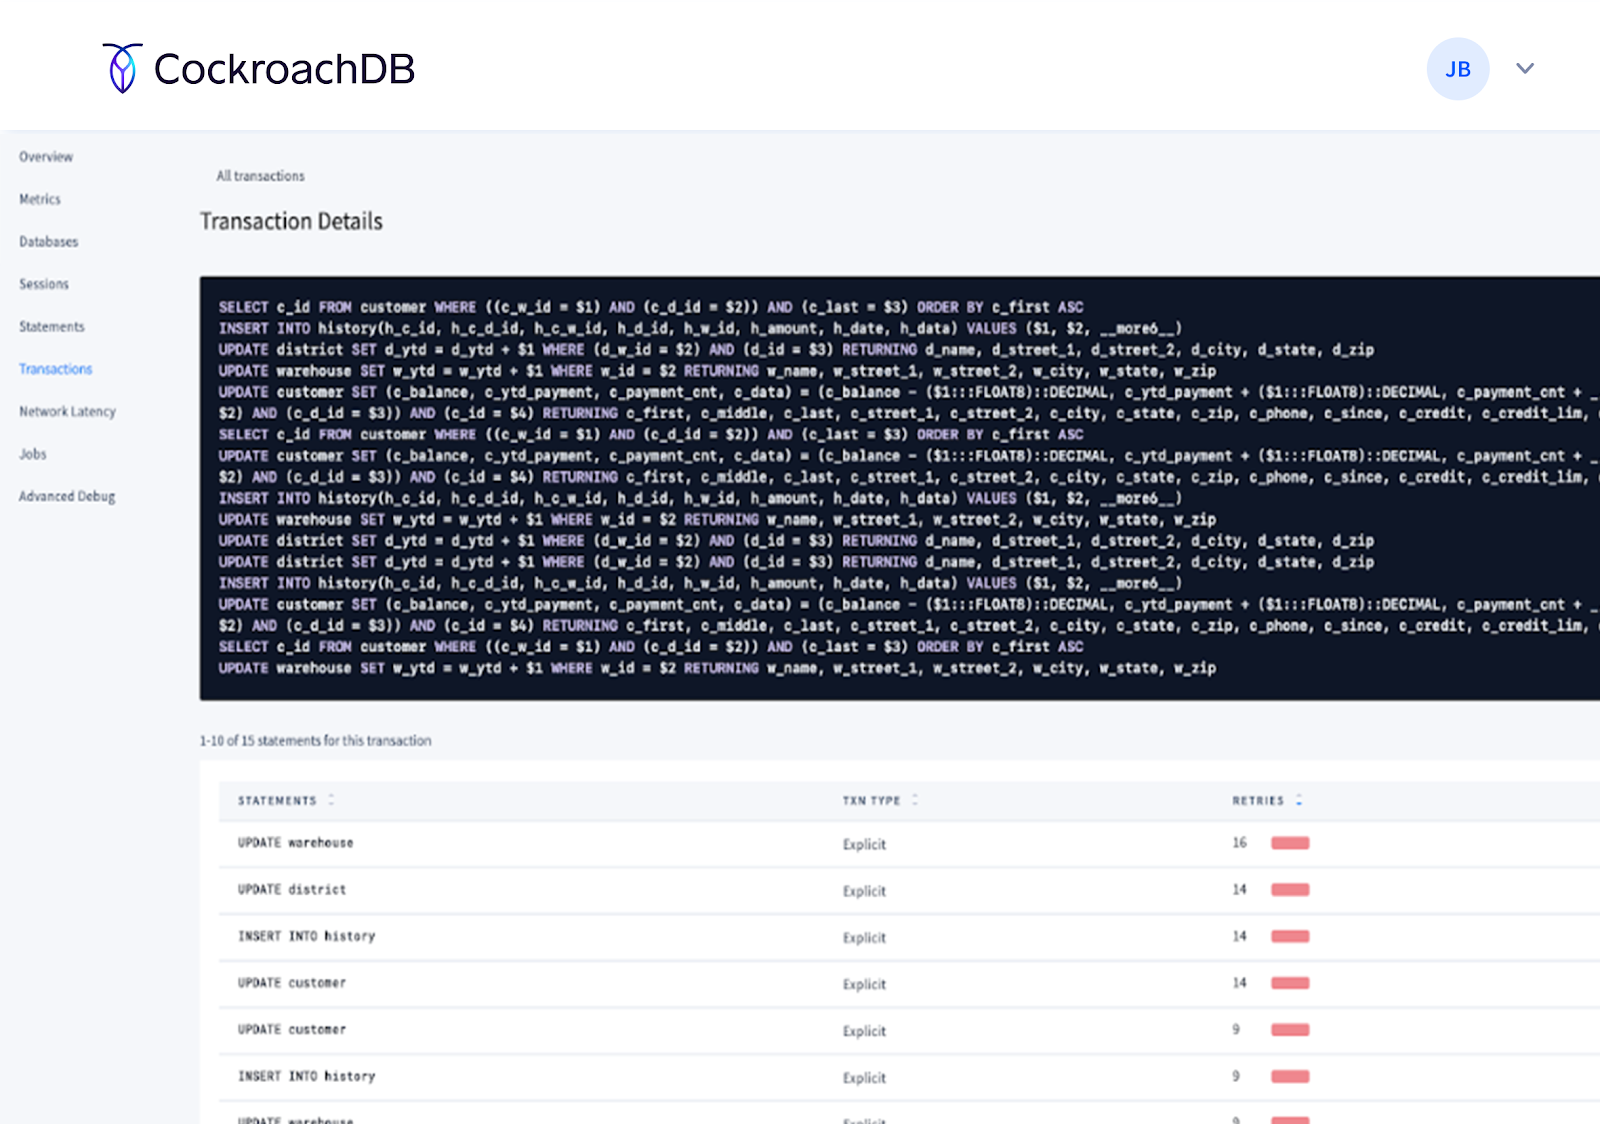
You can even drill down into the statements detail pages to learn more about that fingerprint.
Learn more about the transactions page via our documentation.
Prefer to use the SQL shell? No problem!
We use SQL to power the sessions, transactions, and statements pages in the DB Console. If you’d rather access this information directly, you can use the following tables:
For example, here’s an example of a statement aggregation from the crdb_internal.node_statement_statistics virtual table:
root@127.0.0.1:26257/movr> select * from crdb_internal.node_statement_statistics limit 1;
-[ RECORD 1 ]
node_id             | 1
application_name    | $ cockroach demo
flags               |
key                 | ALTER TABLE rides ADD FOREIGN KEY (city, rider_id) REFERENCES users (city, id)
anonymized          | ALTER TABLE _ ADD FOREIGN KEY (_, _) REFERENCES _ (_, _)
count               | 1
first_attempt_count | 1
max_retries         | 0
last_error          | NULL
rows_avg            | 0
rows_var            | NaN
parse_lat_avg       | 2.1e-05
parse_lat_var       | NaN
plan_lat_avg        | 0.000362
plan_lat_var        | NaN
run_lat_avg         | 0.002501
run_lat_var         | NaN
service_lat_avg     | 0.002923
service_lat_var     | NaN
overhead_lat_avg    | 3.899999999999954e-05
overhead_lat_var    | NaN
bytes_read_avg      | 0
bytes_read_var      | NaN
rows_read_avg       | 0
rows_read_var       | NaN
implicit_txn        | true
Time: 1ms total (execution 0ms / network 0ms)
You can also review in-progress sessions, transactions, and statements via the following SQL SHOW commands:
SHOW SESSIONS;SHOW TRANSACTIONS;SHOW QUERIES;
Try out the DB Console with CockroachDB and CockroachDB Dedicated
Whether you’re a developer focused on using the database to iterate upon your application or an operator focused on keeping the entire cluster happy, CockroachDB 20.2 has the tools you need to observe and troubleshoot any problem. You can get started today with a free trial of CockroachDB Dedicated.
Is there an observability feature that you wish we supported? We’d love to hear what it is. Drop us a line in the #product-feedback channel of our community Slack group.