Identifying transaction bottlenecks or getting an audit trail of user actions in the database can be challenging without self-service observability. Often, the only way to access cluster logs is to request them from technical support, which is painfully inefficient. If a particular set of SQL queries from an application is taking more time to execute than anticipated, not having timely access to logs to help troubleshoot slow query performance could mean end users suffering an inferior experience for longer than desired and the application team not being able to adhere to their SLA / SLO. And if the InfoSec team needs real-time information to identify which users are accessing confidential data fields in tables with sensitive data, going through the support team can hamper appropriate auditability.
CockroachDB now makes it possible to export your CockroachDB Dedicated logs to your AWS Cloudwatch or GCP Cloud Logging instances. You can collect and visualize cluster logs directly in those cloud-native services, and from there optionally send them to other third-party Observability platforms for centralized monitoring. You can do all this on your own. No technical support required.
Why should you be using cluster log export?
Most application teams across various companies need to evaluate and vet external service providers according to their internal Infosec, Risk, and Architecture teams’ governance policies and standards. These assessments generally look for two themes: Manageability - how seamless it is to onboard multiple users and provide self-service capabilities to observe what’s happening - and Security - what guardrails exist in a service to secure and protect customer data.
When it comes to customers evaluating CockroachDB Dedicated, it’s important to ask these questions:
Will our teams be able to monitor the clusters in order to understand and tune our query performance?
Is there a way to audit who is running what queries on tables with sensitive data using our own security information and event management (SIEM) tool?
Can we monitor operational events that are either initiated by users or by CockroachDB processes to track general cluster health?
Can we access logs through CockroachDB’s console interfaces, or can we visualize them in our cloud-native log services or another centralized observability tool?
Will the cluster logs be available as a stream for continuous monitoring or would we have to rely on a batch export mechanism?
Cluster log export has been designed to address all of the above requirements.
How does cluster log export work?
Once log export is configured, CockroachDB Dedicated can access your cloud-native log service instance (AWS Cloudwatch or GCP Cloud Logging) using a cross-tenant IAM role or service account (managed by you in AWS or GCP), and then send cluster logs, including any configured SQL audit logs, to your log service.

If you already use a customer-managed encryption key (CMEK) to encrypt your cluster data, the API to enable the cluster log export should feel familiar. Basically you need to configure a specific log group in your cloud-native log service, create an IAM role with permissions to write logs to that log group, and then provide the log group & AWS IAM role / GCP project id as references to the cluster log export API. CockroachDB Dedicated will then start streaming logs in real-time to the configured log group.
To stream the SQL audit logs in addition to the core logs, you should configure those per table using the `ALTER TABLE … EXPERIMENTAL_AUDIT` command that activates the `SENSITIVE_ACCESS` logging channel (which is part of the broader Security and Audit monitoring use case).
The logs are marked as `redactable` by default, which places redaction markers around the sensitive data. Once the logs have been streamed to your cloud-native log service, such data can be optionally redacted before being sent to another log group or a centralized observability service.
There may be cases where you want to consume the logs using a third-party centralized observability service instead of the cloud-native one. That’s possible using the connectors and APIs provided by those observability service providers. Basically the logs can be streamed to the third-party services using events from when they land in the customer’s cloud-native log service instance.
How does CockroachDB Dedicated access AWS or GCP’s log service?
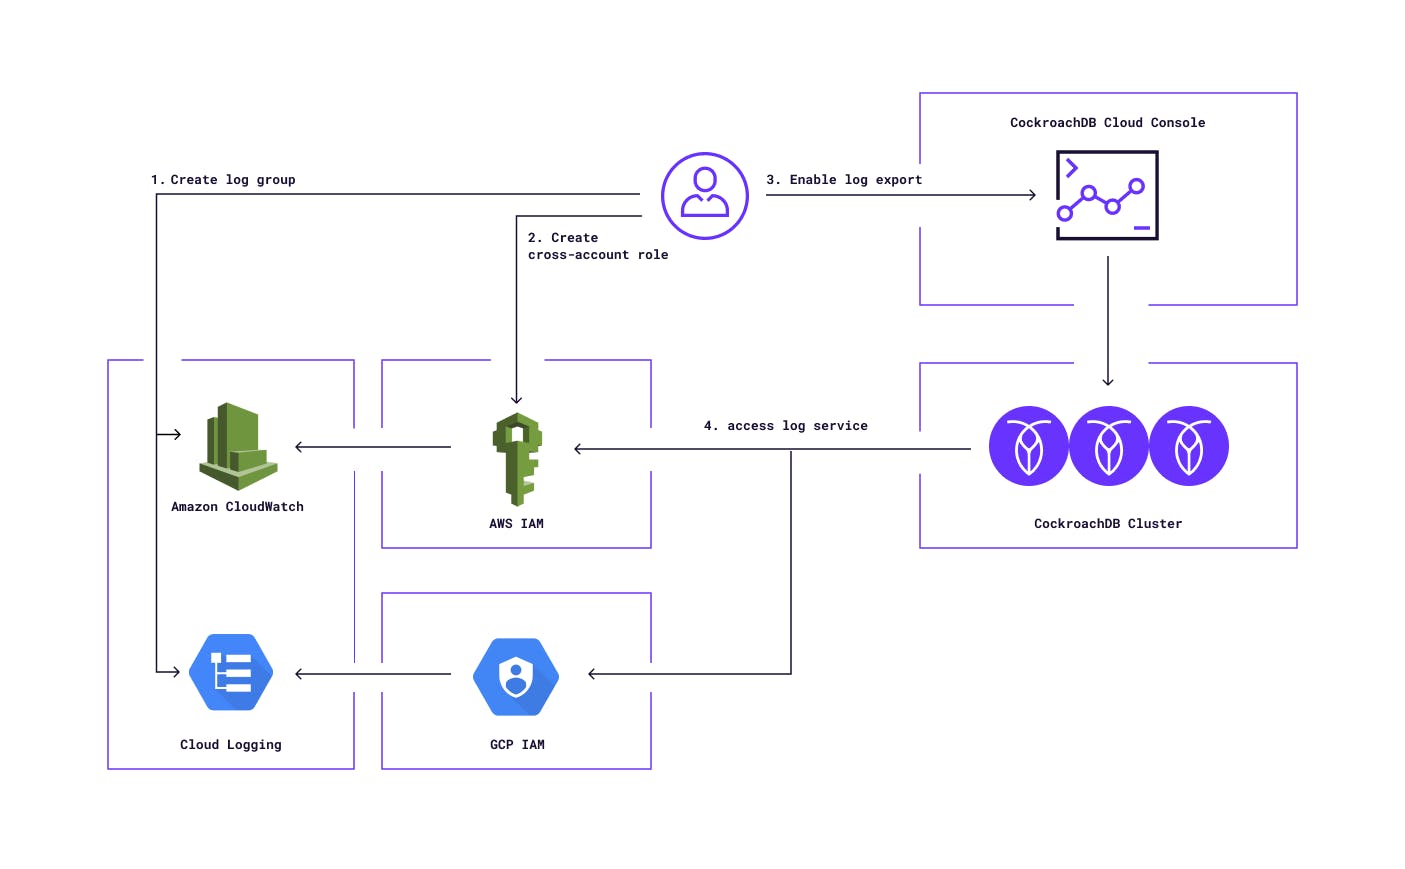
In AWS, we use a customer-managed cross-account IAM role to access the customer’s Cloudwatch instance. The customer provides the write permissions on a Cloudwatch log group to an IAM role in their AWS account, and configures a trust relationship with the AWS account of their CockroachDB Dedicated cluster to assume the above IAM role. In addition, we also ask the customers to configure their CockroachDB Cloud Organization Id as the External Id in the cross-account trust relationship to address the confused deputy problem.
In GCP, we use a customer-managed custom IAM role to access the customer’s Cloud Logging instance. The customer provides the write permissions on Cloud Logging to a custom IAM role in their GCP project, and then grants that custom role to the service account of their CockroachDB Dedicated cluster.
How to get started?
If you don’t have a CockroachDB Dedicated cluster yet, get started by creating one by following these instructions. Once the cluster is set up, use this tutorial to enable log export for your cluster. All you need is access to your cloud-native log service and a cross-tenant IAM role in your cloud account.