56 instances.
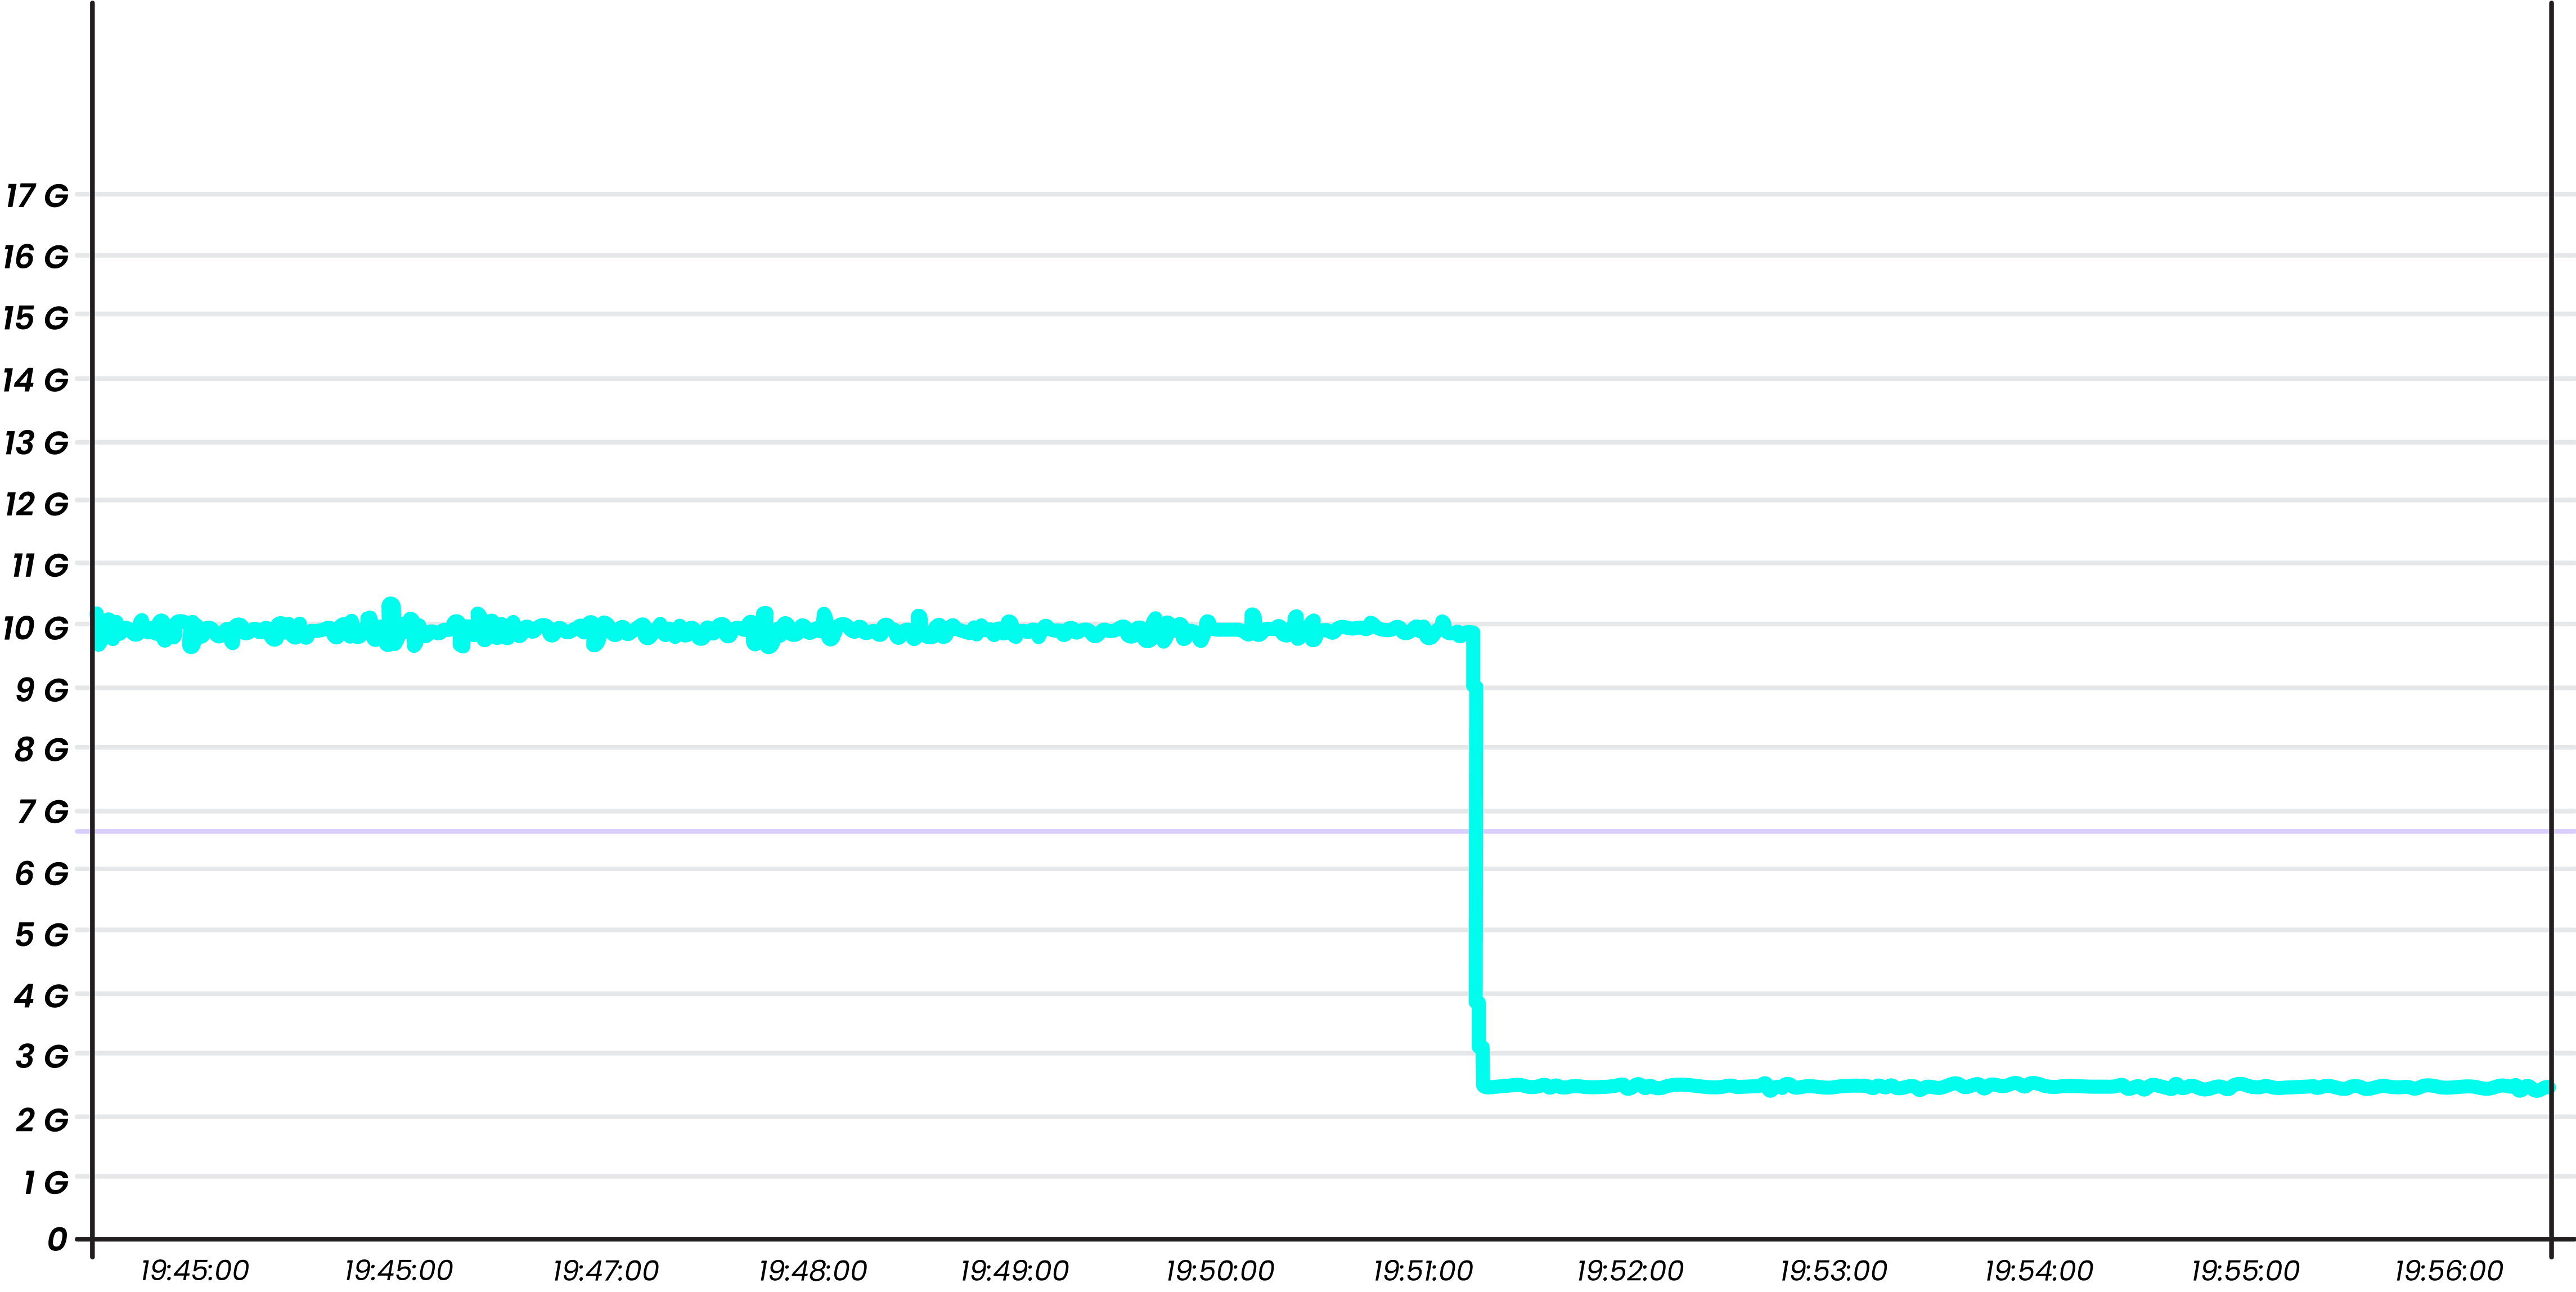
3000+ benchmark runs.
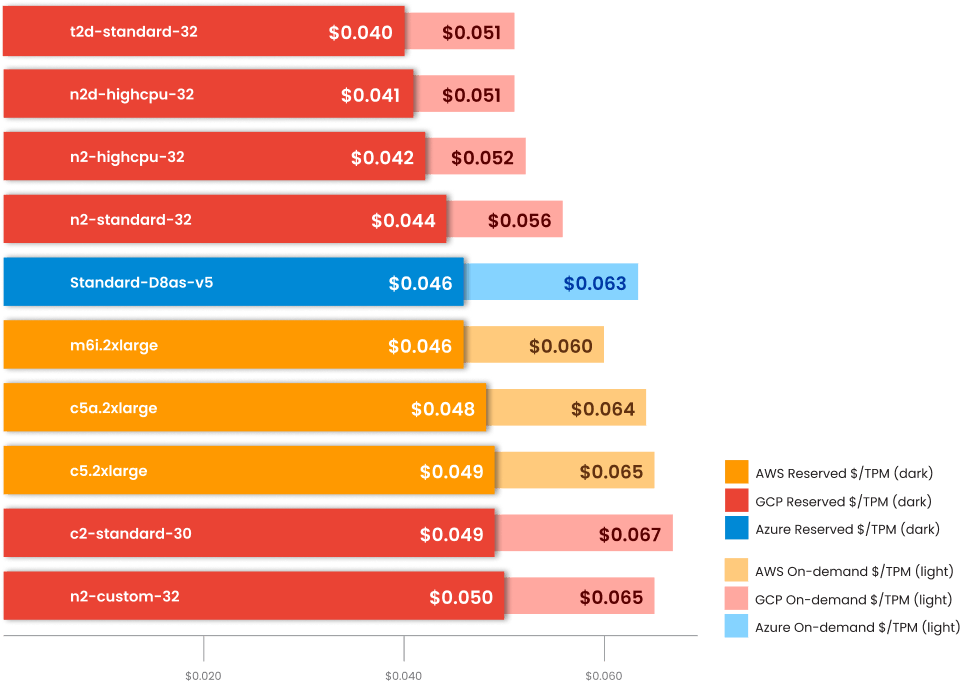
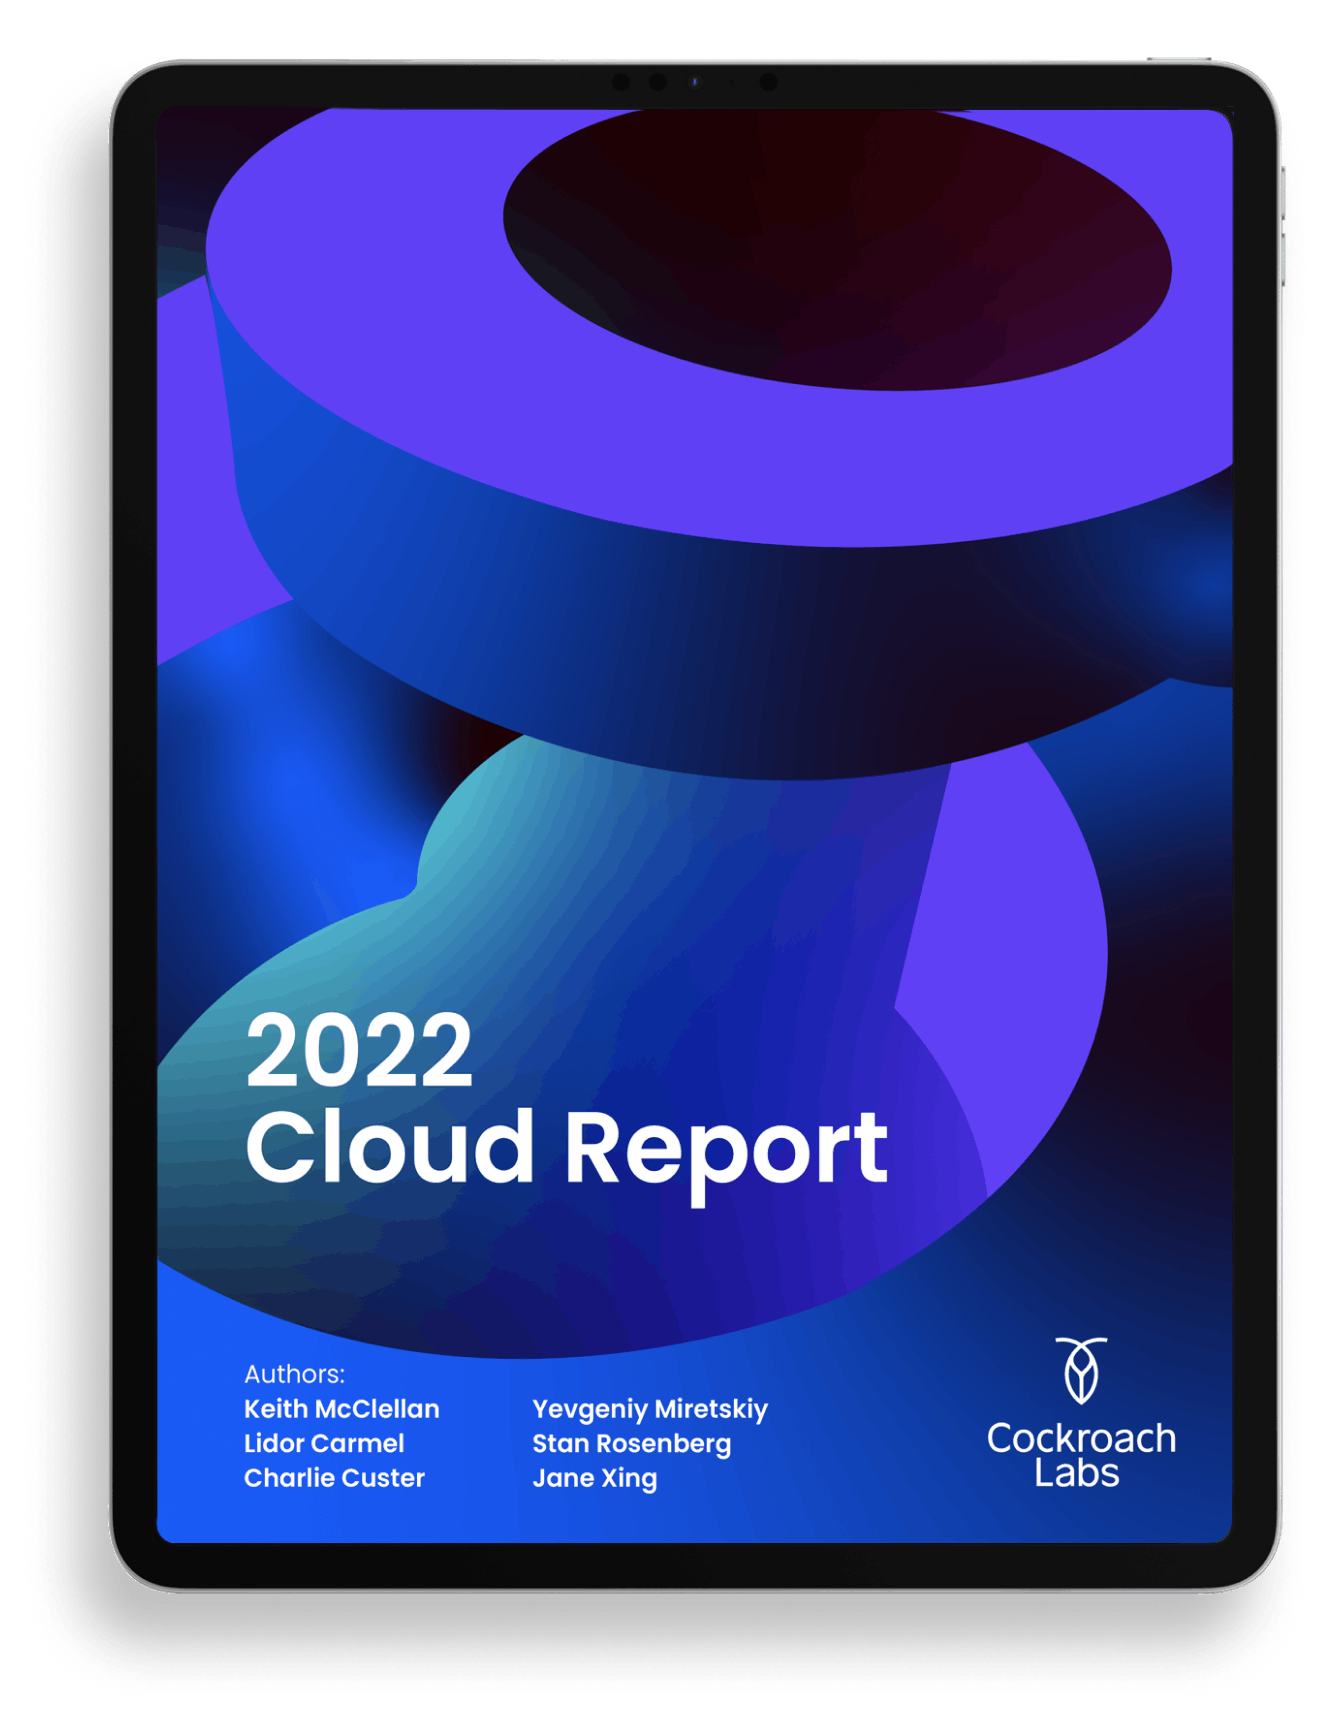
One unbiased report.
Cockroach Labs’ 2022 Cloud Report offers an unbiased analysis of a variety of instance types across the three most popular public clouds to help you find the best options for your workloads.
Download the 2022 Cloud Report