
In my technical journey, I struggled to find a simple tool that gave me the flexibility to collect and deliver data to other monitoring tools. Until, one day, I found it.
…
In 2007 I was entrusted to design a script that would mitigate monetary losses for the company, despite my not having any experience designing monitoring and alerting tools (at the time). For days I struggled to create the logic with Bash scripts and CSV files for what was to become a paging alert system for Solaris (which executes critical C based code for our customers).
The task of collecting log data keywords, fetching metrics such as CPU, disk size, number of running processes, etc., was quite overwhelming! Also at that point, there were not many robust tool options in the market. The few that existed were unattainable due to many factors including company policies, pricing, multi-alert tools requirements, and complexity.
DevOps, SREs, and DBAs know this pain.
The miracle tool
Fast forward a few years, to my days at Datadog as a Solutions Engineer, where I came across a recently acquired versatile tool called Vector, that some Datadog customers started to adopt. The tool seemed to have all of the characteristics of the miracle tool: open source, flexible, configurable, un-intrusive, and can deliver data just about anywhere.
During conversations with former colleagues and customers, they stressed the need for a flexible data collector that could deliver filtered, sanitized, and custom data sets to multiple monitoring tools. Now, a few months later at Cockroach Labs, I learned that Datadog can be natively integrated to monitor the self-hosted and dedicated distributed database cluster.
Why choose Vector?
So, why Vector by Datadog and not the Datadog/Splunk/Dynatrace/New Relic/Elastic/other agent? One potential caveat with multi-agent collectors is that each agent is designed to take full control of a log, causing the second agent to fight for resources on the same file if the requirement is to send the log to multiple providers (ex. Splunk, Datadog, and ElasticSearch).
Vector had matured at Datadog, and I saw a good fit between Vector and CockroachDB for a use case that many users have asked for in the past: Delivery of data to multi-points from self-managed systems and control over the data collected.
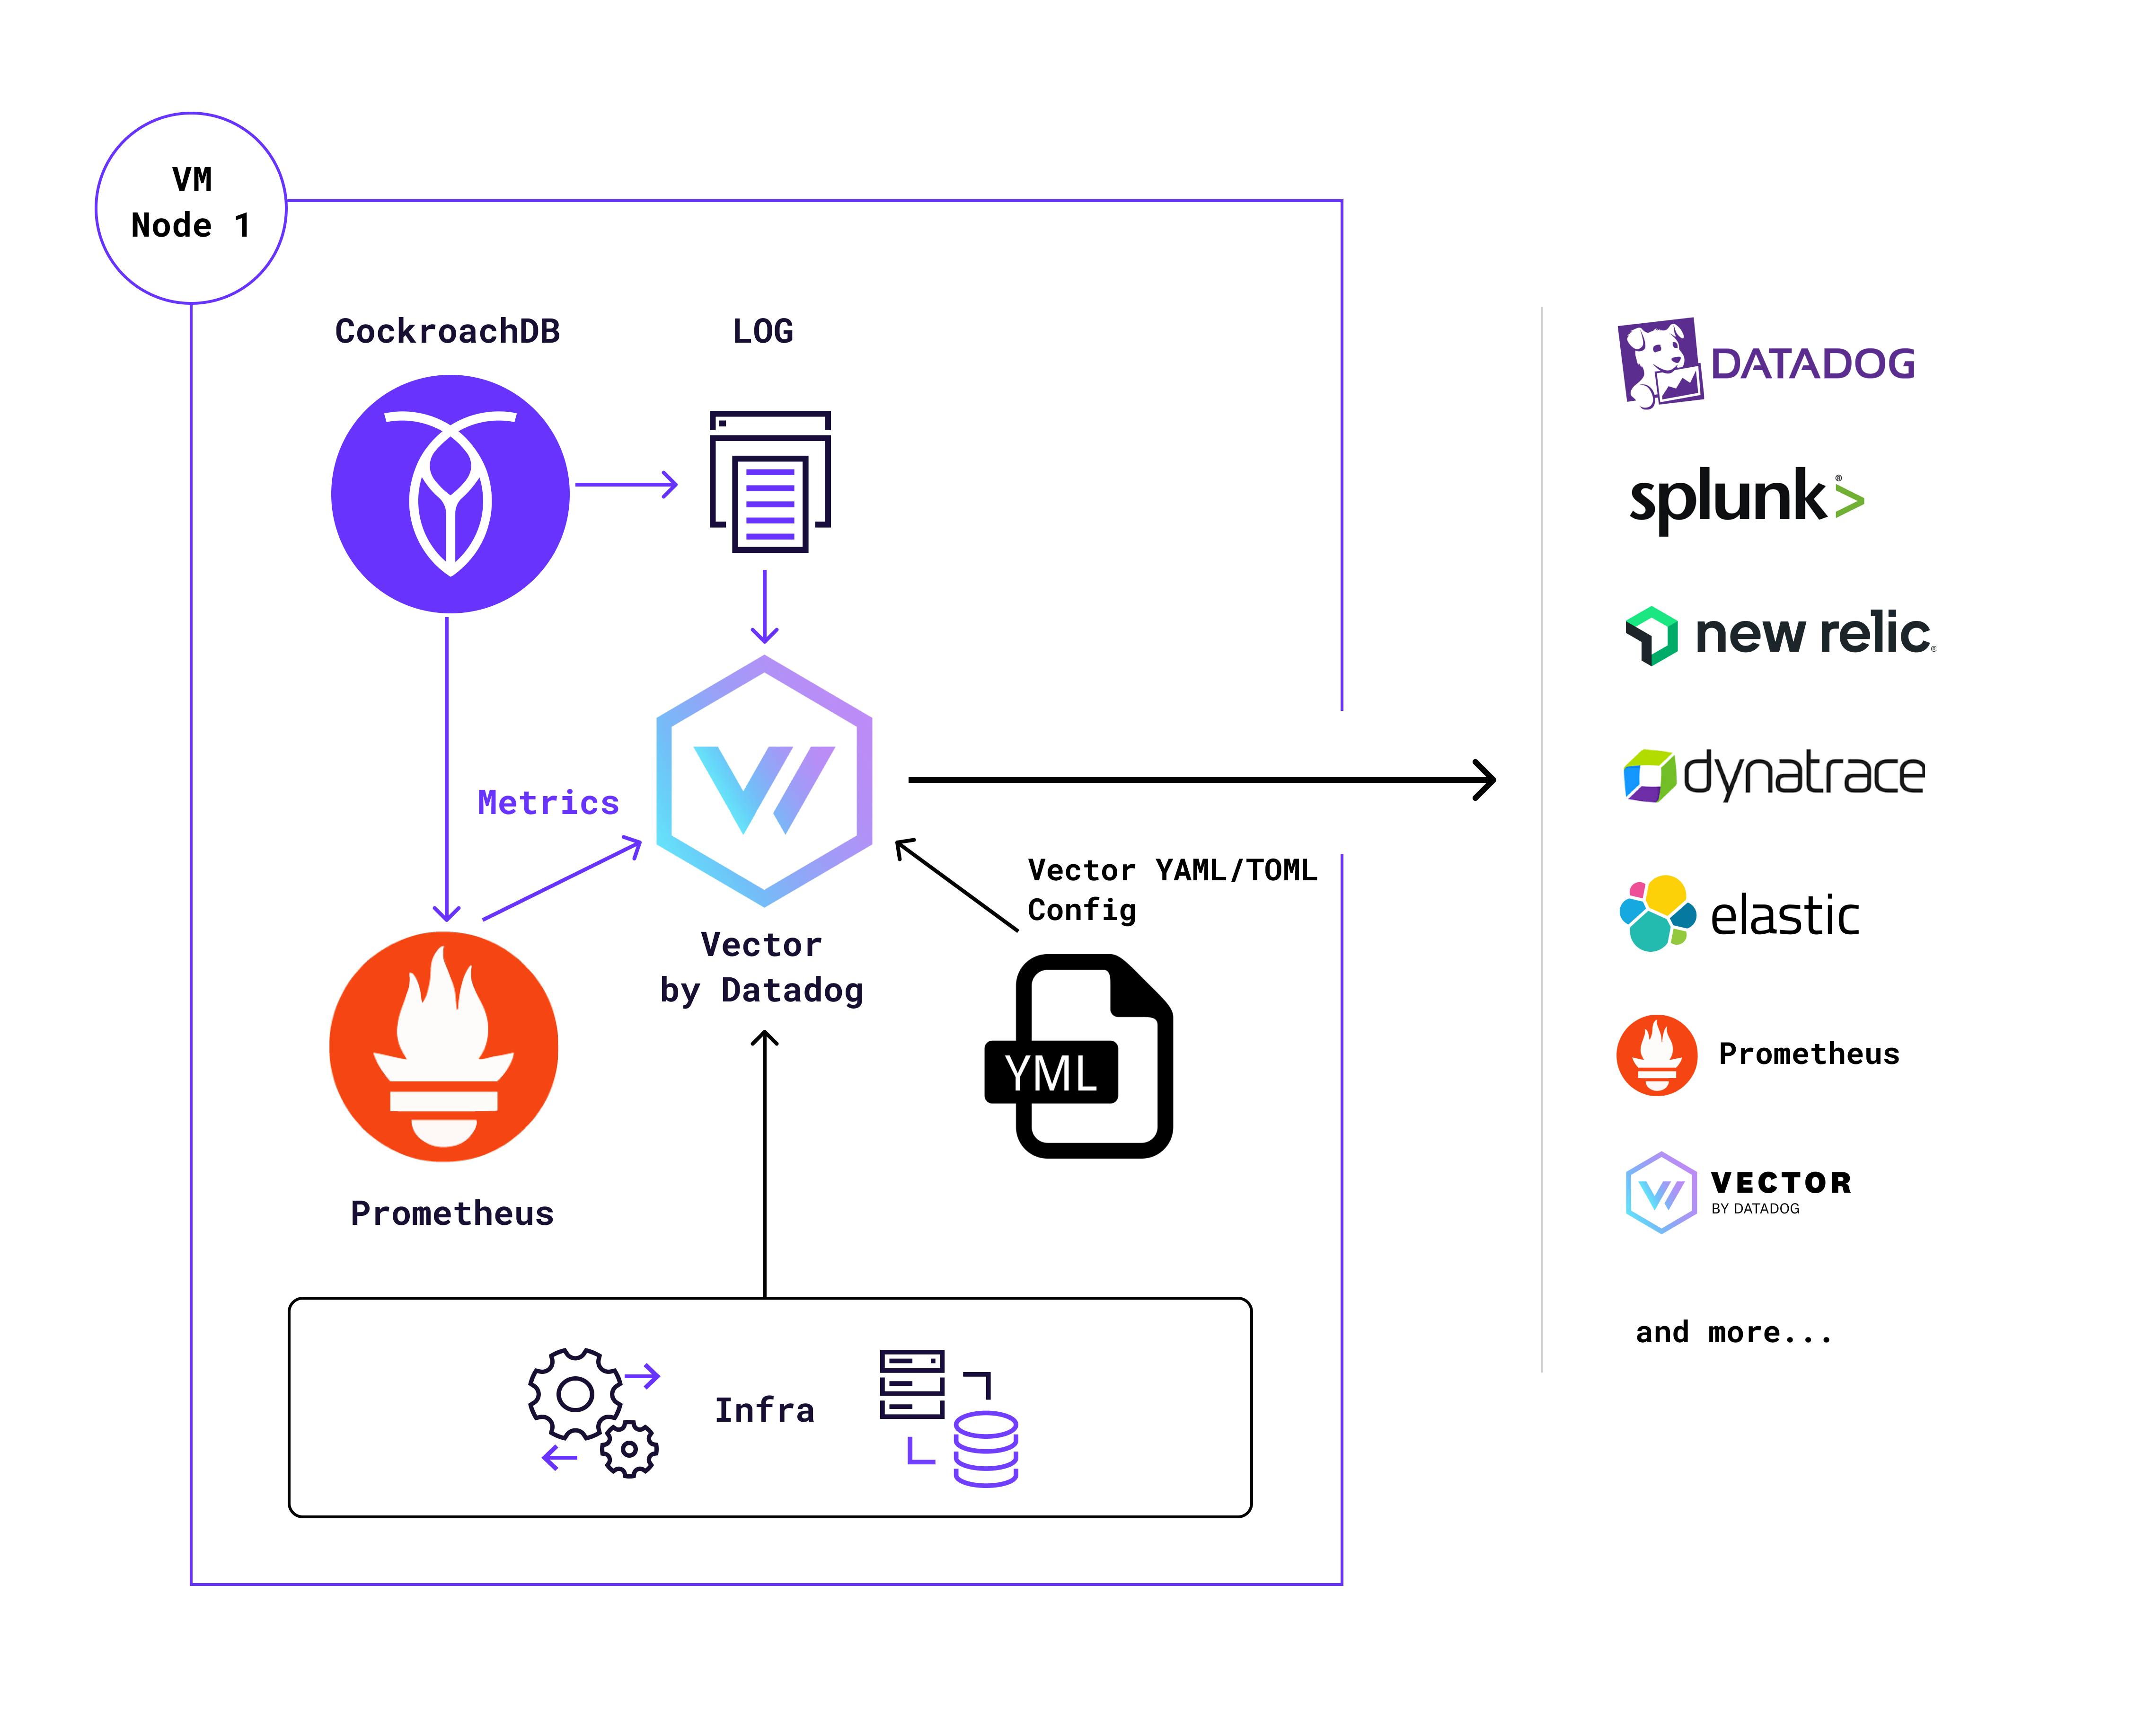
Vector uses “Sources” to collect data, “Transforms” to cleanse/filter/customize data, and “Sinks” to deliver data.
The steps to achieve a quick installation are not difficult if we’re willing to invest a bit of time on the custom solution. The TOML example provided is for each host but can also be used on Kubernetes deployments.
Get started with Vector and CockroachDB
Step 1: Install Vector
curl -1sLf 'https://repositories.timber.io/public/vector/cfg/setup/bash.deb.sh' | sudo -E bash
sudo apt-get install -y vector
Step 2: Configuration
Configure the Vector TOML/YAML/JSON file: Sources, Transformers, Sinks: see final TOML config file sample in my GitHub repo
Step 3: Collect logs
Collect CockroachDB logs with sources (select the logs you need to collect)
[sources.crdb_logs]
type = "file"
ignore_older_secs = 600
include = ["/mnt/disks/crdb-disk/cockroach-data/logs/cockroach.log", "/mnt/disks/crdb-disk/cockroach-data/logs/cockroach-health.log", "/mnt/disks/crdb-disk/cockroach-data/logs/cockroach-security.log", "/mnt/disks/crdb-disk/cockroach-data/logs/cockroach-sql-audit.log", "/mnt/disks/crdb-disk/cockroach-data/logs/cockroach-sql-auth.log", "/mnt/disks/crdb-disk/cockroach-data/logs/cockroach-sql-exec.log", "/mnt/disks/crdb-disk/cockroach-data/logs/cockroach-sql-slow.log", "/mnt/disks/crdb-disk/cockroach-data/logs/cockroach-sql-schema.log", "/mnt/disks/crdb-disk/cockroach-data/logs/cockroach-pebble.log", "/mnt/disks/crdb-disk/cockroach-data/logs/cockroach-telemetry.log"]
Step 4: Collect data
Collect CockroachDB data from the HTTP endpoint with the Prometheus sources
[sources.crdb_ui_console]
type = "prometheus_scrape"
endpoints = [ "http://localhost:8080/_status/vars" ]
scrape_interval_secs = 15
instance_tag = "instance"
endpoint_tag = "endpoint"
Step 5: Collect server metrics
CPU, Memory, Processes, and more with sources
Step 6: Customize metrics
Customize CockroachDB metrics (ex. CRDB to Splunk) with Transforms
[transforms.crdb_metrics_to_logs_splunk]
type = "metric_to_log"
inputs = [ "crdb_ui_console" ]
host_tag = "hostname"
Step 7: Endpoint alerting tool
Determine the delivery endpoint alerting tool or platforms (many providers have free trials to access their platforms) with sinks (ex. sending data to Splunk and Datadog)
## Splunk
[sinks.logs_to_splunk_hec]
type = "splunk_hec_logs"
inputs = [ "crdb_metrics_to_logs_splunk" ]
endpoint = "https://192.168.86.30:8088"
host_key = "hostname"
indexed_fields = [ "field1" ]
compression = "gzip"
default_token = "${SPLUNK_HEC_TOKEN}"
tls.verify_certificate = false
   [sinks.to_splunk_hec_logs.encoding]
   codec = "json"
[sinks.metrics_to_splunk_hec]
type = "splunk_hec_metrics"
inputs = [ "crdb_node_metrics" ]
endpoint = "https://192.168.86.30:8088"
host_key = "hostname"
index = "{{ host }}"
source = "{{ file }}"
compression = "gzip"
default_token = "${SPLUNK_HEC_TOKEN}"
sourcetype = "{{ sourcetype }}"
tls.verify_certificate = false

## Datadog
[sinks.crdb_dd_metrics]
type = "datadog_metrics"
inputs = [ "crdb_ui_console", "crdb_node_metrics" ]
default_api_key = "${DATADOG_API_KEY}"
[sinks.crdb_dd_logs]
type = "datadog_logs"
inputs = [ "crdb_logs"]
default_api_key = "${DATADOG_API_KEY}"
region = "us"
compression = "gzip"
site = "datadoghq.com"
tags = ["source:vector","env:dev","collector:live process"]
Step 8: Test
Test the Vector configuration before using systemctl
sudo vector --config vector.toml
Step 9: Deployment
Move the vector.toml file to the Vector directory and deploy Vector via the Linux systemctl
sudo mv vector.toml /etc/vector/vector.toml
sudo systemctl start vector
While there are paid and free tools out in the market that offer many capabilities, Vector is community maintained and offers flexibility to capture custom data and logs. The downside is a learning curve, trial, and error of converting data (which might be treated as log) and converting it to metrics. The upside of Vector is its flexibility to deliver parsed data to different provider endpoints.
So what do we gain by using Vector in our self-hosted CockroachDB clusters? We gain the flexibility to customize sending cleansed metrics to more than a single provider without being tied to a specific one. The all or nothing option to collect logs and metrics does not apply to Vector. Long gone are the days in which we were limited to collect metrics and alerts on anomalies of our systems.
So what can Vector by Datadog do for my CockroachDB Self-hosted cluster? It helps me provide monitoring data delivery for multiple teams without overburdening my infrastructure with agents fighting for the same resource.