As an SRE on the CockroachDB Dedicated team, we have the unique challenge of monitoring and managing a fleet of CockroachDB clusters around the globe. Perhaps needless to say, as a distributed database, security is an utmost priority for us. To address some of the needs related to security and monitoring (for example intrusion detection audit logging), we’ve invested in our next generation of Security Information and Event Management (SIEM) infrastructure.
In this post, we’ll cover how we aggregate logs for our SIEM needs and how that same system helps level up the observability for all members of the CockroachDB Dedicated team.
Some background first. CockroachDB Dedicated hosts CockroachDB clusters across two clouds: AWS and GCP. Each Cockroach cluster is made up of many pods running across one or more Kubernetes clusters and all Kubernetes Clusters for a single Cockroach cluster are in a single cloud account.
Prior to our Centralized Logging project, logs for each Cockroach cluster were pulled via a series of shell scripts and cloud provider tools. These methods were very effective for our size at the time, but with CockroachDB’s usage growing rapidly, we knew they wouldn’t scale.
Scoping the problem: How do we build centralized logging?
A major bottleneck to the development of our security infrastructure was not having all logs in a single place. Thus we focused on solutions that would ship all logs to a central secure location for analysis. A fair amount of research was done on what our solution should look like and that started with finding out how much data we were working with. This included checking the amount of logs produced for an average workload on one CockroachDB cluster and then extrapolating out to the size of the current fleet. Given our growth rate, we made approximations with hefty padding for future clusters. Once we had our estimates, we went shopping.
Our primary choices were ELK (Elasticsearch, Logstash, and Kibana), Splunk, or something built in-house. Planning for a larger amount of data helped us in negotiating with vendors as we were able to take advantage of price breaks. Though ultimately, we wanted to design for low maintenance.
A wise person once said:
First buy it, then build it, then forget it.
Meaning, when building a product, first try to buy what you need to sell the product, then try to build it. And if both of those options are possible, you should forget it.
This quote derives from the fact that most of what’s needed to deliver a product to market is not in your wheelhouse. The more time you spend maintaining that software the less time you can spend on your own competitive advantage. And the time needed to maintain the product is always more than expected. These not-so-hidden, but often forgotten costs, can quickly eat into profits. Thus our eyes were on cloud offerings rather than enterprise offerings that would require us to host and run the software ourselves.
There was another human element in this. What do people want? As much as I want to build a great product, I don’t believe there is a single way to achieve that goal. Most often there are a lot of good options in front of you with varying tradeoffs. This is one of the reasons humans still have jobs. If there were a clear answer, we’d automate it.
Trimmed down list of requirements
Technical Requirements
Must be secure and compliant according to our needs (eg. encrypted, SOC2, etc).
Must scale up to tens of thousands of clusters. We’re just getting going, so we can’t already be maxing out the service’s capabilities.
Must be executable in a few months by one developer (in preparation for our Free Tier launch).
Must be less expensive than something built in-house when costs are amortized over several years of usage.
Usability Requirements
Our team had to be at least a bit excited about it. If people are not excited to learn and use the product, it’s almost guaranteed to be used to less than its full potential.
Would people be able to pick it up quickly? It can’t be too tricky or have too many knobs to make it work effectively. We’re all capable. We can all learn complicated tools. But we all also have better things to do.
Elasticsearch is a great tool and we’ve enjoyed using it both for personal and professional projects. However, in the end we chose Splunk.
After our testing and cost analysis, it was close but clear that Elasticsearch would cost us more in the long run, with the added costs mostly due to the operational and maintenance needs of Elasticsearch, rather than the licensing fees. Also, there was a strong drive inside the Security team for Splunk which we knew would help smooth the path towards completion of the project. Given that this was a security motivated project, we needed to confirm that SplunkCloud could give us the flexibility we needed to hit our security goals. Once that was confirmed, my eyes were locked on Splunk. Now it was time to build.
How We Built Centralized Logging
Each CockroachDB cluster lives in one cloud at the moment (either AWS or GCP) over one or more regions. There are two major sources of logs and both needed to be shipped to Splunk and a data lake (ie. Google Cloud Storage, S3). Those two sources are:
Application logs produced by containers running in Kubernetes.
Cloud provider logs (eg. VPC flow logs, cloud audit logs, etc.)
Step 1: Shipping Application Logs from Kubernetes to Splunk
Shipping the application logs to Splunk was relatively easy. Simply adding an extra DaemonSet to each kubernetes cluster allowed us to ship the logs produced by CockroachDB and friends to a Splunk HTTP Event Collector (HEC) which is effectively an ingestion endpoint. Shipping the cloud provider logs was much more involved.
One snag that we ran into was compatibility with our older versions of CockroachDB which did not have the option to send logs over TCP. Instead logs were written to disk in several files. To remedy this compatibility issue, we decided to run a second instance of FluentBit as a sidecar to the CockroachDB process. This sidecar would be responsible for reading logs from the files produced by the CockroachDB process and forwarding them to the FluentBit DaemonSet. The DaemonSet would then be responsible for shipping logs to Splunk. Thankfully, newer versions of CockroachDB support logging over TCP and we can gradually phase out the sidecar pattern.
The trickiest part of sending application logs to Splunk was updating our brownfield (or preexisting) clusters. It’s quite easy to tell kubernetes to spin up a new StatefulSet with one more container. It’s another several weeks of work to tell hundreds of kubernetes clusters to edit currently running StatefulSets to include a new container and not incur downtime. Perhaps another blog post is due just for that topic!
Step 2: Shipping Cloud Provider Logs from Cloud Providers to Splunk
For both cloud providers (AWS and GCP), we wanted to ship logs like VPC flow logs, cloud audit logs, and kubernetes infrastructure logs. Since we use Pulumi to manage our infrastructure, we needed to create two separate stacks of cloud resources; one for each cloud.
Step 2a: Shipping logs from AWS to Splunk
The general flow of logs from AWS to Splunk starts by sending logs from a source (VPC for VPC flow logs) to a CloudWatch Log group. The log group acts as a Pub/Sub topic and a subscription relays these logs to a Kinesis Firehose Stream. The Kinesis Firehose Stream is responsible for transforming the log line with a lambda function (which is necessary given the log format that Splunk ingestors expect). Kineses then ships logs to Splunk and S3 for long term storage.

The reader might ask why we created three kinesis streams rather than one. Each stream has its own transformation function and given the diversity of the log types, this appeared to be the most maintainable solution. Also, given that all resources are managed via code, we were able to quickly create a second and third stream once one was working properly.
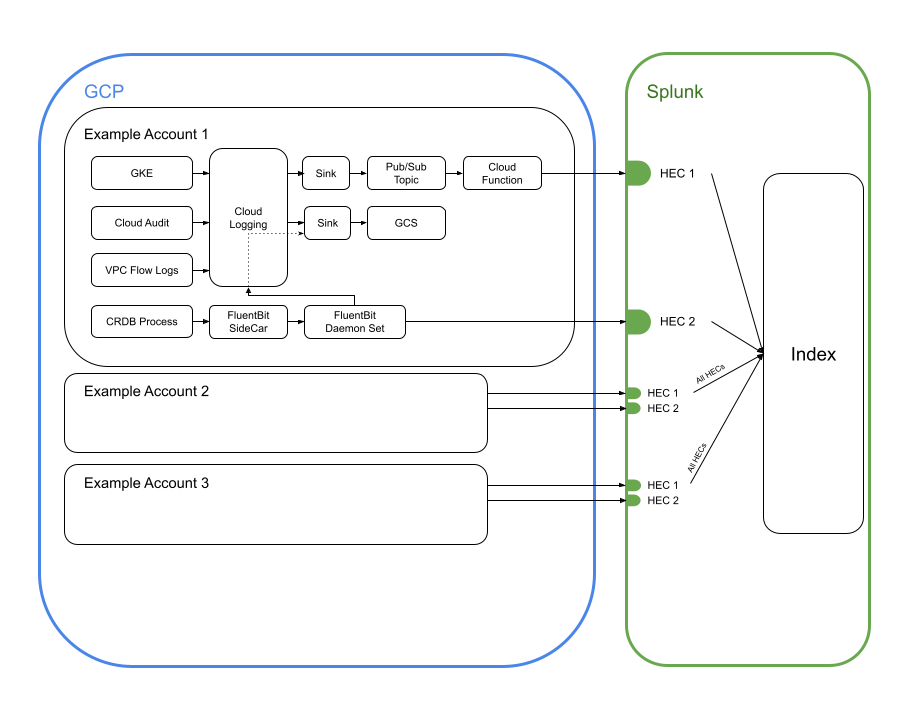
Step 2b: Shipping logs from GCP to Splunk
GCP logs worked in a similar way as AWS. Logs are first sent to Cloud Logging by all sources (eg. VPC flow logs). Cloud Logging Sinks then filter the main Cloud Logging stream and dump the filtered logs to a particular location (eg. Pub/Sub topic, Google Cloud Storage). For those logs sent to the Pub/Sub topic, a cloud function is responsible for transforming the logs and forwarding them to Splunk.
The results: Shipping thousands of logs to longterm, searchable storage
With these two solutions in place, we are now able to ship thousands of CockroachDB clusters’ logs to longterm and searchable storage. While we are still in the process of rolling these changes out to all clusters, we are planning for numbers like the following:
300+ GB sent to SplunkCloud per day
50+ million events sent to SplunkCloud per day
Less than 8 hours of engineer time per month to maintain
Ability to look up fleetwide (all clusters) logs in a matter of seconds (compared to hours before).
Most importantly, we can now alert on a myriad of new event types that stream from each cloud provider. These include AWS API authentication attempts, infrastructure changes, and privilege escalations. By alerting on specific authentication attempt profiles and network traffic, our security team can hold a pager (rather than scouring logs) that yields actionable alerts.
While there are a number of paths that would have proved adequate for our needs, this path was chosen for its simplicity, maintainability, and scalability. And most importantly for this project, with Splunk in place our security team can operate faster and more efficiently. I’m happy to say that we are ever increasing our ability to provide our customers with a scalable and secure distributed SQL database.