[For CockroachDB's most up-to-date performance benchmarks, please read our Performance Overview page]
Correctness, stability, and performance are the foundations of CockroachDB. We've invested tremendous resources into correctness and stability. Today, performance takes the spotlight as we will be publishing benchmarked metrics that demonstrate that you can achieve correctness, stability, and excellent performance within the same database.
So how does CockroachDB define performance? On which type of queries does CockroachDB perform well?
CockroachDB expressly prioritizes online transaction processing (OLTP) performance. We define OLTP queries as any queries you might expect a row-oriented database to support. Following our 1.1 release, we spent the past six months working on performance in all areas of CockroachDB, resulting in reduced latencies as well as improved throughput and scalability. While we are excited to share the results of this effort, we do see additional opportunities for improvement and will continue to invest in performance in future releases.
A three-node, fully-replicated, and multi-active CockroachDB 2.0 cluster achieves a maximum throughput of 16,150 tpmC on a TPC-C dataset. This is a 62% improvement over our 1.1 release. Additionally, the latencies on 2.0 dropped by up to 81% compared to 1.1, using the same workload parameters. That means that our response time improved by 544%.
CockroachDB 2.0 will be released in GA in the coming weeks. Read on to learn more about which performance metrics we think matter most, why you should demand benchmark TPC-C results under serializable isolation, and how CockroachDB 2.0’s performance compares to 1.1.
Which performance metrics matter?
For OLTP workloads, performance can be broken down into throughput (often thought of as processing speed) and latency (time to achieve something).
Throughput
We measure throughput as transactions per unit of time. In the case of the TPC-C results discussed below, we discuss transactions per minute (tpmC). Some benchmarks measure results as queries per second (QPS). This is a generic concept, and usually means a simple, non-transactional read or write command is sent to the server.
In the real world, applications generate transactional workloads which consist of a combination of reads and writes, possibly with concurrency and likely without all data being loaded into memory. If you see benchmark results quoted in QPS, take them with a grain of salt, because anything as simple as a "query" is unlikely to be representative of the workload you need to run in practice.
Latency
Latency is traditionally measured in milliseconds (ms) and will usually be distinguished as either read or write latencies depending upon the transaction.
It’s important to note that it is not sufficient to evaluate median latency. We must also understand the distribution, including tail performance, because these latencies occur frequently in production applications. This means that we must look critically at 95th percentile (p95) and 99th percentile (p99) latencies.
For example, a p95 latency states that 95% of transactions offer a latency of X ms or lower.
High throughput, low latency
Good performance means high throughput and low latency. Keep in mind that throughput and latency are not directly correlated. For example, you can increase throughput with more clients/nodes without realizing corresponding improvements to latency.
Why not using TPC-C to compare database performance is a mistake
Left to their own devices, database vendors often select workloads that produce favorable numbers. For example, CockroachDB can serve 220,000 queries per second in a 95% read focused key-value workload. These numbers can be useful, especially when comparing across versions of the same database, as in the following chart which shows that CockroachDB 2.0 exhibits 37% more throughput than CockroachDB 1.1 on 12 node x 16 vcpu/node configurations.

But you shouldn’t have to take our word for it.
If every database vendor chose their own snowflake metrics and workloads, then making apples to apples comparisons of databases would be an exercise in futility. And because the composition of a workload has a huge impact on its performance, self-created workloads are highly susceptible to tampering. This is why the Transaction Processing Council (TPC) benchmarks were developed. TPC, as industry consortium, created a benchmark specifically for OLTP workloads called TPC-C.
TPC-C is old, but it has withstood the test of time. Despite being created in 1992, it’s still the most mature and relevant industry standard measure for OLTP workloads. In its own words, TPC-C:
“...involves a mix of five concurrent transactions of different types and complexity either executed on-line or queued for deferred execution. The database is comprised of nine types of tables with a wide range of record and population sizes. While the benchmark portrays the activity of a wholesale supplier, TPC-C is not limited to the activity of any particular business segment, but, rather represents any industry that must manage, sell, or distribute a product or service.”
As a result, TPC-C includes create, read, update, and delete (e.g., CRUD) queries, basic joins, and other SQL statements used to administer mission critical transactional workloads. It includes detailed specifications for concurrency and workload contention. TPC-C is the only objective comparison for evaluating OLTP performance. You should demand that all database companies share TPC-C performance benchmarks before starting any project.
What is good TPC-C performance?
TPC-C measures the throughput and latency for processing sales through a customer warehouse using a “business throughput” metric called tpmC that measures the number of order transactions performed per minute throughout the system.
In fact, tpmC is a considerably more realistic metric than TPS or QPS alone because it summarizes multiple transactions per order and accounts for failed transactions. TPC-C also has several latency requirements that apply to median, p90, and max latencies.
Finally, TPC-C specifies restrictions on the maximum throughput achievable per warehouse. This is done to ensure that as a system becomes progressively more capable of throughput, it must also deal with progressively more data. This is how things work in the real world, and it makes little sense to say that your database can process a bazillion transactions per second if it’s processing the same data over and over again.
Because TPC-C is constrained to a maximum amount of throughput per warehouse, we often discuss TPC-C performance as the maximum number of warehouses for which a database can maintain the maximum throughput. For a full description of the benchmark, please consult the official documentation.
CRDB 2.0 vs. 1.1 TPC-C Benchmarks
In 2.0, CockroachDB achieves max throughput on 1,300 warehouses on a three-node, fully-replicated multi-active cluster (16 vcpus/node) running TPC-C [^1]. This is an improvement of 62% compared to the maximum number of warehouses supported in the 1.1 release, 850 warehouses.
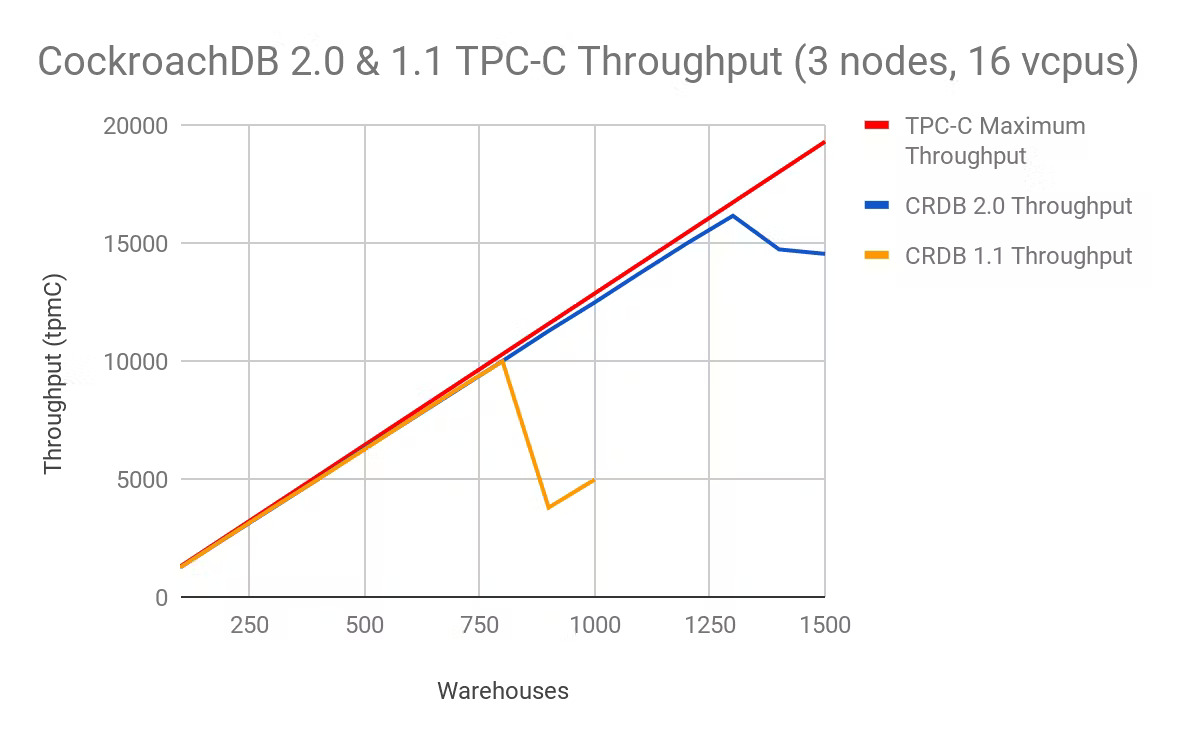
In fact, due to CockroachDB’s built-in scalability, we can add more nodes and continue to scale linearly with TPC-C to many more warehouses. More on this to come in our upcoming 2.0 release post.
We compared the p50, p95, and p99 latencies for these same workloads under three nodes. In CockroachDB 1.1, our latencies increased dramatically after 850 warehouses. Similar to throughput improvements, CockroachDB also managed to maintain low latency measures through 1300 warehouses in 2.0.
These results were achieved at the same isolation level (i.e., serializable) and number of nodes (i.e. 3)
Again, with additional nodes, CockroachDB 2.0 can continue to maintain low latency and scale linearly with TPC-C across many more warehouses. Our 2.0 release blog post will cover this scaling in more detail.
Next, we examined an apples to apples comparison of latency under the same 850 warehouse workload between CockroachDB 2.0 and CockroachDB 1.1 with a three node (16 vcpus/node) setup:
These results were achieved at the same isolation level (i.e., serializable), number of nodes (i.e. 3), number of warehouses (i.e., 850).
For the same load, CockroachDB 2.0 reduces latency by as much as 82% when compared to CockroachDB 1.1. Viewed another way, CockroachDB 2.0 improves response time by 544% (CockroachDB 1.1 p99/CockroachDB 2.0 p99) when compared to 1.1.
Isolation Levels
Most databases present a choice of several transaction isolation levels, offering a tradeoff between correctness and performance. CockroachDB provides strong (“SERIALIZABLE”) isolation by default to ensure that your application always sees the data it expects.
In an earlier blog post, Real Transactions are Serializable, we explained recent research at Stanford that explored the degree to which weak isolation leads to real-world bugs in 12 eCommerce applications. In five of the twelve tested applications, low isolation levels left companies vulnerable to serious financial loss.
Many competitors will have you believe that serializable isolation isn’t feasible in a production application. In fact, Oracle’s documentation states:
“While [serializable] isolation between transactions is generally desirable, running many applications in this mode can seriously compromise application throughput. Complete isolation of concurrently running transactions could mean that one transaction cannot perform an insert into a table being queried by another transaction. In short, real-world considerations usually require a compromise between perfect transaction isolation and performance.”
While some databases offer serializable isolation (or a weaker approximation of it, like Oracle and SAP Hana), they rarely publish benchmarks with that level of safety because their performance degrades significantly. CockroachDB's serializable isolation provides uncompromising safety without impacting performance.
In CockroachDB 2.0, improvements in our serializable isolation implementation make it feasible to use for all transactions. We’ve deprecated snapshot isolation because it provides little or no performance benefit and comes with significant safety concerns. Note that while it is possible to engineer an application to be safe at weaker isolation levels, doing so is onerous for application developers and creates a maintenance time bomb.
CockroachDB benchmarks TPC-C using the highest level of isolation recognized under the SQL standard.
How to Survive Failure
You might have noticed that we reported the above numbers under a multi-node (e.g., 3 node) deployment.
We did this to demonstrate that CRDB can be highly performant while offering superior survivability for a single data center, single region, or full global deployment. To ensure that this survivability does not come at the cost of performance, CRDB employs a number of features like “follow-the-workload” to minimize distribution’s effect on throughput and latency.
Because CockroachDB is built to be inherently survivable and always correct, we report all TPC-C results with full consensus replication and serializable isolation. That's not something we've seen from any other database vendor on the market.
What’s next for CockroachDB
We stand behind all of the numbers in this document and plan to publish a more detailed look at performance including a step by step guide to reproduce our findings in a forthcoming performance report.
CRDB employs an excellent combination of correctness, survivability, and performance through our use of serializable isolation, distributed database, and evidenced by our TPC-C throughput and latency. No longer are you forced to trade correctness and survivability to meet your customers’ performance demands.
Why not take this opportunity to test CockroachDB 2.0 (still in beta) for yourself?
P.S. Stay tuned for our upcoming 2.0 release announcement in which we will share our TPC-C 10,000 warehouse performance benchmarked against a leading cloud competitor!
[^1]: Note: We have not filed for official certification of our TPC-C results. However, we will post full reproduction steps in a forthcoming whitepaper.
Illustration by Dalbert B. Vilarino