

Review of CockroachDB terminology
- Range: CockroachDB stores all user data and almost all system data in a giant sorted map of key-value pairs. This keyspace is divided into “ranges”, contiguous chunks of the keyspace, so that every key can always be found in a single range.
- Range Replica: CockroachDB replicates each range (3 times by default) and stores each replica on a different node.
- Range Lease: For each range, one of the replicas holds the “range lease”. This replica, referred to as the “leaseholder”, is the one that receives and coordinates all read and write requests for the range. - Under-replicated Ranges: When a cluster is first initialized, the few default starting ranges have a single replica. As more nodes become available, the cluster replicates these ranges to other nodes until the number of replicas for each range reaches the desired (3 by default). If a range has fewer replicas than the replication factor, the range is said to be “under-replicated”. , if configured, are not counted when calculating replication status. - Unavailable Ranges: If a majority of a range’s replicas are on nodes that are unavailable, then the entire range is unavailable and will be unable to process queries.
Dashboard navigation
Use the Graph menu to display metrics for your entire cluster or for a specific node. To the right of the Graph and Dashboard menus, a time interval selector allows you to filter the view for a predefined or custom time interval. Use the navigation buttons to move to the previous, next, or current time interval. When you select a time interval, the same interval is selected in the pages. However, if you select 10 or 30 minutes, the interval defaults to 1 hour in SQL Activity pages. When viewing graphs, a tooltip will appear at your mouse cursor providing further insight into the data under the mouse cursor. Click anywhere within the graph to pin the tooltip in place, decoupling the tooltip from your mouse movements. Click anywhere within the graph to cause the tooltip to follow your mouse once more. The Replication dashboard displays the following time series graphs:Ranges
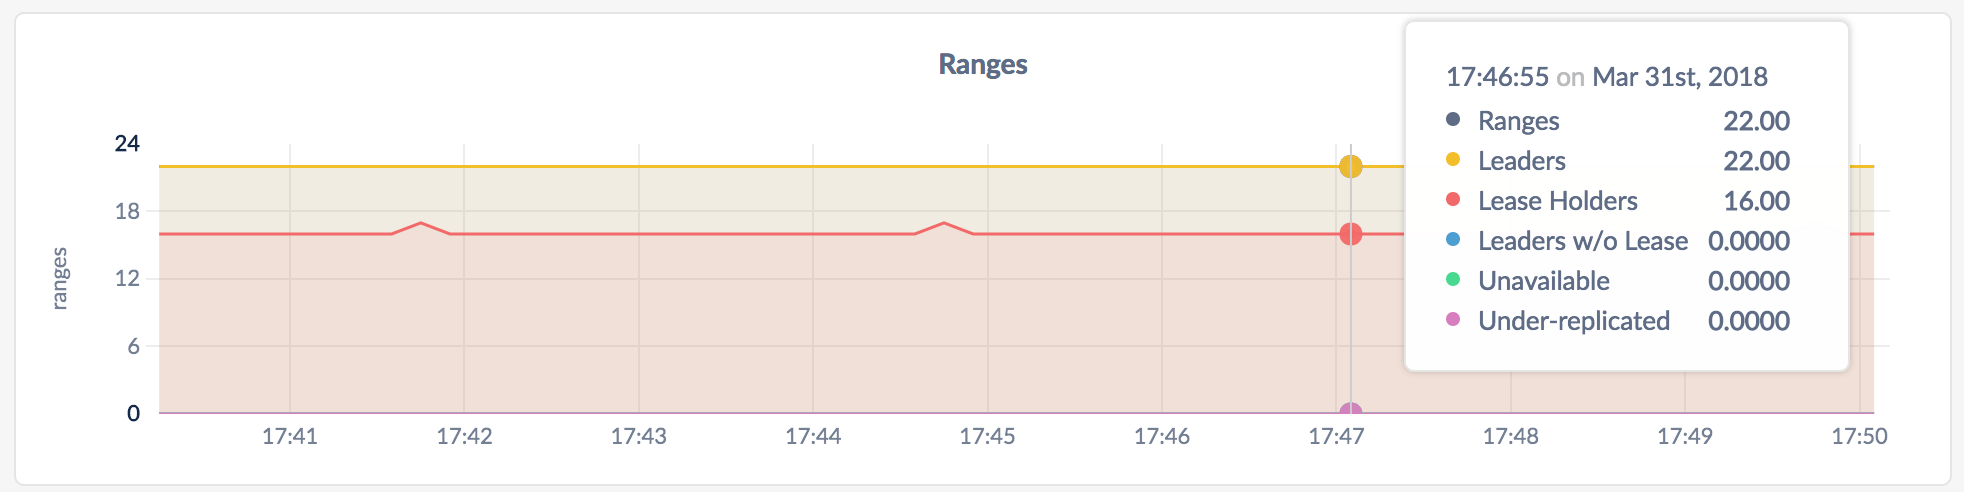
- In the node view, the graph shows details about ranges on the node.
- In the cluster view, the graph shows details about ranges across all nodes in the cluster.
Logical Bytes per Store
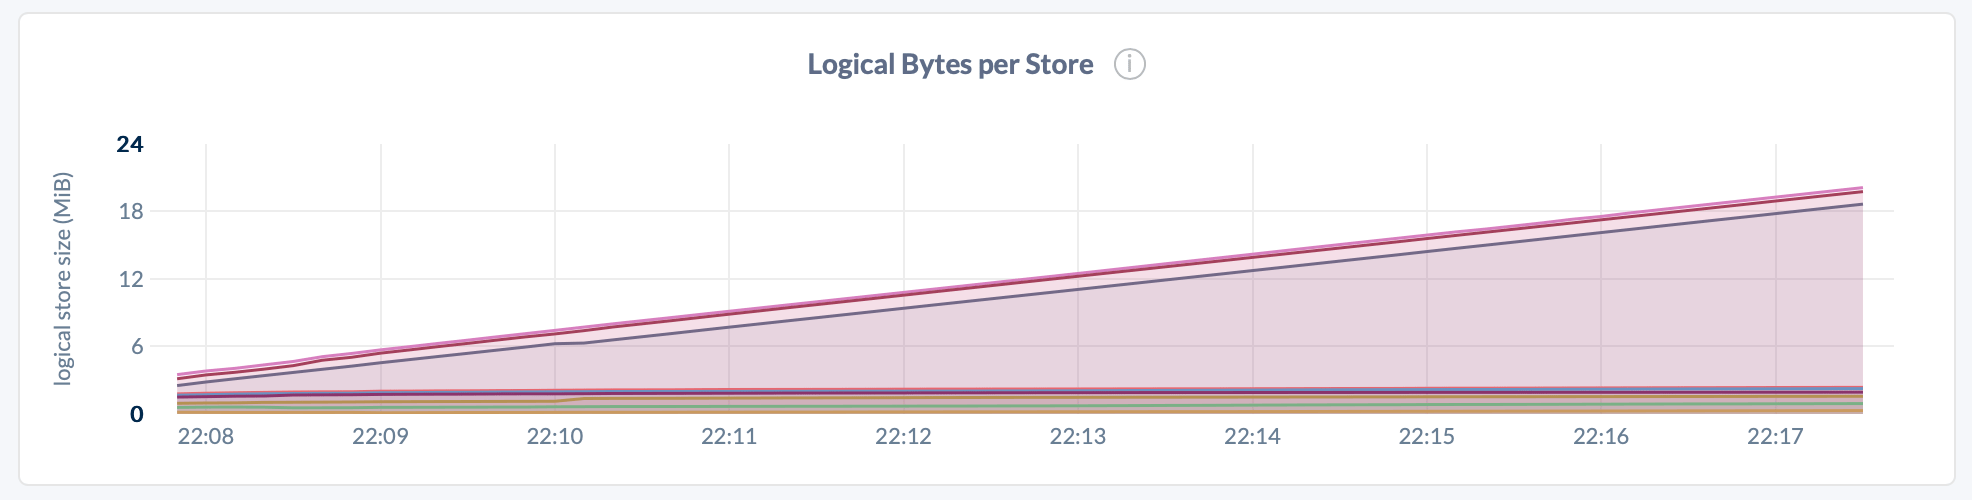
Logical bytes reflect the approximate number of bytes stored in the database. This value may deviate from the number of physical bytes on disk, due to factors such as compression and write amplification.
Replicas Per Store
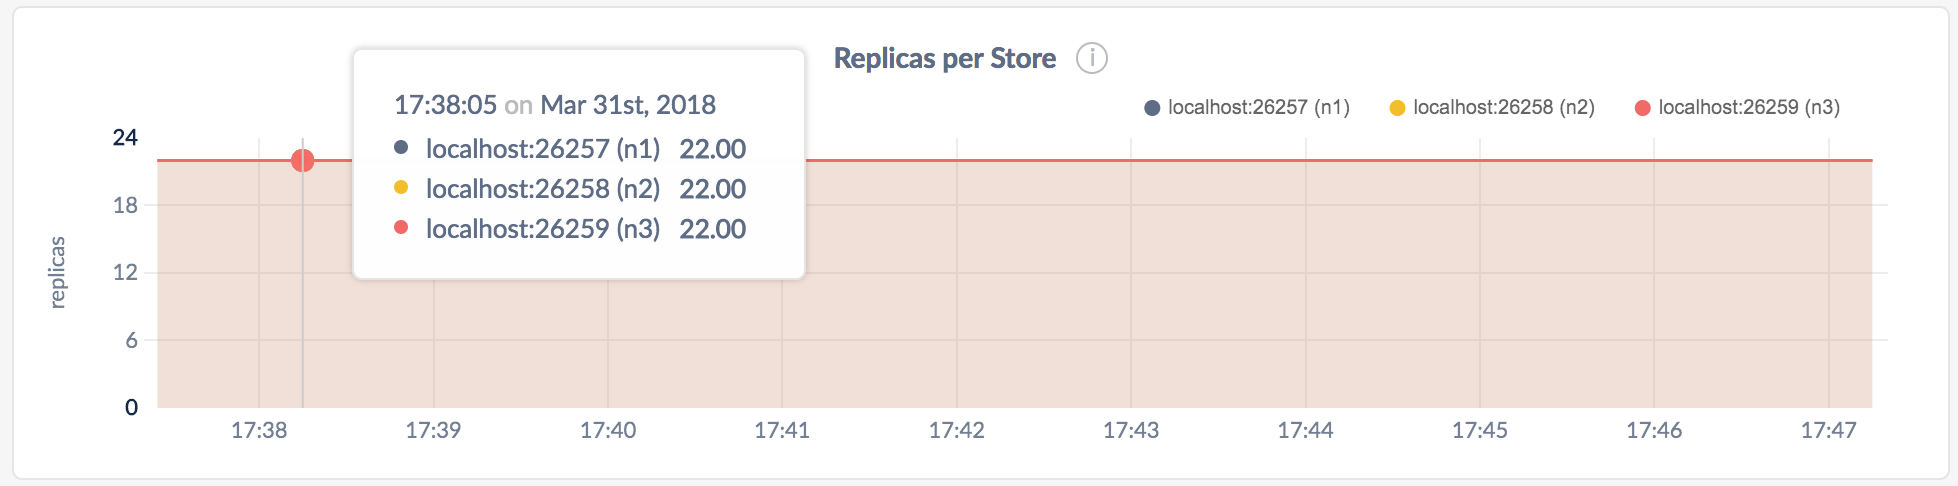
- In the node view, the graph shows the number of range replicas on the store.
- In the cluster view, the graph shows the number of range replicas on each store.
Replica Quiescence
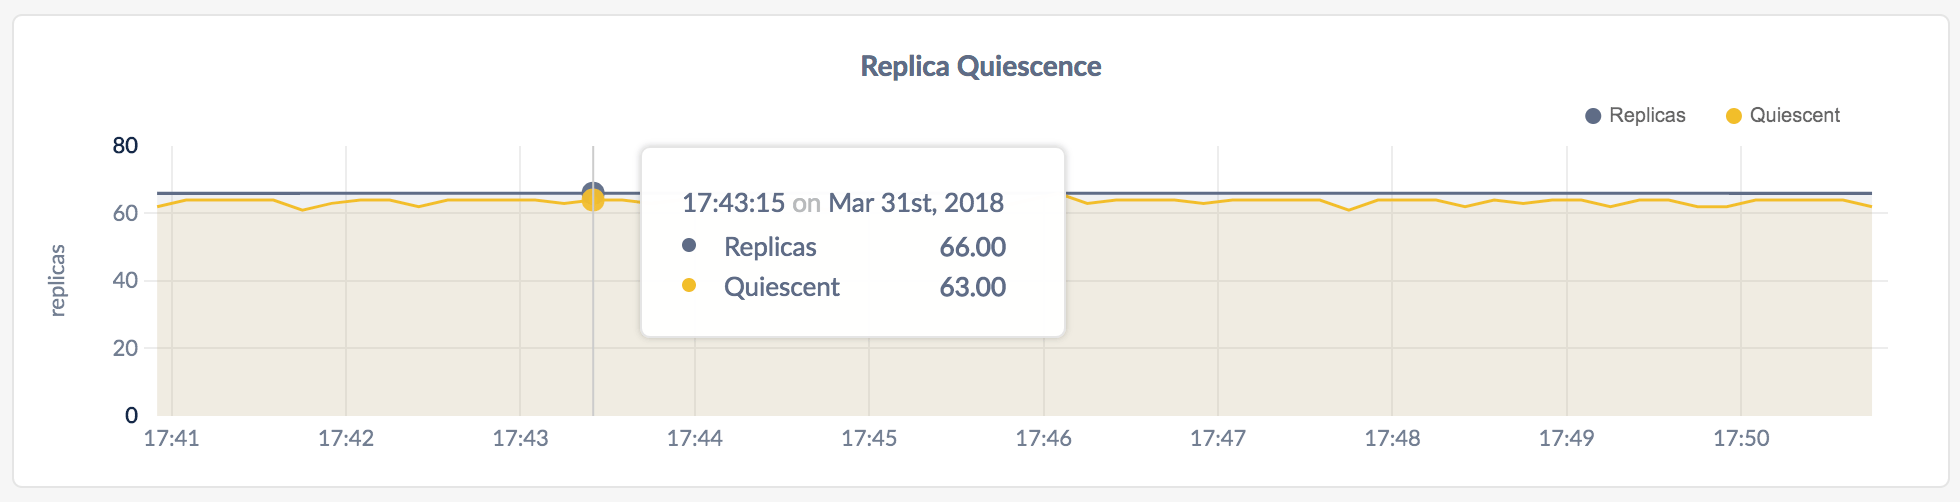
- In the node view, the graph shows the number of replicas on the node.
- In the cluster view, the graph shows the number of replicas across all nodes.
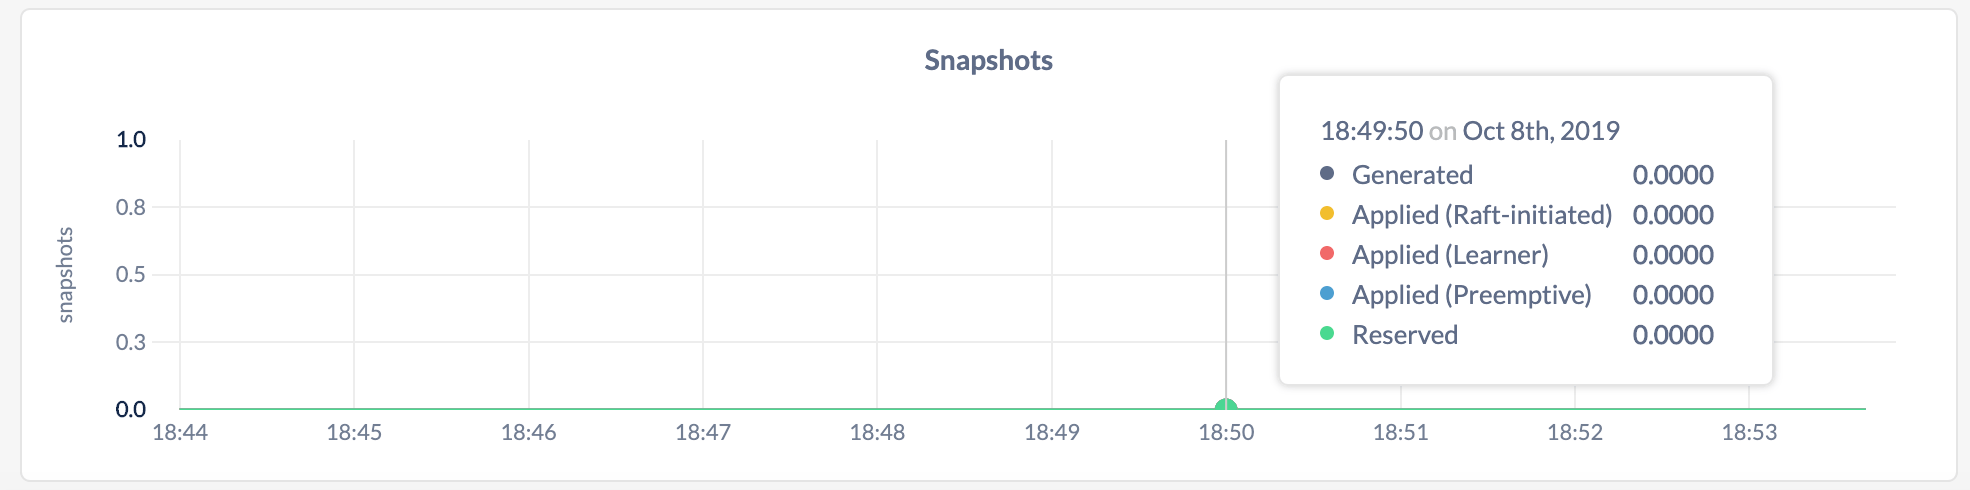
Snapshots
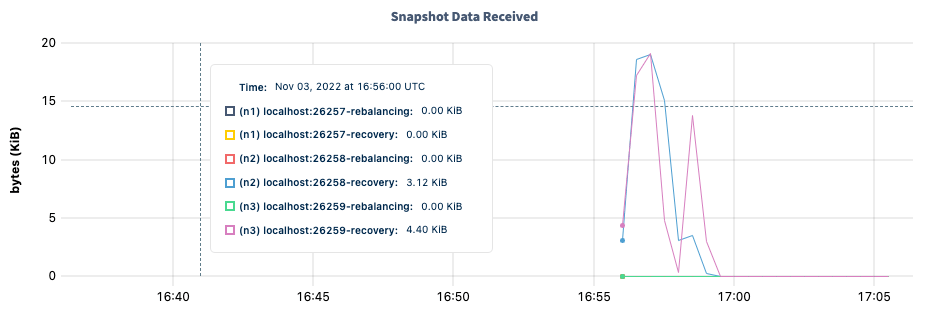
Snapshot Data Received
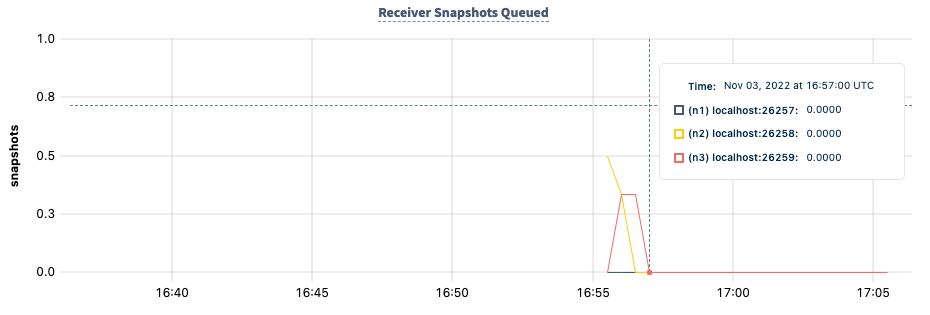
Receiver Snapshots Queued
Circuit Breaker Tripped Replicas
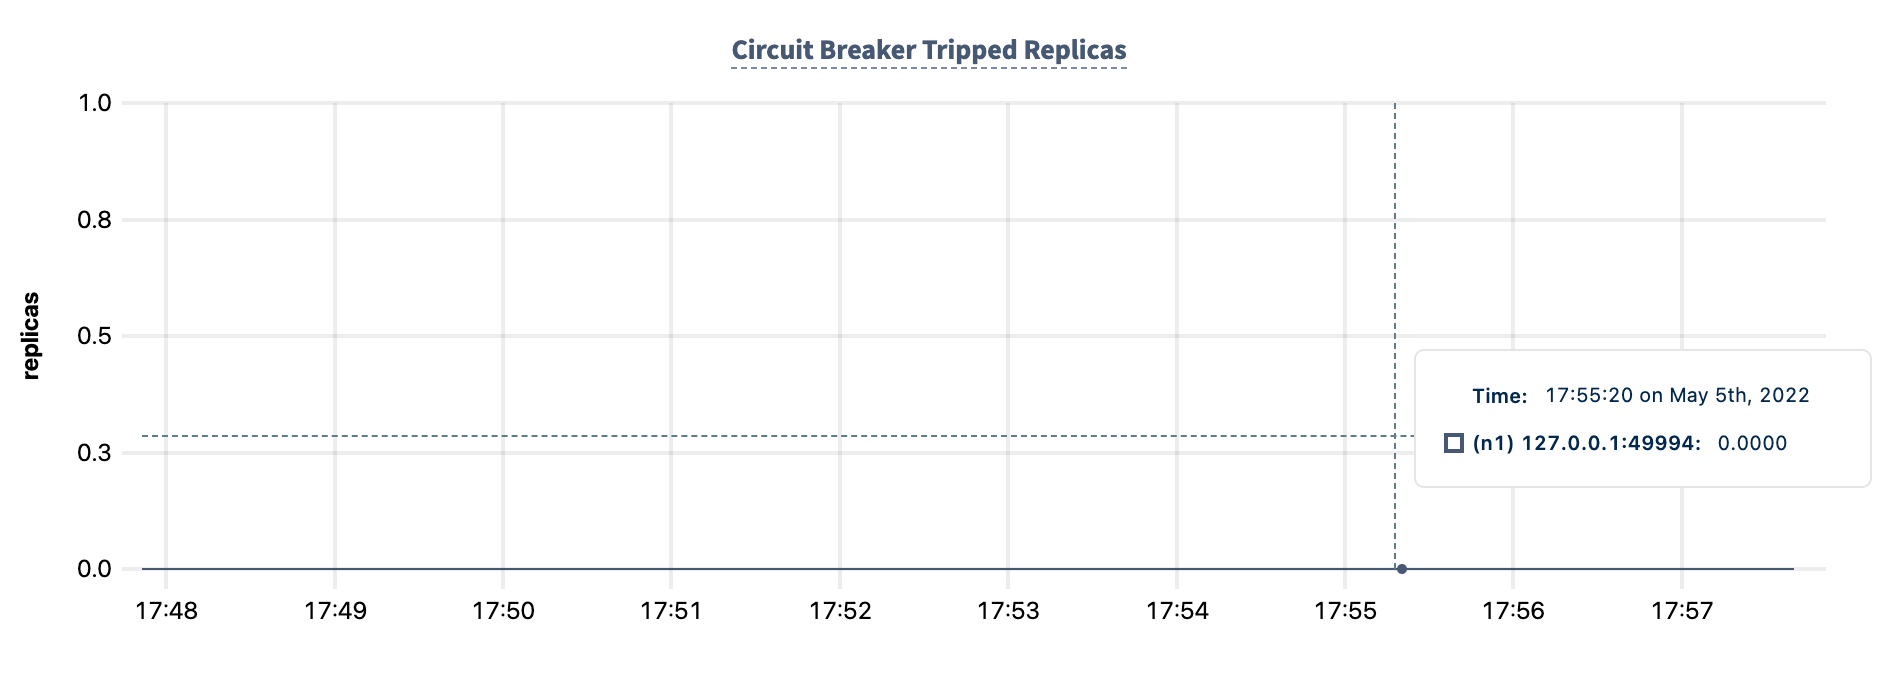
- In the node view, the graph shows the number of replicas for which the per-replica circuit breaker is currently tripped, for the selected node.
- In the cluster view, the graph shows the number of replicas for which the per-replica circuit breaker is currently tripped, for each node in the cluster.
Circuit Breaker Tripped Events
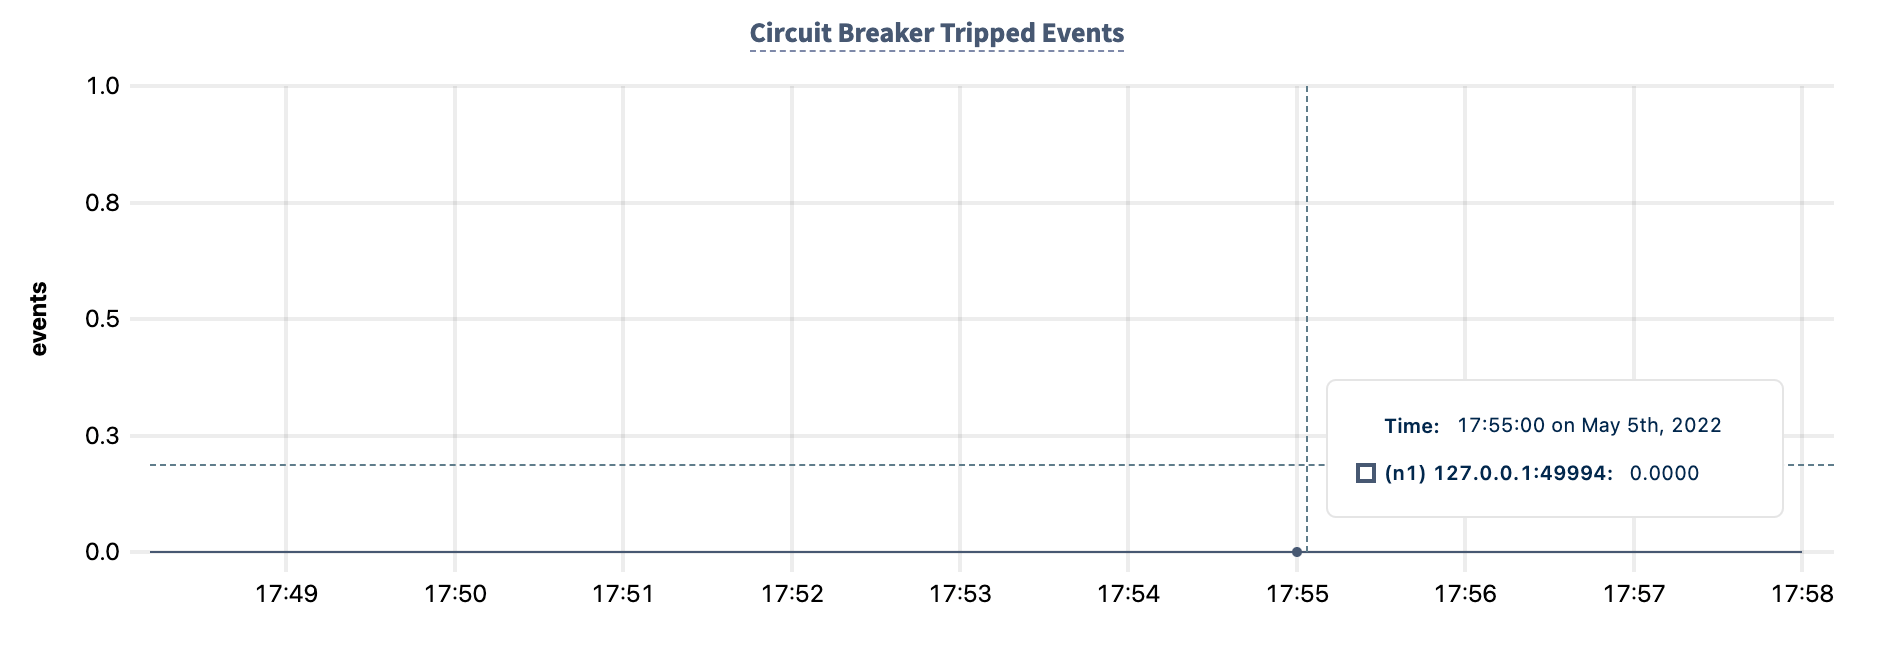
ReplicaUnavailableError event until the range becomes available again.
-
In the node view, the graph shows the rate of
ReplicaUnavailableErrorevents logged per aggregated interval of time since thecockroachprocess started, for the selected node. -
In the cluster view, the graph shows the rate of
ReplicaUnavailableErrorevents logged per aggregated interval of time since thecockroachprocess started, for each node in the cluster.
Paused Follower
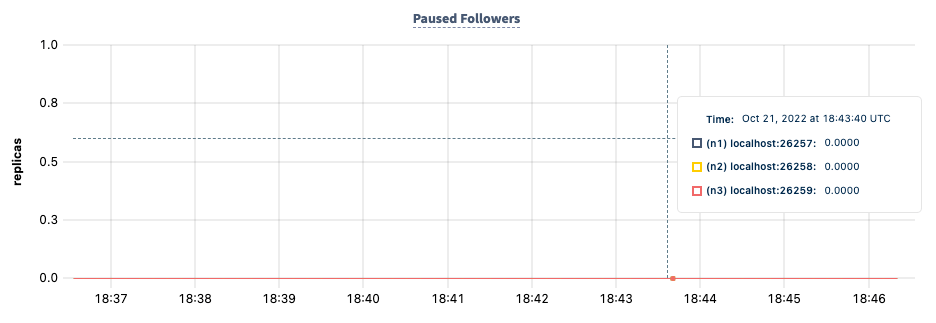
0 represents that a node is replicating as normal, while a value of 1 represents that replication has been paused for the listed node.
- In the node view, the graph shows whether replication has been paused, for the selected node.
- In the cluster view, the graph shows each node in the cluster and indicates whether replication has been paused for each node.
Replicate Queue Actions: Successes
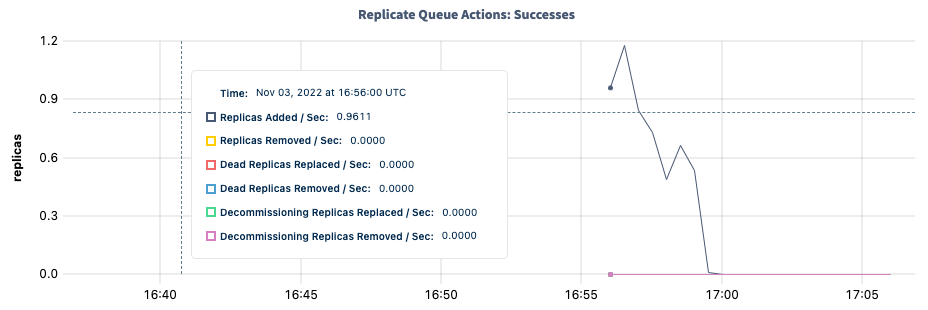
- In the node view, the graph shows the rate of successful replication queue actions for the selected node.
- In the cluster view, the graph shows the average rate of successful replication queue actions across the cluster.
Replicate Queue Actions: Failures
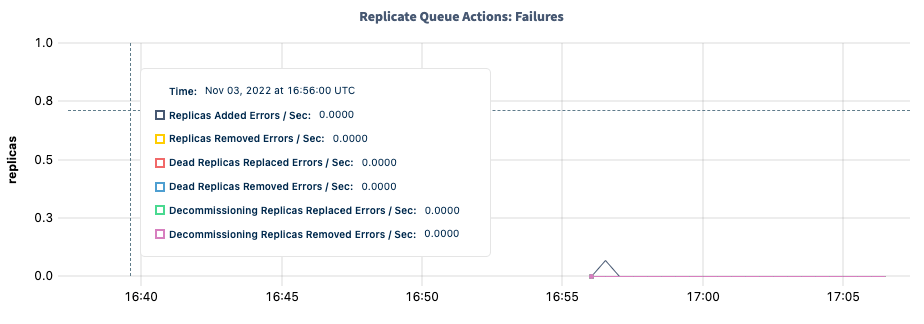
- In the node view, the graph shows the rate of failed replication queue actions for the selected node.
- In the cluster view, the graph shows the average rate of failed replication queue actions across the cluster.
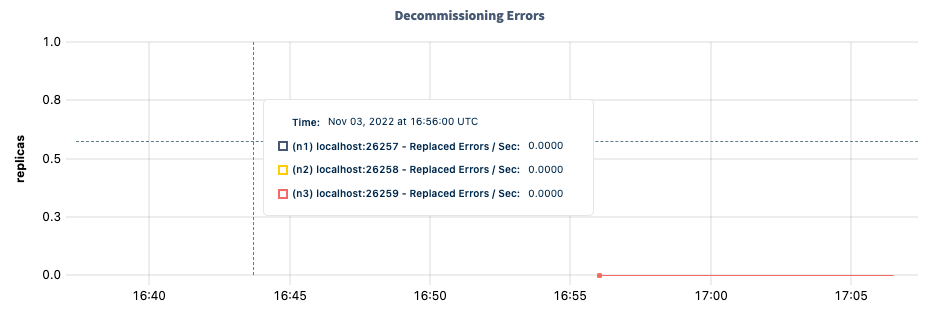
Decommissioning Errors
Other graphs
The Replication dashboard shows other time series graphs that are important for CockroachDB developers:- Leaseholders per Store
- Average Queries per Store
- Range Operations
Summary and events
Summary panel
A Summary panel of key metrics is displayed to the right of the timeseries graphs.
If you are testing your deployment locally with multiple CockroachDB nodes running on a single machine (this is ), you must explicitly per node in order to display the correct capacity. Otherwise, the machine’s actual disk capacity will be counted as a separate store for each node, thus inflating the computed capacity.
Events panel
Underneath the Summary panel, the Events panel lists the 5 most recent events logged for all nodes across the cluster. To list all events, click View all events.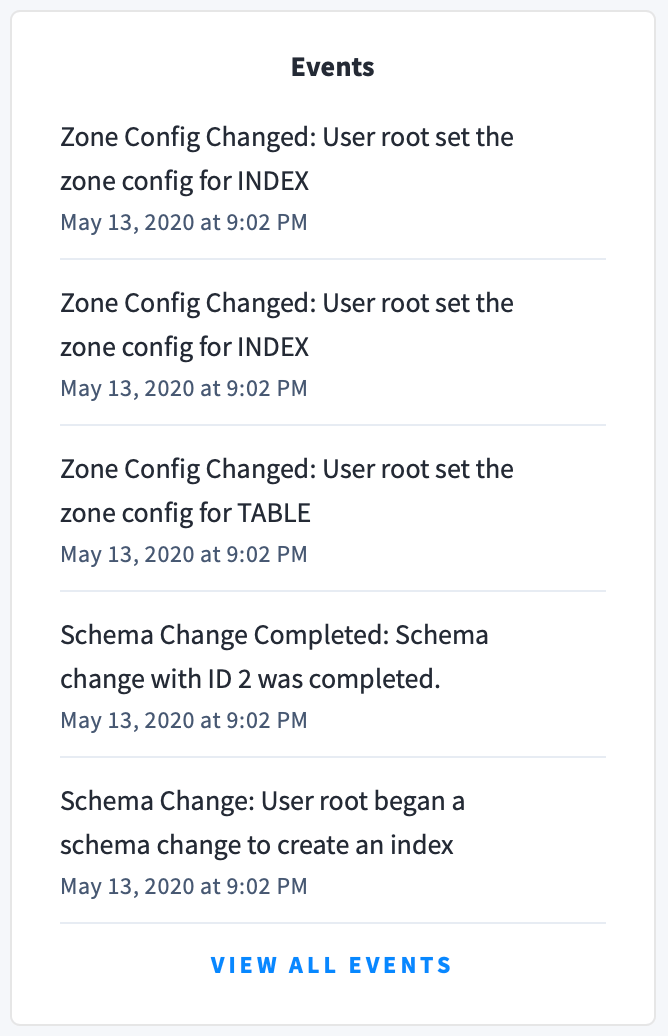
- Database created
- Database dropped
- Table created
- Table dropped
- Table altered
- Index created
- Index dropped
- View created
- View dropped
- Schema change reversed
- Schema change finished
- Node joined
- Node decommissioned
- Node restarted
- Cluster setting changed