

Dashboard navigation
Use the Graph menu to display metrics for your entire cluster or for a specific node. To the right of the Graph and Dashboard menus, a time interval selector allows you to filter the view for a predefined or custom time interval. Use the navigation buttons to move to the previous, next, or current time interval. When you select a time interval, the same interval is selected in the pages. However, if you select 10 or 30 minutes, the interval defaults to 1 hour in SQL Activity pages. Hovering your mouse pointer over the graph title will display a tooltip with a description and the used to create the graph. When hovering on graphs, crosshair lines will appear at your mouse pointer. The series’ values corresponding to the given time in the cross hairs are displayed in the legend under the graph. Hovering the mouse pointer on a given series displays the corresponding value near the mouse pointer and highlights the series line (graying out other series lines). Click anywhere within the graph to freeze the values in place. Click anywhere within the graph again to cause the values to change with your mouse movements once more. In the legend, click on an individual series to isolate it on the graph. The other series will be hidden, while the hover will still work. Click the individual series again to make the other series visible. If there are many series, a scrollbar may appear on the right of the legend. This is to limit the size of the legend so that it does not get endlessly large, particularly on clusters with many nodes.Per store metrics
To display per metrics, select a specific node in the Graph menu. An aggregate metric for that node as well as a metric for each store of that node will be displayed for L0 SSTable Count, L0 SSTable Size, and some other graphs.The Storage dashboard displays the following time series graphs:
Capacity
You can monitor the Capacity graph to determine when additional storage is needed (e.g., by ).
Expected values for a healthy cluster: Used capacity should not persistently exceed 80% of the total capacity.
For instructions on how to free up disk space as quickly as possible after dropping a table, see
Capacity metrics
The Capacity graph displays disk usage by CockroachDB data in relation to the maximum size, which is determined as follows:- If a store size was specified using the flag when starting nodes, this value is used as the limit for CockroachDB data.
- If no store size has been explicitly set, the actual disk capacity is used as the limit for CockroachDB data.
Live Bytes
The Live Bytes graph displays the amount of data that can be read by applications and CockroachDB.
Logical bytes reflect the approximate number of bytes stored in the database. This value may deviate from the number of physical bytes on disk, due to factors such as compression and write amplification.
L0 SSTable Count
- In the node view, the graph shows the number of in use for each store of that node.
- In the cluster view, the graph shows the total number of L0 SSTables in use for each node of the cluster.
L0 SSTable Size
- In the node view, the graph shows the size of all in use for each store of that node.
- In the cluster view, the graph shows the total size of all L0 SSTables in use for each node of the cluster.
File Descriptors
- In the node view, the graph shows the number of open file descriptors for that node, compared with the file descriptor limit.
- In the cluster view, the graph shows the number of open file descriptors across all nodes, compared with the file descriptor limit.
If you are running multiple nodes on a single machine (not recommended), the actual number of open file descriptors are considered open on each node. Thus the limit count value displayed on the DB Console is the actual value of open file descriptors multiplied by the number of nodes, compared with the file descriptor limit.
Disk Write Breakdown
- In the node view, the graph shows the number of bytes written to disk per second categorized according to the source for that node.
- In the cluster view, the graph shows the number of bytes written to disk per second categorized according to the source for each node.
- (
pebble-wal) - (
pebble-compaction) - (
pebble-ingestion) - (
pebble-memtable-flush) - (
raft-snapshot) - (
encryption-registry) - (
crdb-log) - SQL row spill (
sql-row-spill), refer to flag--max-disk-temp-storage - (
sql-col-spill)
Other graphs
The Storage dashboard shows other time series graphs that are important for CockroachDB developers:
For monitoring CockroachDB, it is sufficient to use the Capacity and File Descriptors graphs.
Summary and events
Summary panel
A Summary panel of key metrics is displayed to the right of the timeseries graphs.
If you are testing your deployment locally with multiple CockroachDB nodes running on a single machine (this is ), you must explicitly per node in order to display the correct capacity. Otherwise, the machine’s actual disk capacity will be counted as a separate store for each node, thus inflating the computed capacity.
Events panel
Underneath the Summary panel, the Events panel lists the 5 most recent events logged for all nodes across the cluster. To list all events, click View all events.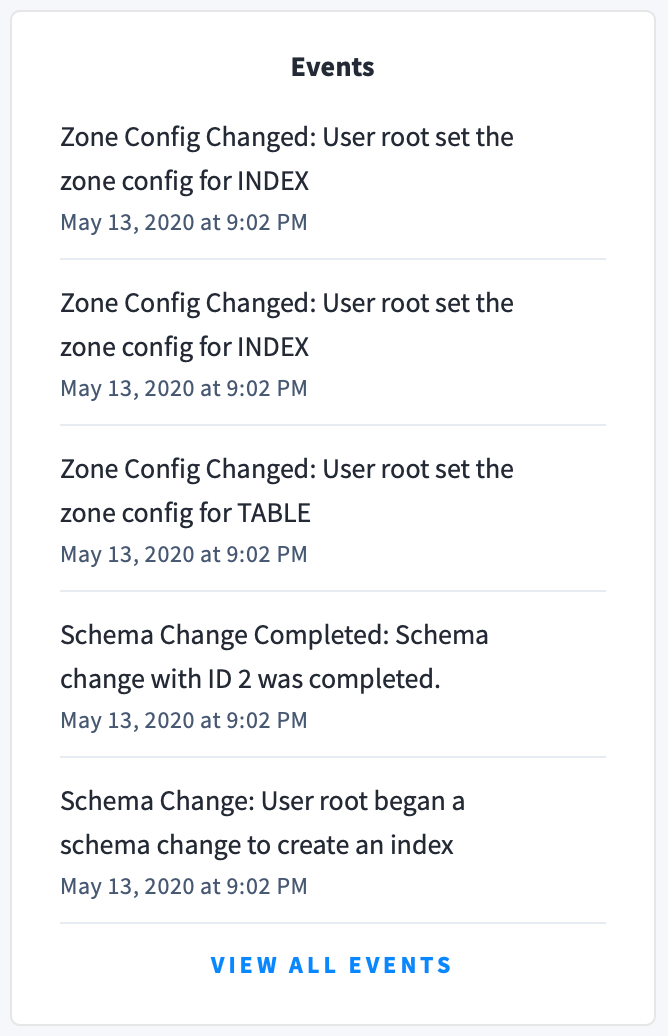
- Database created
- Database dropped
- Table created
- Table dropped
- Table altered
- Index created
- Index dropped
- View created
- View dropped
- Schema change reversed
- Schema change finished
- Node joined
- Node decommissioned
- Node restarted
- Cluster setting changed