

Required privileges
New in v26.3: To view the Schedules page, a user must be a member of the or have the system privilege. To grant this privilege:Filter schedules
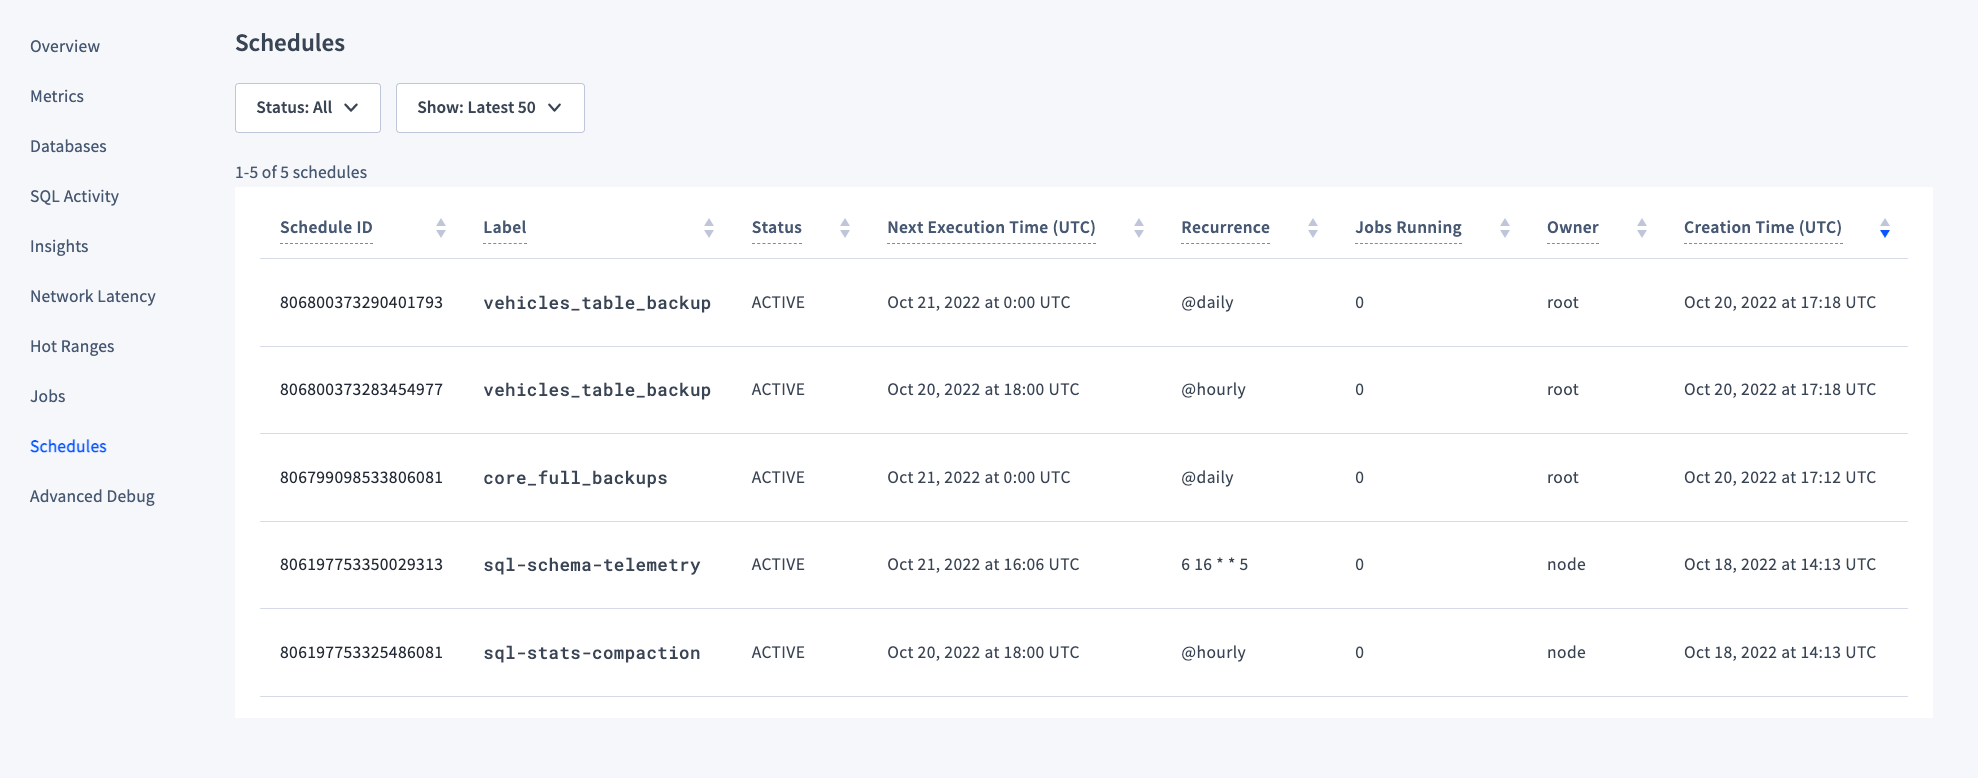
- Use the Status menu to filter schedules by schedule status, displaying all schedules, only active schedules, or only paused schedules.
- Use the Show menu to toggle displaying the latest 50 schedules or all schedules on the cluster.
Schedules list
Use the Schedules list to see your active and paused schedules.- To view schedule details click the schedule ID.
- If you drop a schedule, it will no longer be listed.
Schedule details
Click on a schedule ID to view the full SQL statement that the schedule runs. For example, the following screenshot shows the resulting statement for a full cluster backup recurring every day: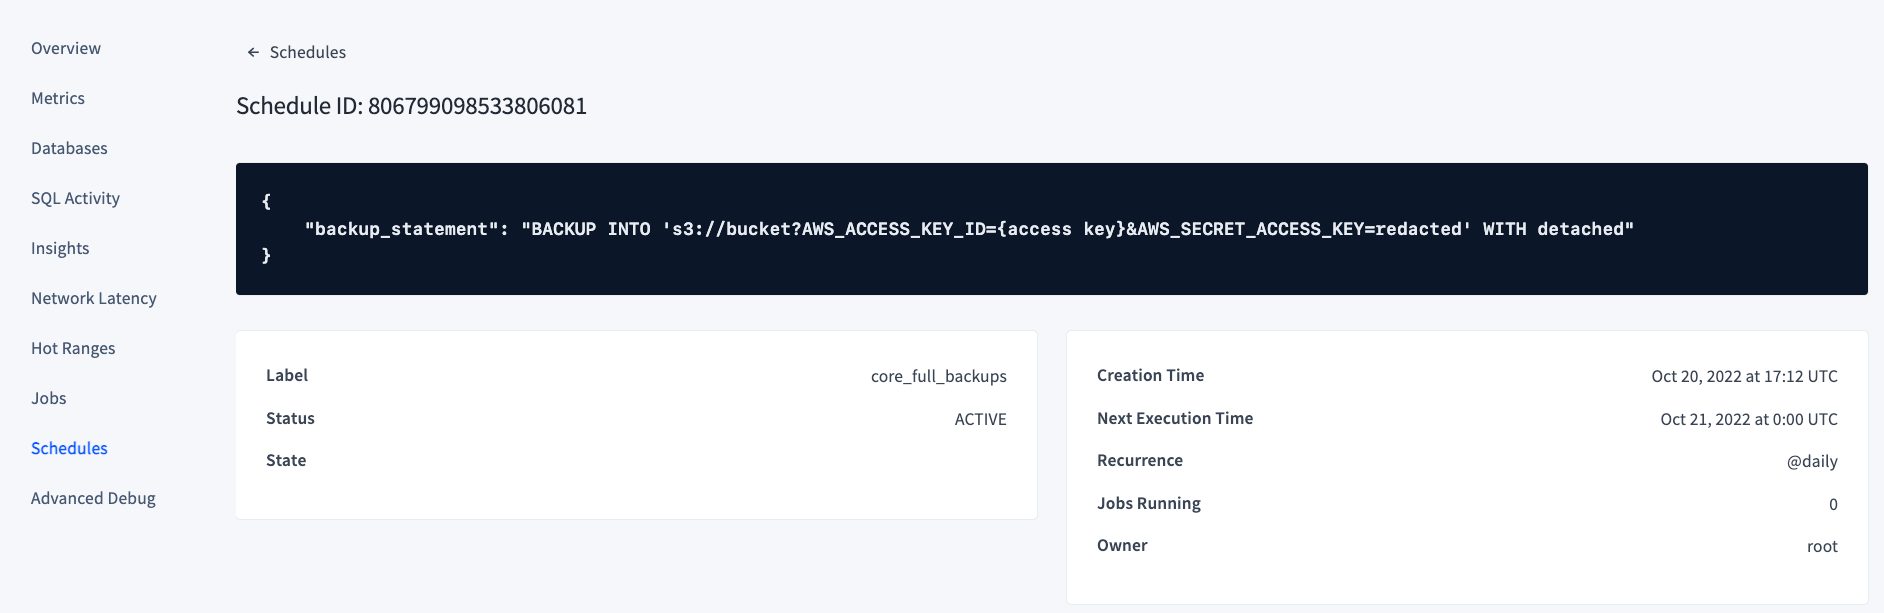
protected_timestamp_record on this page. This indicates that the schedule is actively managing its own records independently of . See for more detail.