> ## Documentation Index
> Fetch the complete documentation index at: https://www.cockroachlabs.com/llms.txt
> Use this file to discover all available pages before exploring further.
# Monitor CockroachDB with Kibana
export const InternalLink = ({version, path = "", children, ...props}) => {
let detectedVersion = version || "stable";
if (typeof window !== 'undefined' && !version) {
const match = window.location.pathname.match(/\/docs\/([^/]+)/);
if (match) {
detectedVersion = match[1];
}
}
const normalizedPath = path.startsWith("/") ? path.slice(1) : path;
return
{children}
;
};
[Kibana](https://www.elastic.co/kibana) is a platform that visualizes data on the [Elastic Stack](https://www.elastic.co/elastic-stack). This page shows how to use the [CockroachDB module for Metricbeat](https://www.elastic.co/guide/en/beats/metricbeat/current/metricbeat-module-cockroachdb) to collect metrics exposed by your CockroachDB self-hosted cluster's Prometheus endpoint in Elasticsearch and how to visualize those metrics with Kibana.
To export metrics from a CockroachDB Cloud cluster, refer to Export Metrics From a CockroachDB Advanced Cluster instead of this page.
In this tutorial, you will enable the CockroachDB module for Metricbeat and visualize the data in Kibana.
For more information about using the CockroachDB module for Metricbeat, see the [Elastic documentation](https://www.elastic.co/guide/en/beats/metricbeat/current/metricbeat-module-cockroachdb).
If you run into problems with this integration, please file an issue on the [Beats issue tracker](https://github.com/elastic/beats).
## Before you begin
Either of the following:
* Hosted [Elasticsearch Service](https://www.elastic.co/guide/en/kibana/current/get-started#set-up-on-cloud) with [Metricbeat configured](https://www.elastic.co/guide/en/beats/metricbeat/current/configure-cloud-id)
* Self-managed [Elastic Stack](https://www.elastic.co/guide/en/elastic-stack-get-started/current/get-started-elastic-stack) with [Metricbeat installed](https://www.elastic.co/guide/en/beats/metricbeat/7.13/metricbeat-installation-configuration)
This tutorial assumes that you have started a secure CockroachDB cluster. CockroachDB Cloud does not expose a compatible monitoring endpoint.
## Step 1. Enable CockroachDB module
From your Metricbeat installation directory, run:
```shell theme={"theme":{"light":"catppuccin-mocha","dark":"catppuccin-mocha"}}
./metricbeat modules enable cockroachdb
```
### Configure security certificates
Open `modules.d/cockroachdb.yml` in your Metricbeat installation directory.
Follow the steps in the [Elastic documentation](https://www.elastic.co/guide/en/beats/metricbeat/current/configuration-ssl) to enable SSL on the CockroachDB module.
For example, if you used `cockroach cert` to secure your cluster, the YAML should look like:
```yaml theme={"theme":{"light":"catppuccin-mocha","dark":"catppuccin-mocha"}}
- module: cockroachdb
metricsets: ['status']
period: 10s
hosts: ['localhost:8080']
enabled: true
ssl.verification_mode: full
ssl.certificate_authorities: "/custom/dir/path/ca.crt"
ssl.certificate: "/custom/dir/path/client.root.crt"
ssl.key: "/custom/dir/path/client.root.key"
```
`ssl.certificate_authorities`, `ssl.certificate`, and `ssl.key` should specify the full file paths to your CA certificate, client certificate, and client key, respectively.
## Step 2. Start Metricbeat
Load the Kibana dashboards (this may take a few moments):
```shell theme={"theme":{"light":"catppuccin-mocha","dark":"catppuccin-mocha"}}
./metricbeat setup
```
Launch Metricbeat:
```shell theme={"theme":{"light":"catppuccin-mocha","dark":"catppuccin-mocha"}}
./metricbeat -e
```
## Step 3. View CockroachDB dashboards on Kibana
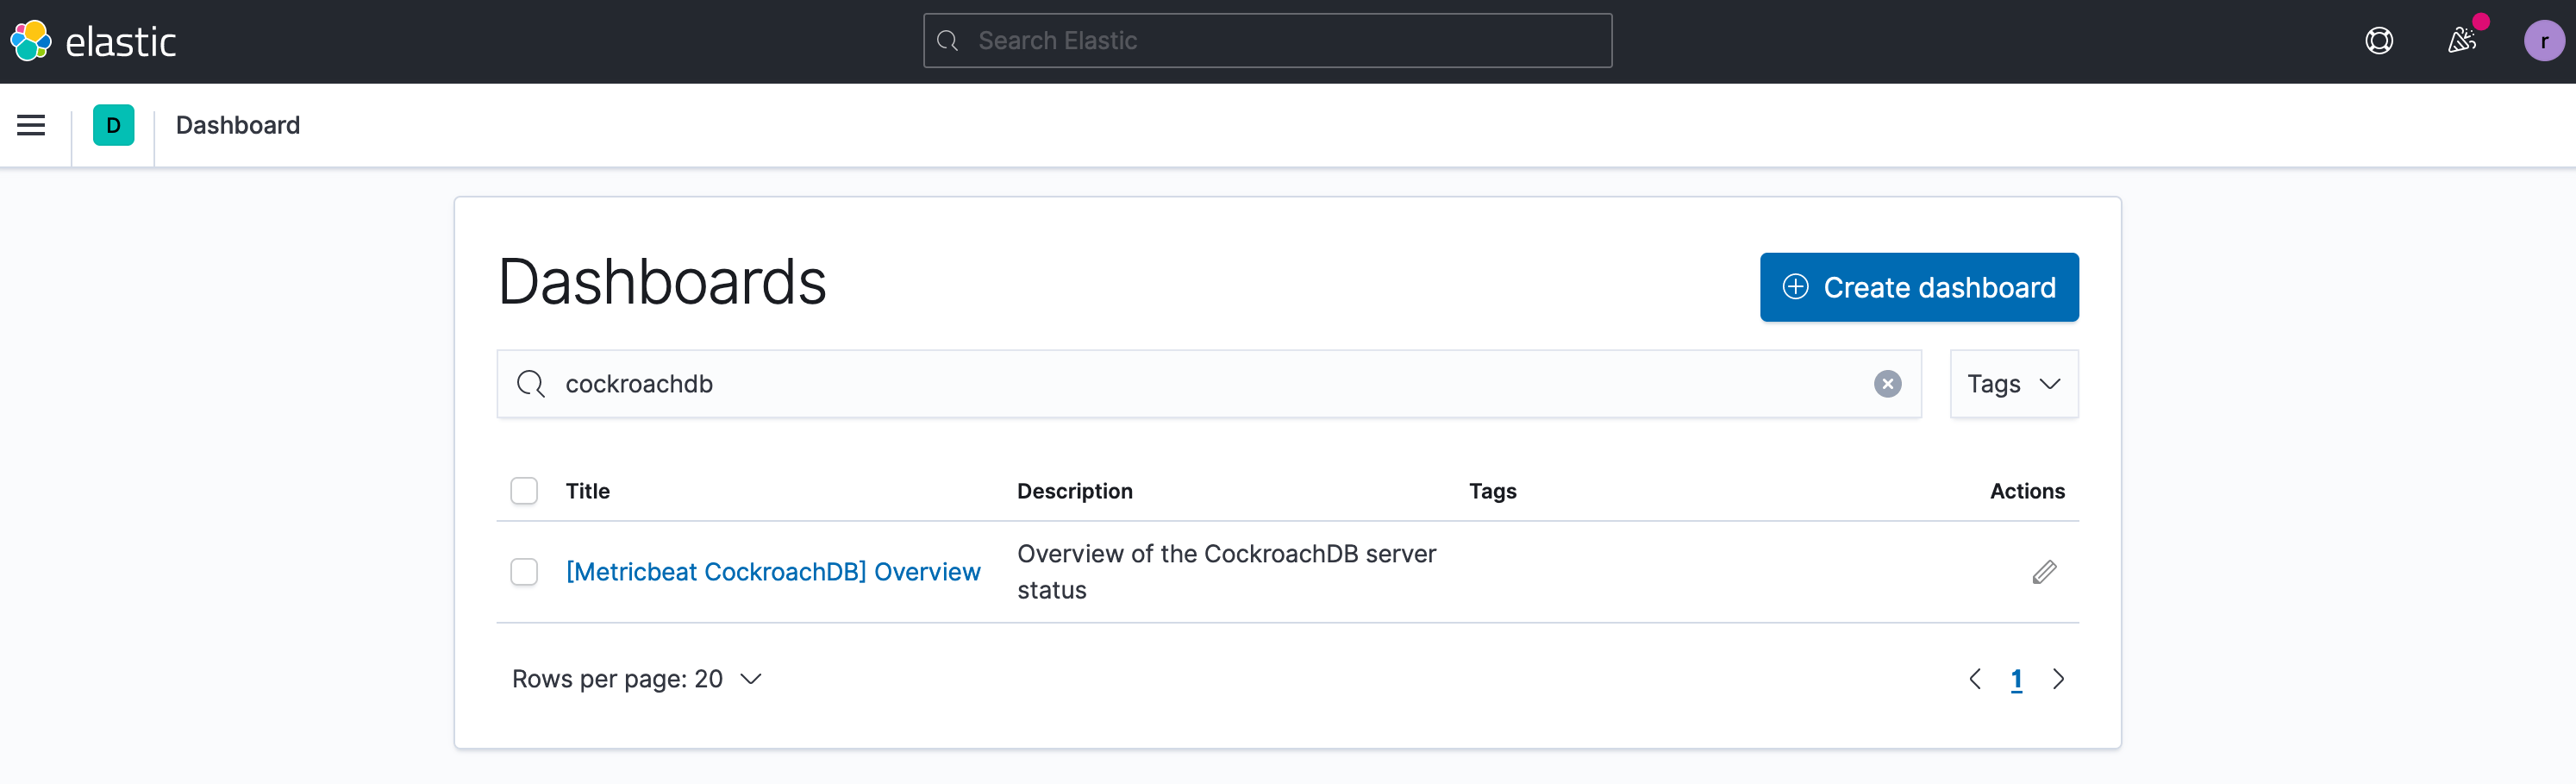
Open the Kibana web interface and click **Dashboard**.
Search for the CockroachDB dashboard:
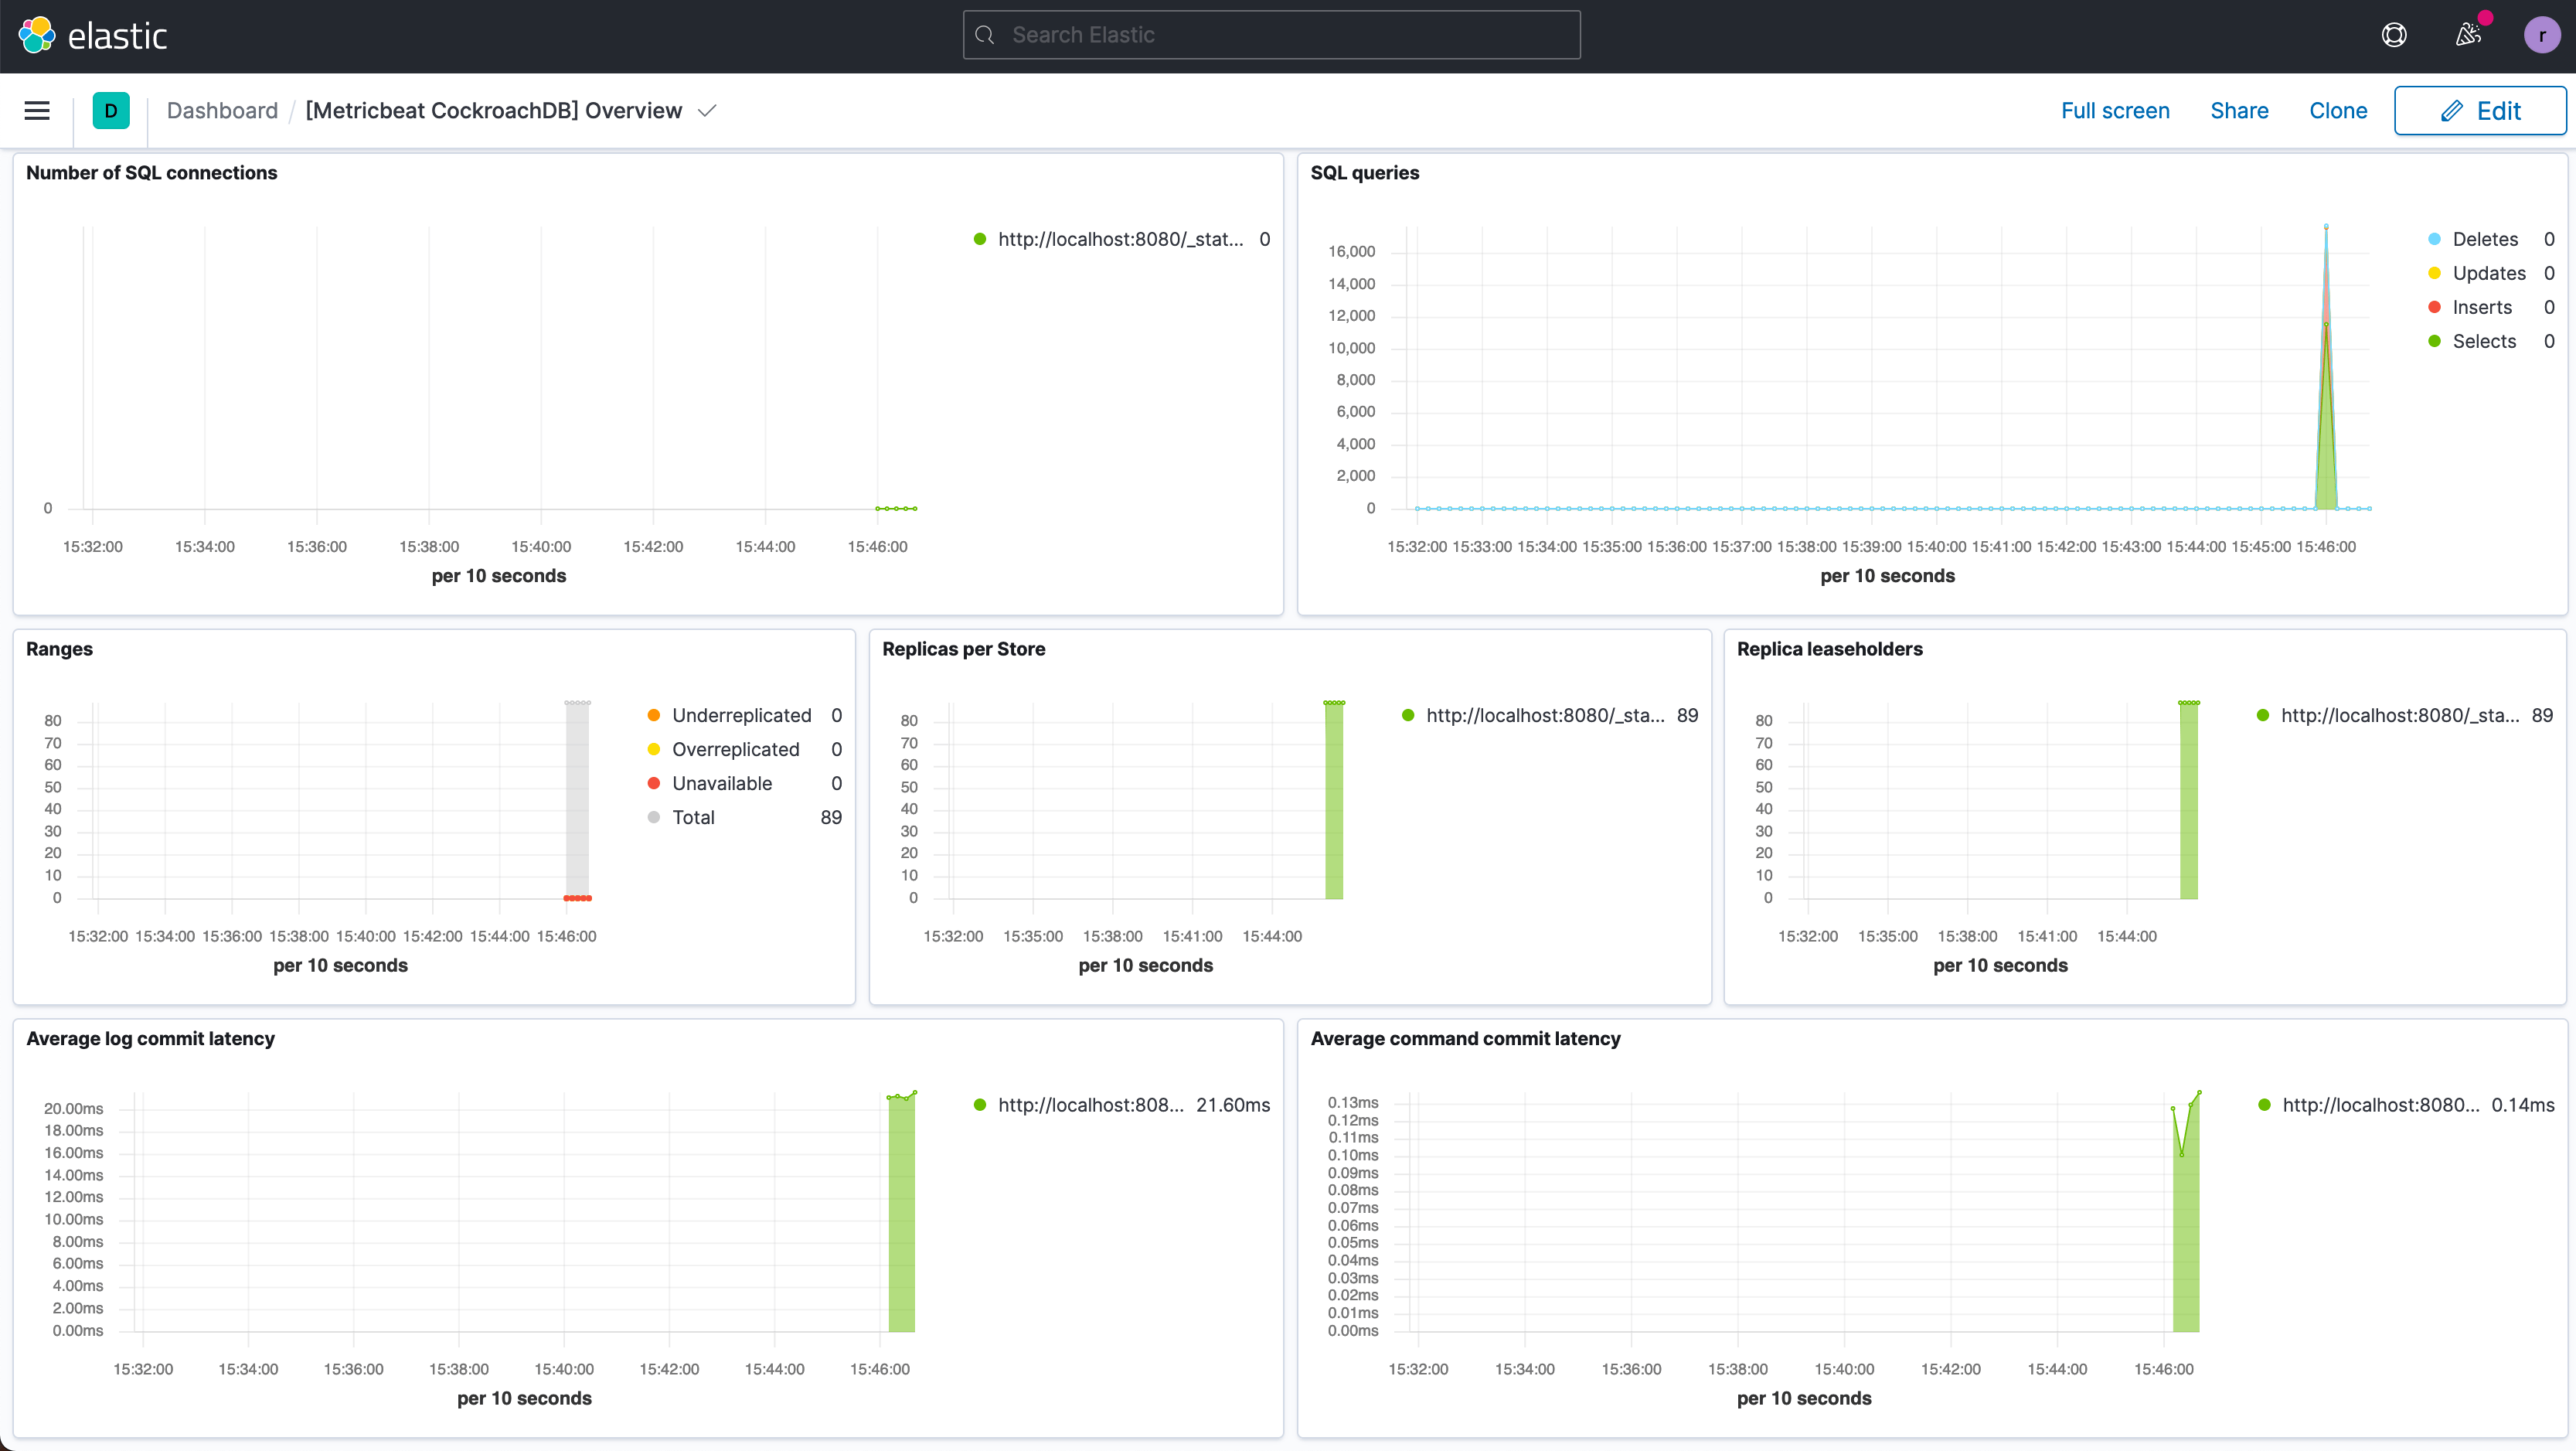
 Click the dashboard title to open the dashboard, which presents metrics on replicas and query performance:
 ## Step 4. Run a sample workload
To test the dashboard functionality, use `cockroach workload` to run a sample workload on the cluster.
Initialize the workload for MovR, a fictional vehicle-sharing company:
```shell theme={"theme":{"light":"catppuccin-mocha","dark":"catppuccin-mocha"}}
cockroach workload init movr 'postgresql://root@localhost:26257?sslcert=certs%2Fclient.root.crt&sslkey=certs%2Fclient.root.key&sslmode=verify-full&sslrootcert=certs%2Fca.crt'
```
Run the MovR workload for 5 minutes:
```shell theme={"theme":{"light":"catppuccin-mocha","dark":"catppuccin-mocha"}}
cockroach workload run movr --duration=5m 'postgresql://root@localhost:26257?sslcert=certs%2Fclient.root.crt&sslkey=certs%2Fclient.root.key&sslmode=verify-full&sslrootcert=certs%2Fca.crt'
```
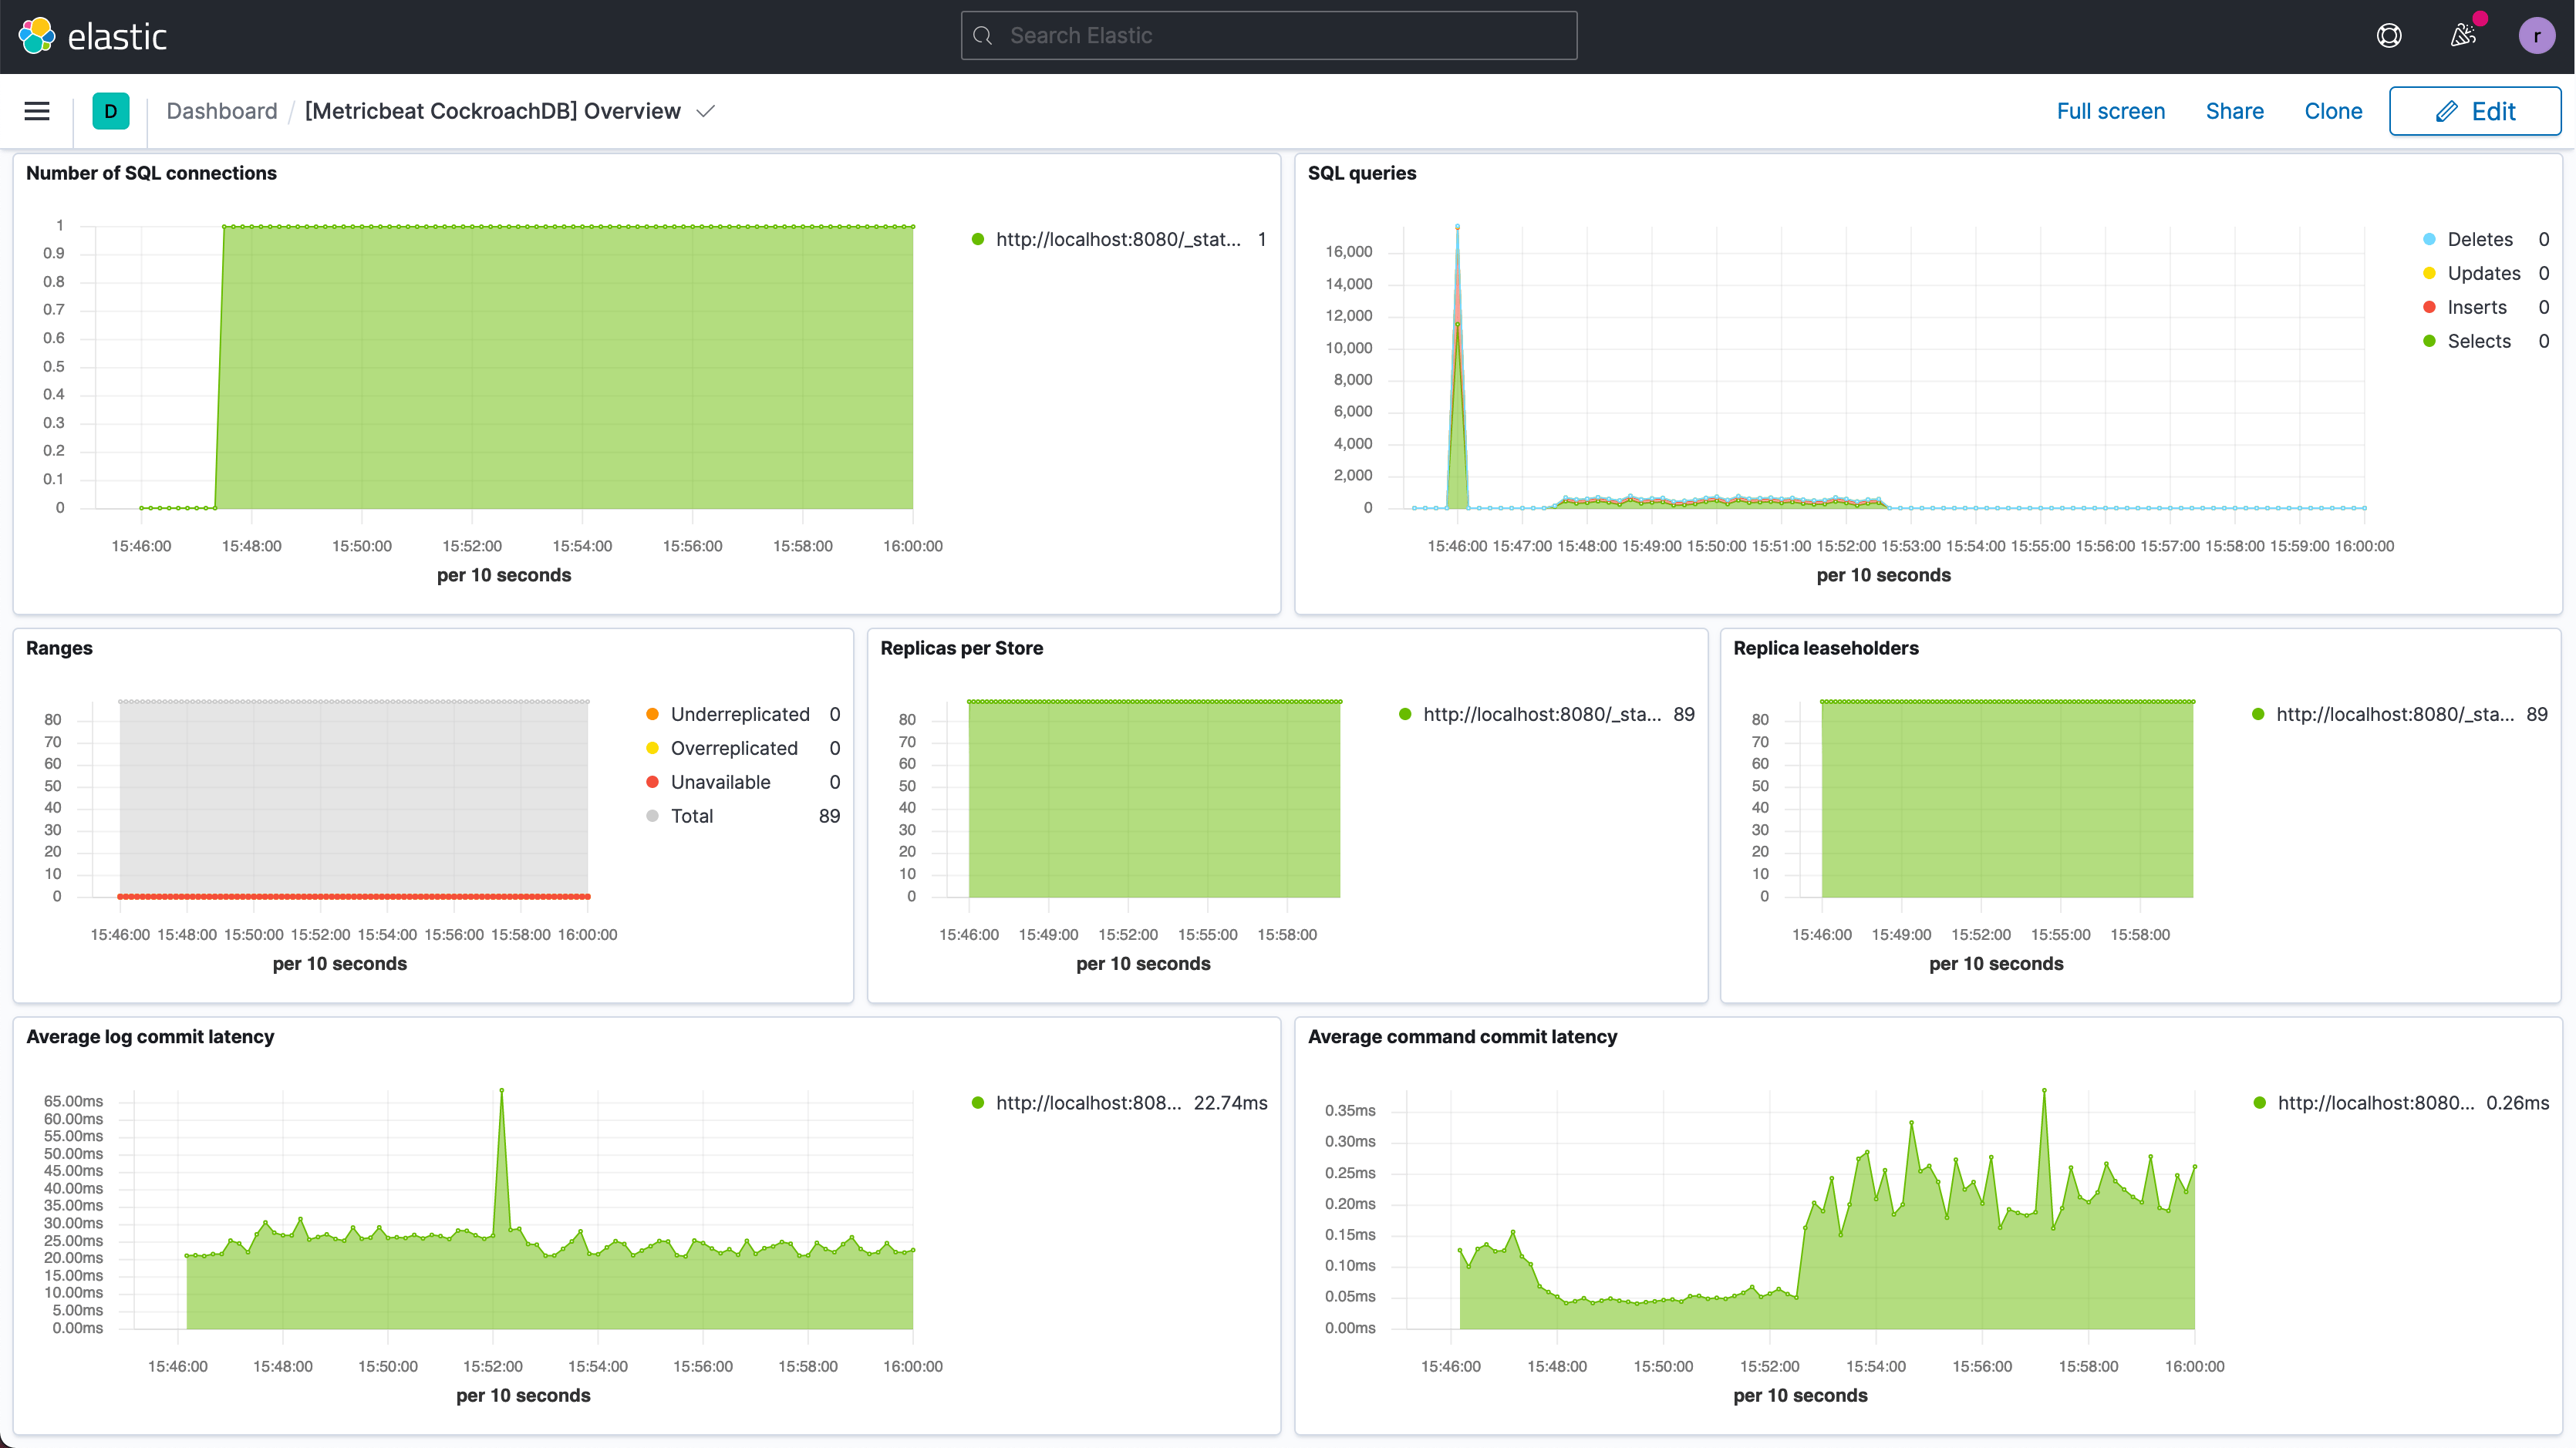
Click **Refresh**. The query metrics will appear on the dashboard:
## Step 4. Run a sample workload
To test the dashboard functionality, use `cockroach workload` to run a sample workload on the cluster.
Initialize the workload for MovR, a fictional vehicle-sharing company:
```shell theme={"theme":{"light":"catppuccin-mocha","dark":"catppuccin-mocha"}}
cockroach workload init movr 'postgresql://root@localhost:26257?sslcert=certs%2Fclient.root.crt&sslkey=certs%2Fclient.root.key&sslmode=verify-full&sslrootcert=certs%2Fca.crt'
```
Run the MovR workload for 5 minutes:
```shell theme={"theme":{"light":"catppuccin-mocha","dark":"catppuccin-mocha"}}
cockroach workload run movr --duration=5m 'postgresql://root@localhost:26257?sslcert=certs%2Fclient.root.crt&sslkey=certs%2Fclient.root.key&sslmode=verify-full&sslrootcert=certs%2Fca.crt'
```
Click **Refresh**. The query metrics will appear on the dashboard:
 ## See also
* Monitoring and Alerting
* DB Console Overview
* Logging Overview
## See also
* Monitoring and Alerting
* DB Console Overview
* Logging Overview