
The Schedules page of the DB Console provides details about the scheduled tasks performed by your cluster. These can include:
To view these details, access the DB console and click Schedules in the left-hand navigation.
Filter schedules
- Use the Status menu to filter schedules by schedule status, displaying all schedules, only active schedules, or only paused schedules.
- Use the Show menu to toggle displaying the latest 50 schedules or all schedules on the cluster.
Schedules list
Use the Schedules list to see your active and paused schedules.
- To view schedule details click the schedule ID.
- If you drop a schedule, it will no longer be listed.
The following screenshot shows a list of backups and automated statistics compaction schedules:
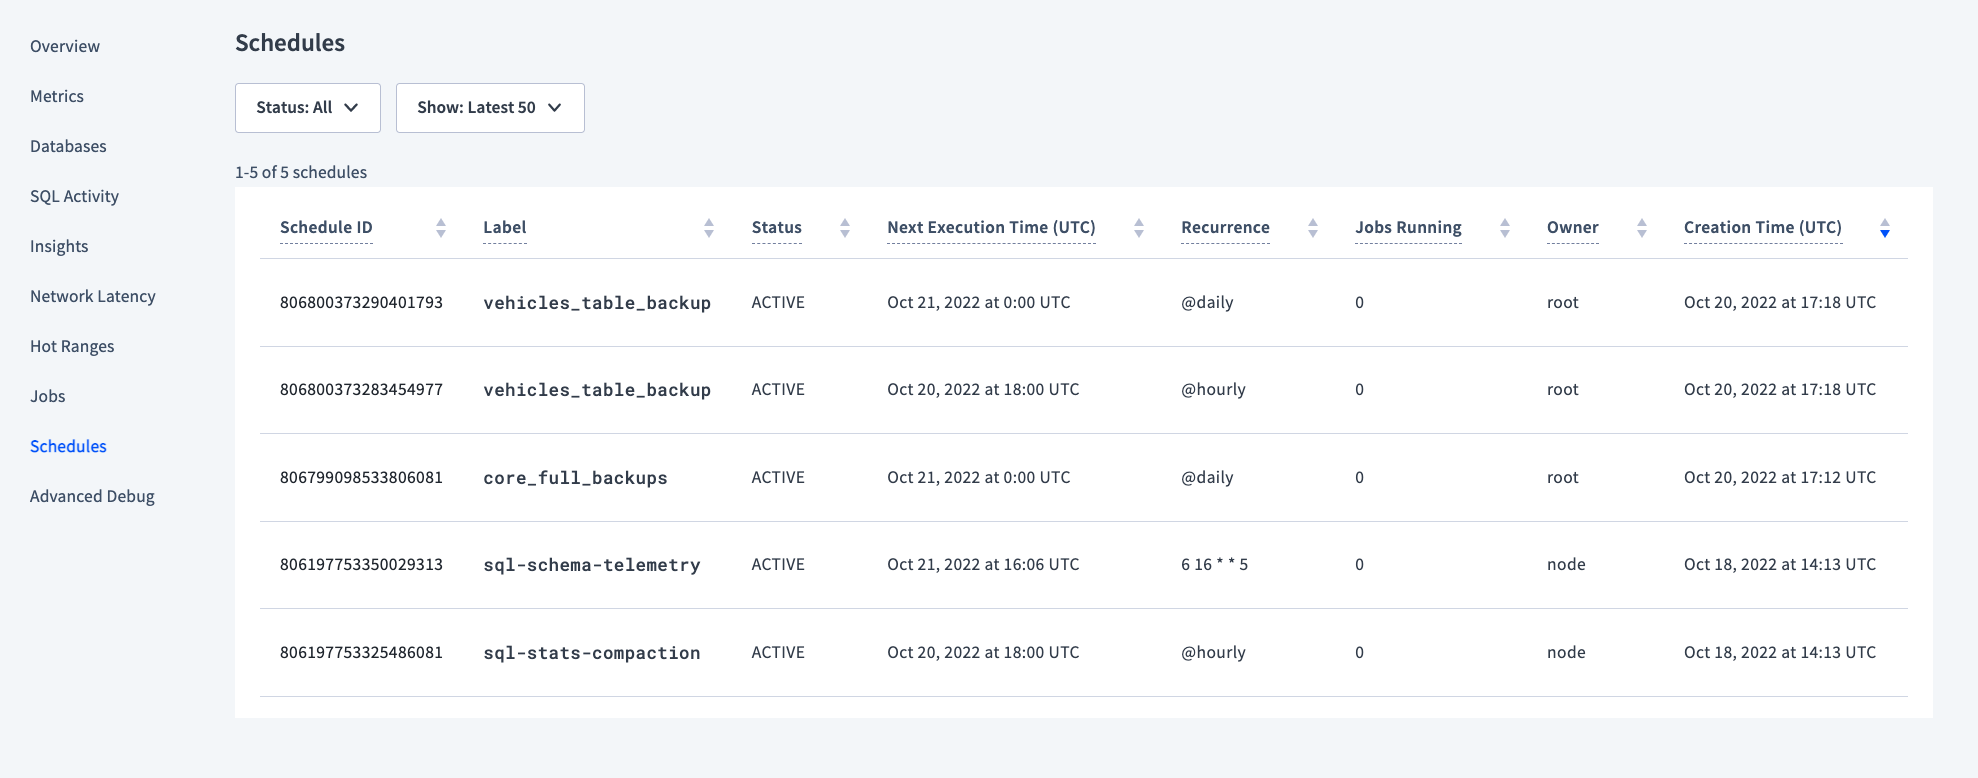
| Column | Description |
|---|---|
| Schedule ID | The unique ID for the schedule. This is used to pause, resume, and drop schedules. |
| Label | The label given to the schedule on creation. |
| Status | The current status of the schedule, Active or Paused. |
| Next Execution Time (UTC) | The next time at which the scheduled task will run. |
| Recurrence | How often the schedule will run. |
| Jobs Running | The number of jobs currently running for that schedule. |
| Owner | The user that created the schedule. |
| Creation Time (UTC) | The time at which the user originally created the schedule. |
Schedule details
Click on a schedule ID to view the full SQL statement that the schedule runs. For example, the following screenshot shows the resulting BACKUP statement for a full cluster backup recurring every day:
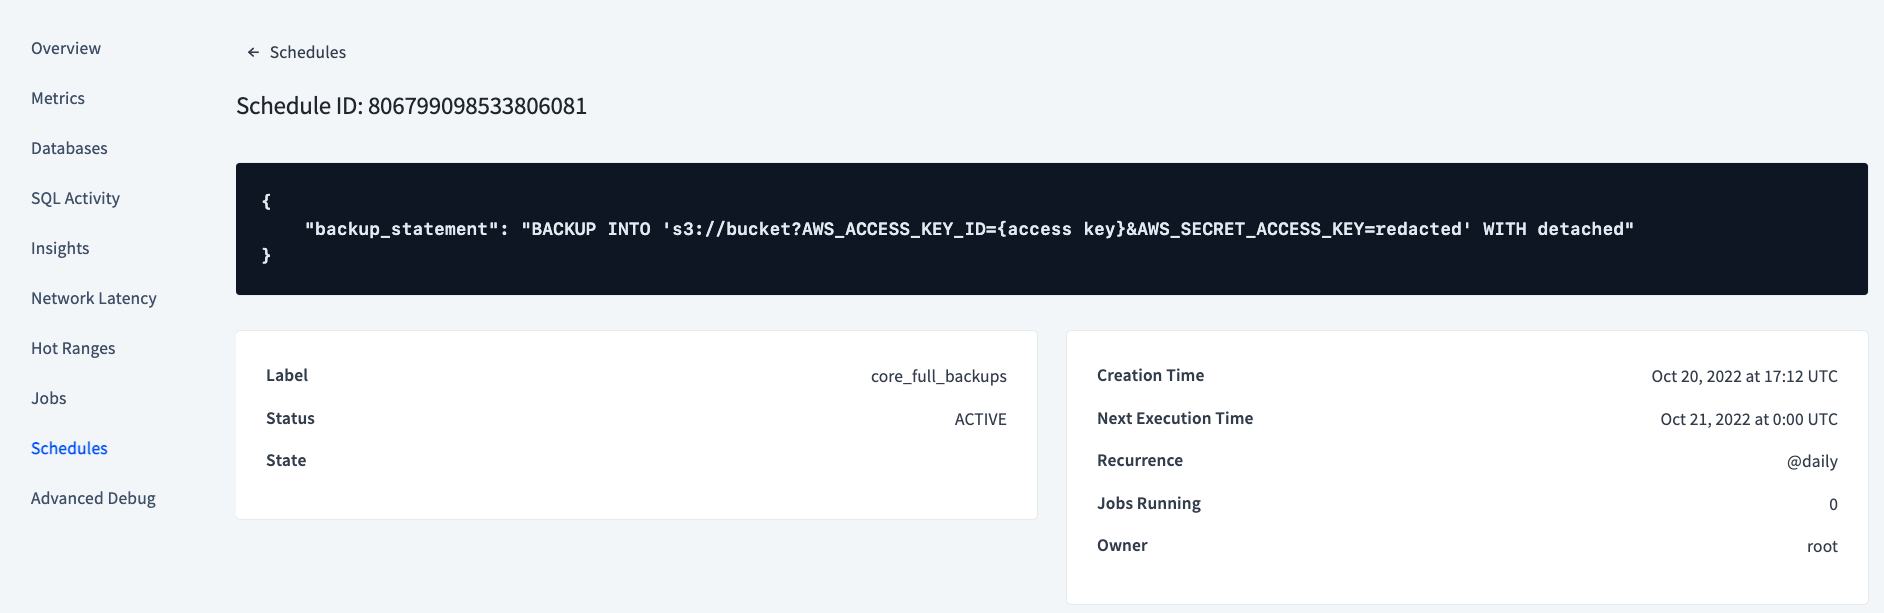
You may also view a protected_timestamp_record on this page. This indicates that the schedule is actively managing its own protected timestamp records independently of GC TTL. See Protected timestamps and scheduled backups for more detail.
See also
Was this helpful?