
Since the 2.1 release, CockroachDB has had a cost-based optimizer. Rewriting a big component of an existing system is always challenging. In particular, we really wanted to avoid regressing on any workloads, including simple transactional queries where the existing planner was already generating the best plan. A cost-based optimizer inherently does more work and thus involves longer planning times. To mitigate this, we worked on caching and reusing optimizer state across multiple instances of the same query. For now, we chose a conservative path: only cache state from which we can still generate the best plan (the one we would have generated without caching), making caching invisible to the user.
We’ll start with an overview of the stages of the query planning process; then we’ll go over the methods clients can use to issue queries against CockroachDB, and finally we’ll discuss the caching work we have done to speed up query planning.
Optimization stages
The query planning process encompasses everything that happens from the point where CockroachDB receives a query, to the point where we have specific instructions for the execution layers describing how the query is to be executed. Planning a query using the optimizer is comprised of 5 stages:
1. Parse: Parsing is the very first thing thing that happens to a SQL query: the SQL string is syntactically validated and converted to an abstract syntax tree (AST). There is no semantic analysis of the query at this stage.
2. OptBuild: The next step to planning a query is to analyze the AST semantically and convert it to a relational expression tree. This is the part of the code that “understands” SQL, and includes resolving database object names as well as type checking and type inference.
3. Normalize: Optimizers have a large collection of “rewrite" transformations (we call them normalization rules). These rules convert a relational expression to another equivalent expression that is likely to result in a better plan. These transformations are assumed to be “always good” and do not look at the estimated cost of plans. Major classes of normalization rules are: constant folding, pushing down filters, decorrelation, and elision or simplification of unnecessary operators.
In our implementation, the Normalize and OptBuild steps are not separate processes: they are intertwined, with normalization rules running as soon as possible on subtrees generated by the OptBuild process. This is done for efficiency: it avoids creating temporary expressions that are then discarded; for example, if we have a filter that we determine is always true, the filtering operator is eliminated before creating an expression for it. Despite this detail, the Normalize and OptBuild steps can still be considered conceptually separate - and we can even measure their running time separately, by recording the build time with and without normalization rules enabled.
4. Explore: Exploration rules are transformations that generate new relational expressions that are equivalent to a starting expression and which might or might not result in faster execution. The exploration step runs all exploration rules, generating many possible expressions. For each expression we estimate a cost, and at the end of the process we pick the cheapest expression. To efficiently store and process these expressions, we use a Memo data which organizes expressions into equivalency groups (more details about the Memo can be found in the previous blog post).
5. ExecBuild: The final step is to convert the final optimized expression to a data structure that is understood by the execution engine.
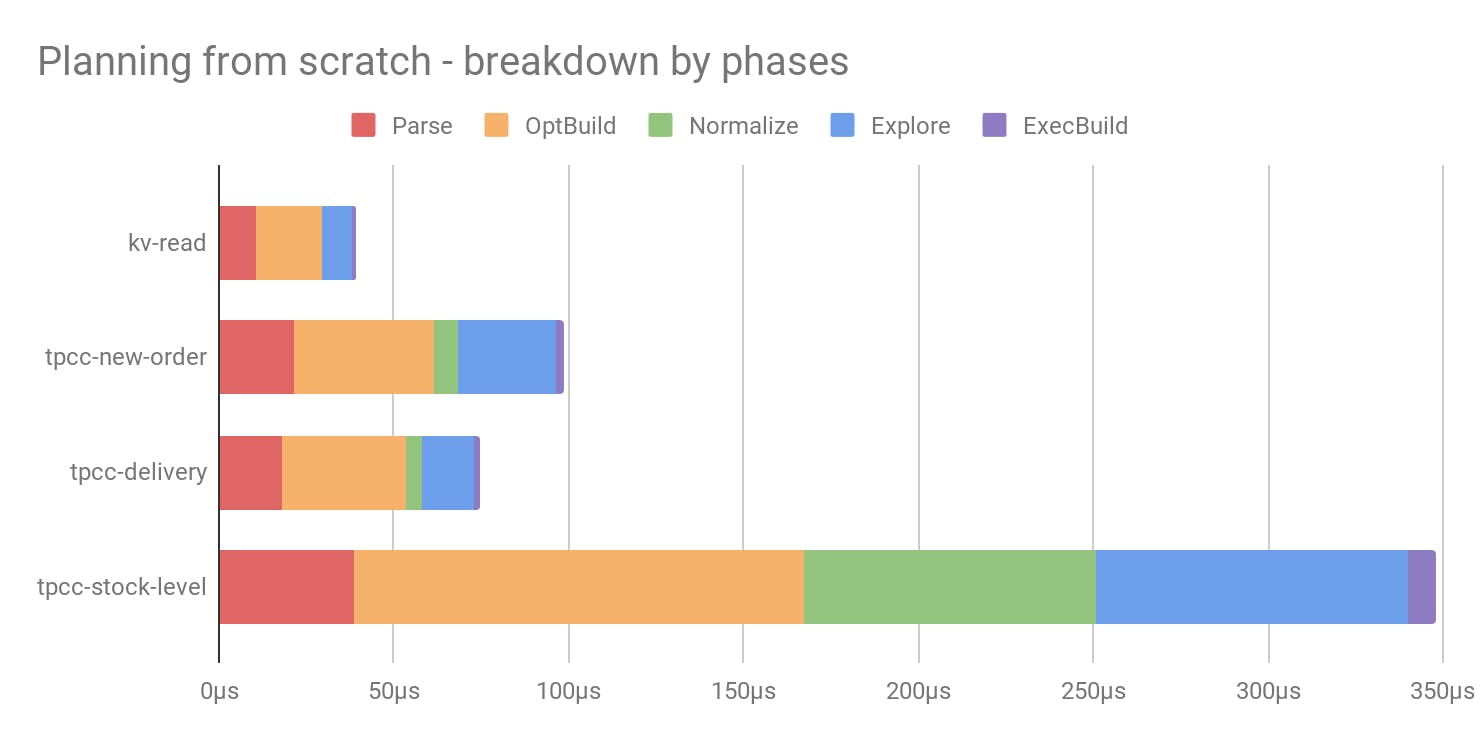
To get an idea of how long these stages take, we look at a sample set of queries:
- kv-read: a single-row scan from a simple key-value table;
- tpcc-new-order: a single-row scan on a more complicated table (with an index);
- tpcc-delivery: an ordered scan with limit;
- tpcc-stock-level: a join followed by an aggregation.
The chart below shows the planning time for these queries, broken down into stages. We can see that the first stages consume a significant part of the planning time, so caching the results of these stages would be a worthwhile optimization.
Query issue methods
To understand when and how these stages run, we have to be cognizant of how queries are issued by clients. This involves some details of the PostgreSQL’s network protocol called pgwire, which is used between the database client and CRDB. pgwire defines two ways of issuing queries:
1. Simple protocol: can only be used when the query has no arguments; everything must be embedded in the SQL string, which is sent to the server in a single request. For example (using Go’s database/sql library):
db.QueryRow(“SELECT v FROM kv WHERE k = 10”)
2. Extended protocol: must be used when the query has arguments. In this case the SQL string has “placeholders” ($1, $2, etc.) which refer to arguments that are serialized and sent separately. For example:
db.QueryRow(“SELECT v FROM kv WHERE k = $1”, 10)
Conceptually there are two main steps:
-
- Prepare: a request is sent with just the SQL string. The server parses the query and makes sure it is valid and semantically sound.
- Execute: a Bind request is sent with the values for the query arguments (in this example, the integer 10), followed by an Execute request.
The extended protocol is the recommended way to pass arguments to the server, preferable to embedding the values in the SQL string because it eliminates the need to correctly escape values (and thus prevents SQL injection attacks). Unfortunately, it is also inefficient because it requires the server to process multiple requests (and with many client drivers it involves two roundtrips). But it is possible to explicitly prepare a statement once, and then keep reusing the prepared statement, only repeating the Execute step:
stmt, err := db.Prepare(“SELECT v FROM kv WHERE k = $1”)
stmt.Query(10)
stmt.Query(11)
…
Reusing a prepared statement allows the server to do some of the work once and then reuse it for every execution.
There are thus three possible methods to issue queries, which we will refer back to:
- simple: simple protocol (no arguments)
- prepare-each: extended protocol, each statement is prepared and executed. This is the least efficient method.
- prepare-once: extended protocol, reusing explicit prepare. This is the most efficient method.
Each of these methods requires different techniques for caching planning state. For our 2.1 release, we focused on optimizing the most efficient method prepare-once. In the subsequent release, we extended caching to cover the other methods as well.
Query Caching in CockroachDB 2.1
Going back to the optimization stages, what stages do we need to run and when? For the simple protocol, we run through all the stages. What about preparing a statement? To check that the statement is semantically sound, we need to run the Parse and OptBuild/Normalize stages. To execute the statement later, we would of course like to pick up where the prepare step left off and continue with the rest of the stages. Unfortunately, we can’t do that in general. If the statement was prepared some time ago, the meaning of the query could be different now. A few examples of problematic things that could happen in-between the prepare and the execution step:
- A table used by the query is dropped and another table with the same name is created instead. This table resolves to a different internal table ID and could have different column names or types.
- A schema change removes a column used by the query.
- The current database could have been changed, affecting resolution of unqualified table names.
In all these cases, the result of the OptBuild stage changes.
There is another wrinkle here: in the preparation stage, the query contains placeholders (like $1, $2) which don’t yet have values. When we pick things off in the execution step, we must replace these placeholders with their values. This might trigger additional normalization rules. For example, a condition like $1 = ‘foo’ can be normalized to true or false when we replace $1 with a definite value. We refer to this step as AssignPlaceholders and it involves processing the optimizer’s relational tree to replace placeholders with their values and running any new normalization rules that can be applied.
Placeholders without values also greatly affect the results of the Explore stage, in large part because we need definite values to constrain scans to specific parts of a table or index. There is thus little value in running this stage during the prepare step.
The work we did on planning state caching in the 2.1 release revolved around addressing these difficulties and usually reusing the state generated during prepare and continuing with the AssignPlaceholders and Explore step. This involved detecting all the conditions where reusing the state could lead to different results, and building infrastructure to replace the placeholders with their values.
This was important for getting good performance with the prepare-once method (which should be the method of choice for performance-sensitive workloads). This caching also speeds up the execution step of prepare-each, but this method is still relatively inefficient because of the prepare step (which runs for every query instance).
Query Caching in CockroachDB 19.1
For our 19.1 release, we wanted to build upon the previous caching work to speed up the other two issue methods. We implemented a server-wide query cache, which remembers recent SQL queries.
For queries with no arguments, the cache holds the final expression (the result of the Explore step). Thus, repeating a query frequently using the simple method is much cheaper. Note however, that with this method, the query string contains all the values of the query. If we run a similar query but with different values, it would be considered a different query.
For queries with arguments, the cache holds the expression generated by the Normalize step. This state can be reused if the same query is prepared frequently, as is the case with the prepare-each method.
Unfortunately, for historical reasons the current code modifies the abstract syntax tree (generated in the Parse step) in place during OptBuild. This means that we cannot reuse the AST across queries; so even if a query is in the cache, we still need to parse it. This is something we are planning to fix in the next major release.
Results
Recall the benchmark that breaks down query planning time by phases:
If we use the prepare-once method and execute a previously prepared statement, we store the result of the Parse/OptBuild/Normalize stages with the prepared statement and on each execution we can proceed with the AssignPlaceholders/Explore/ExecBuild stages:
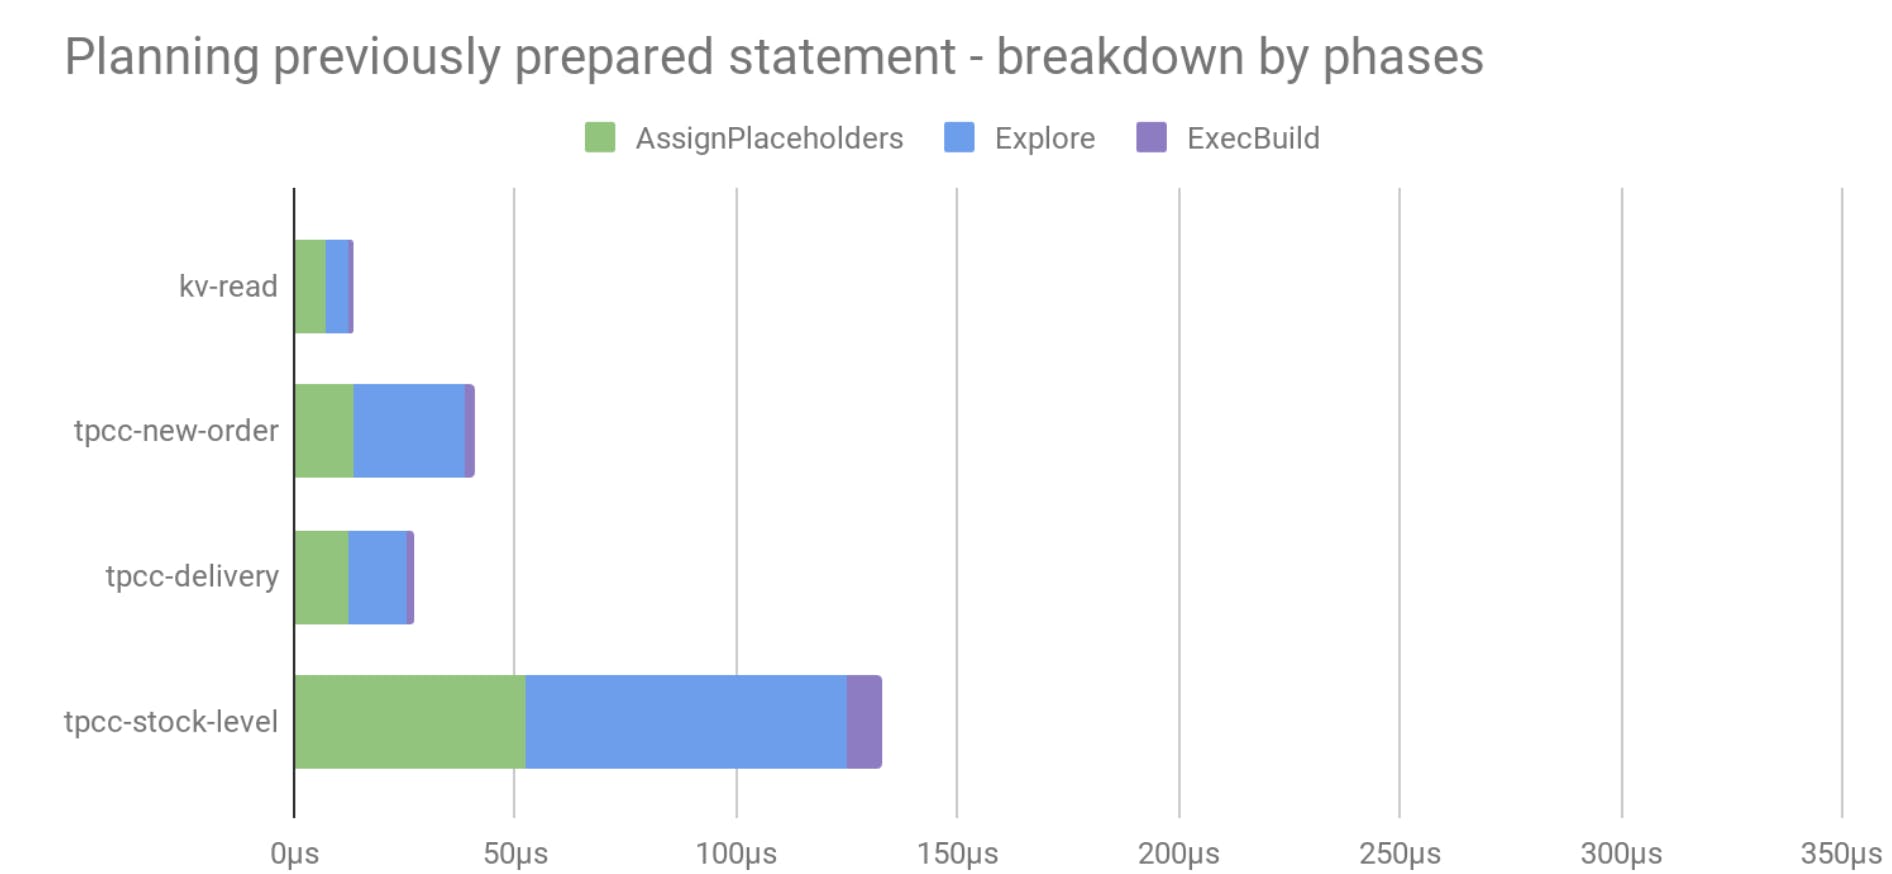
This is a significant (more than 50%) reduction in planning time. Of course, in most cases the actual execution will involve more work than planning, so the improvement in the overall performance will be more subtle. To illustrate the end-to-end throughput (which includes execution time), we look at a benchmark on a KV workload (simple key-value reads and writes):
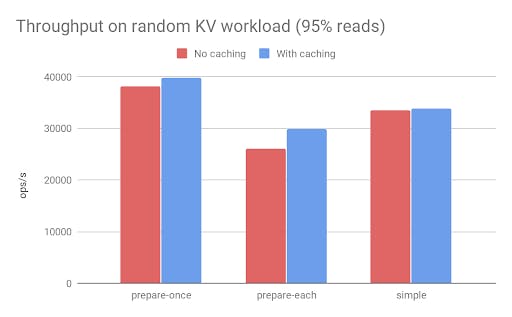
Note that the keys in this benchmark are uniformly random, which explains why we don’t get any benefit with the simple query mode: each query instance will have a different SQL query string (because it contains a random key). Skewed versions of the workload in which some keys are accessed much more frequently than others do show some benefit.
Future Work
The caching we implemented so far is intended to be invisible to the user. It is merely an internal mechanism to speed things up, and the resulting execution plans are identical to the plans we would get without caching.
However, in many cases, we could get a lot more benefit if we relaxed this and allowed reusing a plan that was generated using different values. For example, in the key-value workload above, each instance of the query gets the same plan regardless of the values. This would allow us to elide most of the planning work. To implement this, we need to extend our internal infrastructure to allow expression and costing of a fully optimized plan which still has placeholders.
In addition, if the optimizer is going to make a decision that can affect the query plan, we would have to give the user visibility into this process and provide relevant controls. This blends into related future work for plan management which aims to give users more control over the query plans.
Another improvement direction would be to detect cases where a query is frequently run with the exact same argument values, and cache the final plan (again, allowing elision of most of the planning work).
Finally, an idea for improving the simple method would be to automatically parameterize queries (effectively converting them internally to something like prepared queries with arguments).
Conclusion
We’ve touched upon a few areas of our query planning process, as part of an ongoing series of posts on the optimizer. Building a modern query optimizer is a huge challenge; Andy Pavlo once mentioned a saying: if you try to do query optimization and fail, you can always fall back to rocket science. It will take a number of releases to extend our capabilities, as well as refine and improve our approach. We are, however, making progress at a fast pace and we hope you will follow along with us as our optimizer matures.